


Abstract
Some women take medication during pregnancy to address a variety of clinical conditions. Because of ethical and logistical concerns, it is impossible to determine fetal drug exposure, and therefore fetal risk, during pregnancy. Hence, alternative approaches need to be developed to predict maternal-fetal drug exposure throughout pregnancy. To do so, we previously developed and verified a maternal-fetal physiologically based pharmacokinetic model, which can predict fetal exposure to drugs that passively cross the placenta. However, many drugs are actively transported by the placenta (e.g., human immunodeficiency virus protease inhibitors). To extend our maternal-fetal physiologically based pharmacokinetic model to these actively transported drugs, we determined the gestational age–dependent changes in the protein abundance of placental transporters. Total cellular membrane fractions from first trimester (T1; n = 15), second trimester (T2; n = 19), and term (n = 15) human placentae obtained from uncomplicated pregnancies were isolated by ultracentrifugation. Transporter protein abundance was determined by targeted quantitative proteomics using liquid chromatography tandem mass specrometry. We observed that breast cancer resistance protein and P-glycoprotein abundance significantly decreased from T1 to term by 55% and 69%, respectively (per gram of tissue). Organic anion–transporting polypeptide (OATP) 2B1 abundance significantly decreased from T1 to T2 by 32%. In contrast, organic cation transporter (OCT) 3 and organic anion transporter 4 abundance significantly increased with gestational age (2-fold from T1 to term, 1.6-fold from T2 to term). Serotonin transporter and norepinephrine transporter did not change with gestational age. The abundance of bile salt export pump, multidrug resistance-associated protein 1-5, Na+-taurocholate cotransporting polypeptide, OATP1B1, OATP1B3, OCTN1-2, concentrative nucleoside transporter 1-3, equilibrative nucleoside transporter 2, and multidrug and toxin extrusion 1 could not be quantified. These data can be incorporated into our maternal-fetal physiologically based pharmacokinetic model to predict fetal exposure to drugs that are actively transported across the placenta.
SIGNIFICANCE STATEMENT We quantified the protein abundance of key placental uptake and efflux transporters [organic cation transporter (OCT) 3, P-glycoprotein (P-gp), breast cancer resistance protein (BCRP)] across gestational ages (first trimester, second trimester, and term) using quantitative targeted proteomics. We observed that the protein abundance of P-gp and BCRP decreased, whereas that of OCT3 increased with gestational age. Incorporating the protein abundance determined in this study into maternal-fetal physiologically based pharmacokinetic model can help us better predict fetal drug exposure to substrates of these transporters.
Introduction
To date, approximately 40%–80% of women take drugs during pregnancy and about 50% take at least one drug in the first trimester (Scaffidi et al., 2017). Pregnant women take drugs for a variety of reasons, including to treat preexisting disease (e.g., depression, epilepsy), for pregnancy-induced conditions (e.g., gestational diabetes and hypertension), to prevent vertical transmission of infectious agents (e.g., human immunodeficiency virus, malaria), or to treat fetal conditions, such as poorly developed lungs because of preterm birth (Sheffield et al., 2014).
Despite the striking prevalence of drug use during pregnancy, there is little information on the extent of maternal-fetal drug exposure throughout pregnancy. When a pregnant woman takes a drug, the fetus is de facto exposed to the drug even if s/he is not the target for drug therapy. Fetal drug exposure, and therefore fetal risks, are driven by maternal drug exposure, placental transport/metabolism, and fetal metabolism (Zhang et al., 2017). Physiologic and drug disposition changes throughout pregnancy result in time-dependent changes in maternal drug exposure (Anderson, 2005; Tasnif et al., 2016). In addition, the placenta is richly endowed with efflux transporters, such as P-glycoprotein (P-gp; ATP-binding cassette B1)/breast cancer resistance protein (BCRP; ATP-binding cassette G2) (Mathias et al., 2005; Han et al., 2018), as well as influx transporters, such as organic anion transporter 4 (OAT4)/norepinephrine transporter (NET) (Fig. 1) (Vahakangas and Myllynen, 2009). The abundance of these placental transporters may change as pregnancy proceeds (Mathias et al., 2005). Consequently, pregnancy is a dynamic process whereby maternal-fetal drug exposure changes in a time-dependent manner. Thus, for optimum therapy of the pregnant woman and to minimize fetal risk, the challenge is to measure or predict maternal-fetal drug exposure throughout pregnancy.

Transporters, their proposed localization, and directionality of transport in the syncytiotrophoblast of the human placenta. Transporters and membrane markers that were successfully quantified are shown in green (basal membrane proteins) and blue (apical membrane proteins) (success criterion: LLOQ 5-fold signal-to-noise ratio), whereas the ones targeted but not quantifiable (below LLOQ) are shown in gray. Most abundant drug-metabolizing enzymes that are present in the placenta but upon which no attempt to quantify was made are indicated in the red oval (Blanco-Castañeda et al., 2020). The key studies informing membrane localization of the transporters were: P-gp (Atkinson et al., 2006; Sun et al., 2006); BCRP (Maliepaard et al., 2001); SERT (Balkovetz et al., 1989; Bottalico et al., 2004); NET(Bottalico et al., 2004); OCT3 (Lee et al., 2018); OAT4 (Ugele et al., 2008) and OATP2B1 (Ugele et al., 2008); and key review articles (Myllynen et al., 2009; Vahakangas and Myllynen, 2009; Joshi et al., 2016; Han et al., 2018). BSEP, bile salt export pump; CNT, concentrative nucleoside transporter; GST, glutathione S-transferase; MATE1, multidrug and toxin extrusion 1; MRP, multidrug resistance-associated protein; NTCP, Na+-taurocholate cotransporting polypeptide; SULT, sulfotransferase; UGT, glucuronosyltransferase.
Although fetal drug exposure can be determined by sampling cord blood (umbilical vein) only at the time of delivery, such sampling is not possible earlier in gestation (Scaffidi et al., 2017). Also, sampling umbilical vein blood at term provides only a snapshot of fetal blood drug concentration at a given time and does not provide information on fetal drug exposure (i.e., fetal plasma/blood area under the curve) (Zhang et al., 2017). Moreover, even though pharmacokinetic studies of a drug can theoretically be conducted in pregnant women throughout gestation, such studies pose considerable logistical and ethical challenges. Thus, alternative methods need to be developed to predict (rather than determine) maternal-fetal drug exposure throughout pregnancy. To do so, we have developed and verified a maternal-fetal physiologically based pharmacokinetic model that can predict time-dependent changes in maternal-fetal exposure to drugs metabolized by CYP enzyme and cross the placenta by passive diffusion (Zhang and Unadkat, 2017). However, many drugs are transported at the blood-placental barrier, which is made of the syncytiotrophoblast layer of the placental villi (Enders and Blankenship, 1999; Myllynen et al., 2005; Joshi et al., 2016). To extend our maternal-fetal physiologically based pharmacokinetic model to predict maternal-fetal exposure to drugs that are transported into or out of the placenta, we determined the gestational age–dependent changes in the abundance of placental transporters by targeted quantitative proteomics using LC-MS/MS.
Materials and Methods
Chemicals and Reagents.
Homogenization buffer reagents and the protease inhibitor cocktail, Pefabloc SC, were purchased from Sigma-Aldrich (St. Louis, MO) and Roche, Basel, Switzerland. Omni Bead Ruptor Homogenizer, 7-ml soft tissue tubes, and metal beads for homogenization were purchased from Omni International (Kennesaw, GA). Bicinchoninic acid assay kit, dithiothreitol, iodoacetamide, and sequencing grade trypsin were obtained from Pierce Biotechnology (Rockford, IL). Isotope-labeled heavy internal standard peptides were obtained from Thermo Fischer Scientific (Rockford, IL), and corresponding unlabeled surrogate peptides were purchased from New England Peptide (Gardner, MA) (Supplemental Table 1). High-performance liquid chromatography–grade acetonitrile, methanol, chloroform, formic acid, and ammonium bicarbonate were obtained from Thermo Fischer Scientific (Fair Lawn, NJ). Sodium deoxycholate (98% purity) was purchased from MP Biomedicals (Santa Ana, CA).
Procurement of Human Placental Tissue Samples.
Collection of placentae from uncomplicated pregnancies was approved and classified as nonhuman subject research by the Institutional Review Board of the University of Washington. Placentae were classified into three gestational age groups (mean ± S.D.): first trimester (T1: 63.1 ± 10.8 days, n = 15), second trimester (T2: 117 ± 19.6 days, n = 19), and term (n = 15) (Supplemental Table 3; Table 1). To be consistent with the definition of gestational age used by The American College of Obstetricians and Gynecologists, T1 and T2 gestational ages were expressed based on the last menstrual period. These ages were determined by adding 14 days to the age based on fetal foot size. Gestational age of term placentae was not available. T1 and T2 placentae were obtained from University of Washington Birth Defect Research Laboratory. Term placentae were obtained from the Labor and Delivery Unit of the University of Washington. After collection, tissues were immediately snap frozen and stored at −80°C.
Gestational age grouping, protein yield, and membrane marker enrichment of placentae
Data shown as mean ± S.D. Identical symbols next to the values (†, ‡, $, & or ^) denote significant differences between the respective values (Kruskal-Wallis test with Dunn’s multiple comparisons, P < 0.05).
Total Membrane Preparation and Quantitative Targeted Proteomics.
Total membranes from human placentae were isolated by means of differential centrifugation (Supplemental Fig. 1). Briefly, frozen tissue was thawed, washed, blotted, and weighed, and approximately 1.5–2 g was homogenized in Omni Bead Ruptor Homogenizer. Aqueous buffer containing 250 mM sucrose, 100 mM KNO3, 0.2 mM CaCl2, 10 mM HEPES, and 10 mM Tris (pH 7.4) was used for homogenization. Protease inhibitor cocktail Pefabloc SC (Roche) was used to prevent protein degradation. The homogenates were then centrifuged for 30 minutes at 10,000g at 4°C in Optima L-90K Ultracentrifuge (Beckman Coulter, Brea, CA) to generate S9 fractions, which were immediately centrifuged for 1 hour at 125,000g at 4°C to generate cytosolic and total membrane fractions (i.e., microsomal, apical, and basal plasma membranes combined). An aliquot of homogenate and membrane fractions were vesiculated through a 6-gauge needle (to resuspend the sample) and diluted to working concentration of 2 mg of total protein/ml as quantified by Pierce bicinchoninic acid assay.
To quantify the membrane proteins by targeted proteomics, total proteins in the homogenate and membrane fractions were reduced, denatured, alkylated and concentrated, and digested by trypsin as described previously (Wang et al., 2005; Vertommen et al., 2010). All samples were digested in triplicates after addition of bovine serum albumin (BSA; 4 µg/ml). Digestion of BSA was used to correct for any variability in digestion efficiency. Heavy-labeled internal standard of each peptide was added at the end of the trypsin digestion process. Surrogate peptides were quantified on AB SCIEX Triple Quad 6500 tandem mass spectrometer coupled with Waters Acquity ultra-performance liquid chromatography system (Waters, Hertfordshire, UK) (Supplemental Fig. 1; Supplemental Tables 1 and 2). Calibration curve for surrogate peptide quantification consisted of buffer A spiked with known quantities of synthetic light peptides.
To assess interday variability in protein abundance, membrane fractions were prepared on three different days from site 1 of T2 placentae (n = 3). To assess whether protein abundance was site-dependent, membrane fractions from three different sites were prepared on the same day from these T2 placentae (n = 3). Only second trimester placentae were used for these analyses because the umbilical cord placement and morphology were visible for only these placentae (Supplemental Fig. 2A).
Data Analysis and Scaling.
Peak areas for two (and, when possible, three transitions) for each surrogate peptide of interest and labeled internal standard were integrated using the Analyst software (SCIEX). The average of these peak area ratios was then computed, and protein abundance was calculated from calibration curves prepared in buffer A and analyzed as described before (Prasad et al., 2016). Quality control samples were similarly prepared in triplicate at the low (0.62 and 1.25 nM), middle (10 nM), and upper (40 nM) range of the calibration line. Each LC-MS/MS run was considered qualified if the means of the quality control samples were within 20% of the nominal values.
To account for variability in digestion efficiency, protein abundance was normalized to the maximum observed BSA digestion efficiency. In addition, to account for intertissue variability in membrane isolation, the enrichment of the apical membrane marker [alkaline phosphatase (ALP)] and basal membrane marker (Na+/K+-ATPase) was quantified. ALP and Na+/K+-ATPase were selected because these proteins are highly abundant in the apical membrane and basal membrane, respectively. Membrane marker enrichment was defined as the ratio of marker abundance in 1 mg of total membrane protein (MP) to marker abundance in 1 mg of homogenate protein (HP) (eq. 1). Transporters preferentially expressed in apical or basal membranes were corrected for the corresponding membrane marker enrichment (dividing by the marker enrichment value), which then was scaled to abundance per gram tissue as shown in eq. 2. Additionally, the resulting value per gram tissue was scaled to picomole analyte per predicted weight of the whole placenta. The weight of each placenta was estimated as a function of gestational age using a method described earlier (eq. 3) (Abduljalil et al., 2012). Predicted placental weight values were used because of the lack of information on the exact weight of each placenta. (1)
(1) (2)
(2) (3)Abundance values for organic anion–transporting polypeptide (OATP) 2B1 in several T2 samples were below the lower limit of quantification (LLOQ) as defined by LC-MS/MS signal less than five times background noise. Such values were conservatively assigned the value of LLOQ. Data were analyzed by nonparametric Kruskal-Wallis and Dunn’s multiple comparison test in GraphPad Prism 7 with statistical significance of P < 0.05. Site-dependent and interday variability data were analyzed by Kruskal-Wallis test with Dunns’s multiple comparisons (Supplemental Fig. 2). Continuous data were analyzed by Pearson correlation, and significance cut-off was defined as R2 ≥ 0.5 (Supplemental Fig. 5; Table 2).
Protein-protein correlation of placental transporter abundance (N = 49)
Correlations with Pearson correlation of R2 > 0.5 (black cells).
Results
Interday and Site-Dependent Variability in Transporter Abundance.
Transporter protein abundance in three T2 placentae was independent of the sampling site and day of preparation (Supplemental Fig. 2, B and C), and hence, site 1 was chosen as the sampling site for further analyses. Overall, placenta H27108 showed greater variability than other two placentae (unpublished data), perhaps because of its earlier gestational age.
Total Membrane Yield, Marker Enrichment, and Scaling Approach.
As expected, membrane protein yield was about 3% of that in the homogenate. There was modest but significant difference in protein yields between the trimesters (Fig. 2; Table 1). Na+/K+-ATPase enrichment did not change significantly between three gestational age groups. ALP enrichment was significantly different at term compared with T1 and T2 (Table 1). A strong correlation was observed between enrichment of ALP and Na+/K+-ATPase within each preparation (R2 > 0.63, P < 0.05, unpublished data), confirming the utility of these markers in addressing membrane loss during preparation. Hence, we incorporated membrane marker enrichment values into our scaling approach (eqs. 1–3) using ALP for transporters expressed on the apical membrane and Na+/K+-ATPase for transporters expressed on the basal membrane of the syncytiotrophoblast.

Total protein yield in HP and MP isolated from T1, T2, and term placentae. Lines denote mean and S.D. (T1, n = 15; T2, n = 19; term, n = 15). Significant differences by Kruskal-Wallis Test (with Dunn’s multiple comparisons) are indicated. Mean values are also presented in Supplemental Table 4.
Abundance of Apical and Basal Membrane Transporters in Human Placentae of Various Gestational Ages.
Of the four apical membrane transporters, BCRP and P-gp showed gestational age–dependent decrease in protein abundance (pmol of analyte per gram of tissue) between T1 and term (55% and 69%, respectively) and between T2 and term (42% and 52%, respectively (Fig. 3; Supplemental Table 4). Neither SERT nor NET showed significant change in protein abundance with gestation. Of the three basal membrane transporters, OCT3 and OAT4 showed, respectively, 2-fold (between T1 and term) and 1.6-fold (between T2 and term) increase in protein abundance. OATP2B1 showed significant (32%) decrease in protein abundance between T1 and T2 (Fig. 3; Supplemental Table 4). OATP2B1 was below LLOQ (0.46 nM) in five T2 samples, and hence, these samples were assigned the value of LLOQ. When the values were scaled to the predicted size of the whole placenta, all proteins showed drastic increase in abundance with gestational age (Supplemental Fig. 3B). In addition to the above proteins, the remaining transporters targeted for quantification were below the LLOQ (5-fold signal-to-noise ratio) (Fig. 1; Supplemental Table 1).
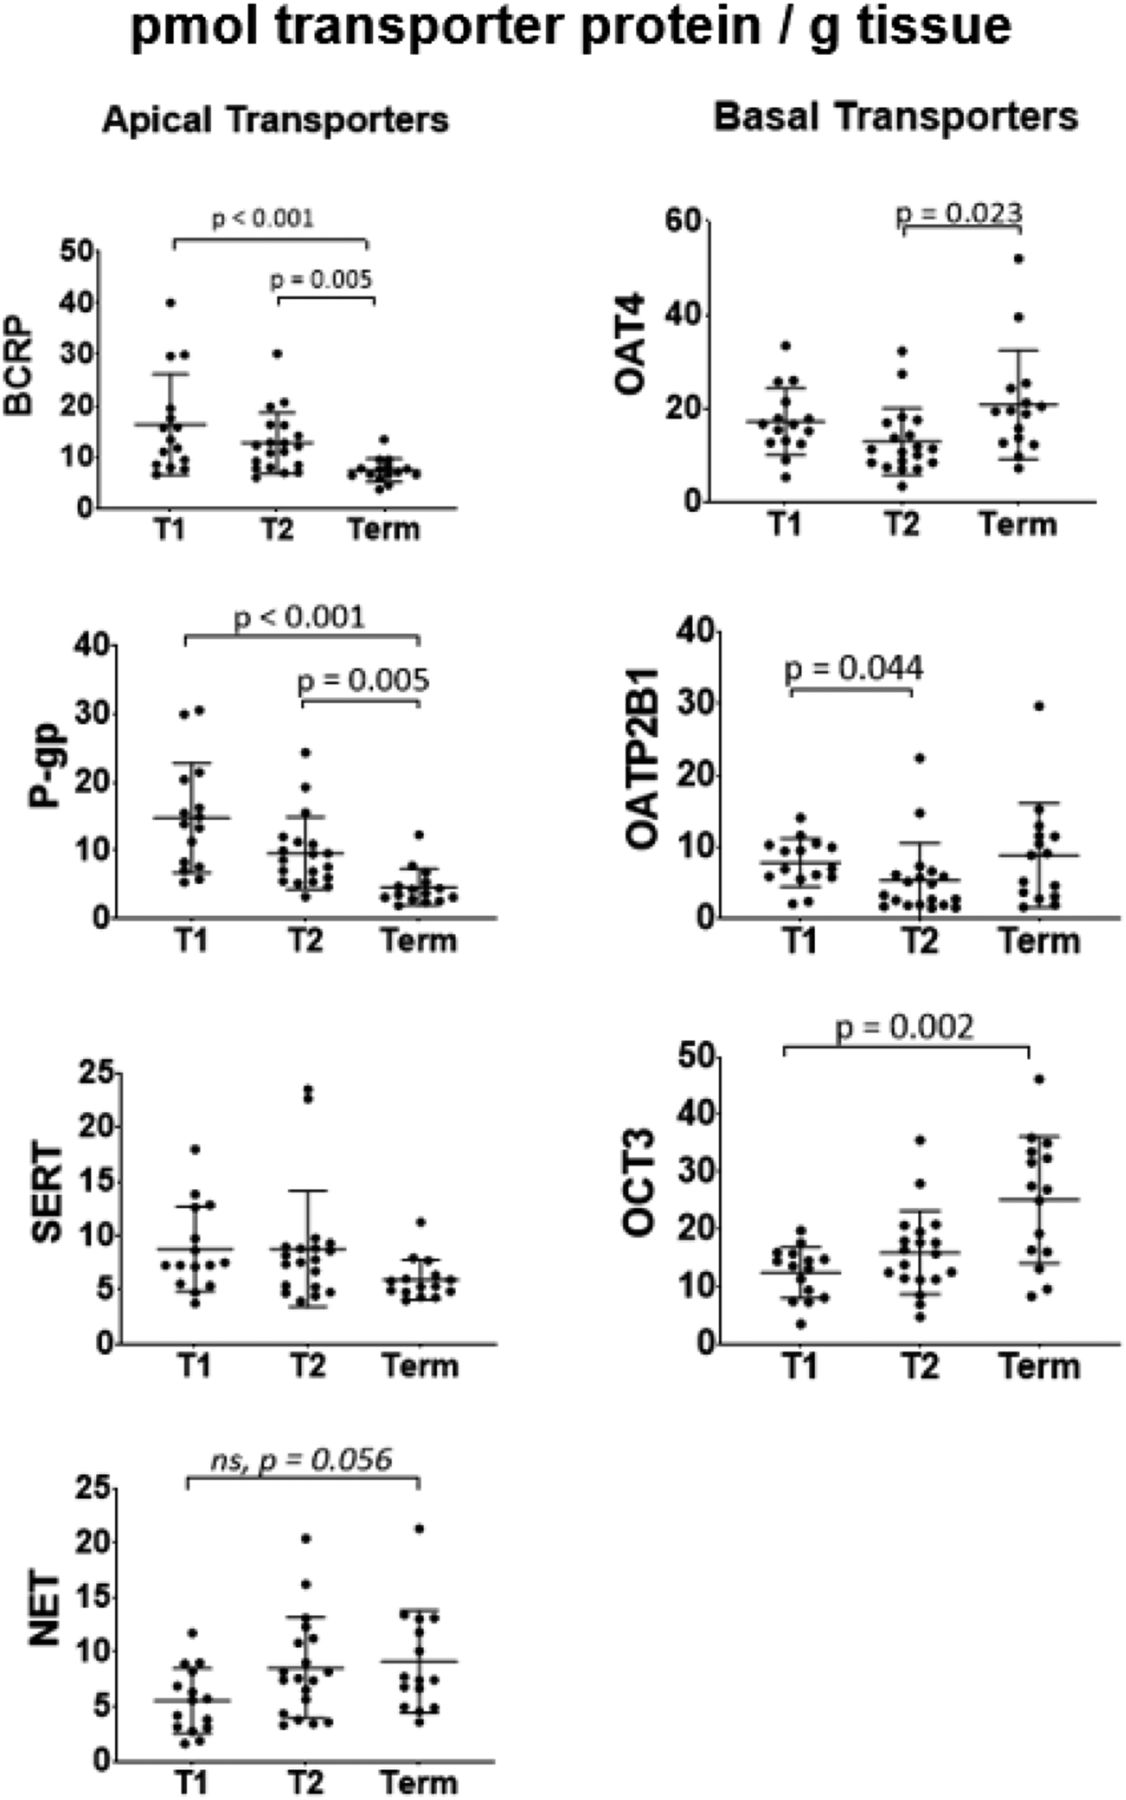
Protein abundance of apical and basal membrane transporters in human placentae of three gestational ages (picomoles per gram tissue). Abundance of BCRP was 55% lower at term than in T1 and 42% lower at term than in T2 (P < 0.05). Abundance of P-gp was 69% lower at term than in T1 and 52% lower at term than in T2 (P < 0.05). Abundance of OCT3 was 2-fold higher at term than in T1. Abundance of OAT4 was 1.6-fold higher at term than in T2. Abundance of OATP2B1 was 32% lower in T2 than in T1. Neither SERT nor NET showed significant change in protein abundance with gestational age. Dots are measured values, and lines are mean and S.D. (T1, n = 15; T2, n = 19; term, n = 15); only significant differences (Kruskal-Wallis Test with Dunn’s multiple comparisons) are shown except for NET, wherein ns denotes marginally insignificant difference.
Transporter Abundance at Three Gestational Ages.
When abundances of all proteins across the three gestational age groups were compared (Fig. 4), term placentae looked notably distinct from T1 and T2. When relative transporter protein abundance was compared (Fig. 4, pie charts), the decrease in apical membrane transporters (black bars: from 55% in T1 to 33% at term) and increase in basal membrane transporters (gray bars: from 45% in T1 to 67% at term) were observed.

Protein abundance of transporters in human placentae per gram of tissue [(A–C) bar graphs] or as percent of the total abundance of the quantified transporters [(A–C) pie charts] at three gestational ages. The data show the changes in pattern of expression as pregnancy proceeds. T1 and T2 placentae show similar pattern of transporter abundance, whereas term placentae show a distinct pattern. The change in contribution of all basal membrane transporters increased from 45%/46% in T1/T2 to 67% at term. Consequently, apical membrane transporter contribution decreased from 55%/54% in T1/T2 to 33% at term. Data shown in bar graphs are mean ± S.D. Data were analyzed using the Kruskal-Wallis Test with Dunn’s multiple comparisons.
Protein-Protein Correlations of Placental Transporters.
Multiple pairs of transporters showed significant protein-protein correlation (Pearson correlation with P < 0.05) (Supplemental Fig. 5; Table 2). Strong correlations (defined as R2 > 0.5) were observed between BCRP and P-gp (R2 = 0.78), BCRP and SERT (R2 = 0.62), P-gp and SERT (R2 = 0.63), and OAT4 and OATP2B1 (R2 = 0.53).
Discussion
Although placental transporter abundance has been previously quantified by us (Mathias et al., 2005) and others (Gil et al., 2005; Meyer zu Schwabedissen et al., 2006; Sun et al., 2006), these studies have used either Western blotting/ELISA to quantify the transporters or qPCR to quantify transporter mRNA expression (Nishimura and Naito, 2005). Western blot is inherently semiquantitative and cannot be used to compare the abundance of multiple transporters without the availability of protein standards. mRNA abundance does not always correspond to protein abundance and cannot be used for PBPK modeling and simulation. To address the shortcomings of previous studies, we incorporated several unique features in the study presented here. First, we used the state-of-the art targeted quantitative proteomics method to quantify the abundance of multiple transporters, a method that does not depend on the availability of protein standards. These transporters were chosen based on previously published gene expression data (mRNA or protein) indicating that they are present in the human placenta (Gil et al., 2005; Mathias et al., 2005; Nishimura and Naito, 2005; Meyer zu Schwabedissen et al., 2006; Sun et al., 2006). Second, we quantified the abundance of transporters across multiple gestational ages from placentae obtained from uncomplicated pregnancies. Third, we extended the transporters quantified to those not previously studied (e.g., SERT, NET). Fourth, we used a greater number of placentae in each gestational age (n = 15) than prior studies. Fifth, we determined whether the abundance of the transporters in the placentae was sample site–dependent. Sixth, we corrected the intertissue variability in membrane isolation by utilizing enrichment of validated membrane markers, ALP and Na+/K+-ATPase.
We did not observe any significant differences when preparations were made on different days or sampled from different sites (Supplemental Fig. 2). Lack of interday variability indicated our technical consistency in preparation methodology, and lack of site-dependent variability implied homogeneous distribution of transporters throughout placenta and was also observed before in term placentae (Memon et al., 2014). Because of this lack of variability, we chose to prepare membrane fractions using tissue obtained from site 1 (Supplemental Fig. 2) for all the placenta samples.
We observed a 3–4-fold enrichment of membrane markers in all the preparations. Membrane marker enrichment value was incorporated into the scaling strategy to control for the variability in membrane loss between preparations. ALP and Na+/K+-ATPase were chosen as highly abundant markers detectable in both homogenate and membrane fractions. Two separate markers were chosen because of the possible differences in enrichment of apical or basal membranes. Overall, the fold-enrichment values for both markers were comparable for each gestational age except for higher ALP enrichment values at term (Table 1). Both enrichment values were relatively low compared with those reported in the literature (separate isolation of apical and basal membranes) (Kelley et al., 1983; Illsley et al., 1990; Jimenez et al., 2004). The reason for this difference is unknown but could be due to greater contamination from other membranes during our preparation. Nonetheless, the low enrichment values did not detract from our ability to quantify the most abundant and important xenobiotic transporters (i.e., P-gp, BCRP, and OCT3) while the abundance of other transporters was below limits of detection (i.e., multidrug resistance-associated protein 1-5, OATP1B1/3, multidrug and toxin extrusion 1, OCTN1/2, concentrative nucleoside transporter 2/3, bile salt export pump, and Na+-taurocholate cotransporting polypeptide) (Fig. 1; Supplemental Table 1).
We found the most pronounced differences with gestational age in abundance of BCRP, P-gp, and OCT3, whereas that of OAT4 and OATP2B1 proteins was less affected (Fig. 3). This differential gestational age–dependent transporter abundance indicates that the observed changes are not an artifact of our method. The mechanistic basis of this differential effect remains to be elucidated. Teleologically, increased abundance of efflux transporters per gram of tissue could be a mechanism to protect the fetus from exposure to xenobiotics. In addition, these results are consistent with previous studies conducted by us and others on P-gp (Gil et al., 2005; Sun et al., 2006), BCRP (Meyer zu Schwabedissen et al., 2006), and OCT3 (Lee et al., 2013). More modest changes in protein abundance for OAT4 and OATP2B1 as well as the lack of significant changes in abundance of SERT and NET are described here for the first time. Additionally, current findings agree with the previous conclusion that the placenta is the highest BCRP-expressing organ (compared with the kidney and liver) and show that placental P-gp protein abundance is similar to that in the liver (Supplemental Fig. 4).
The impact of these transporter abundances on fetal distribution of drugs can now be predicted using PBPK modeling and simulation. To do so, the abundance of the transporters in the entire organ is needed. When scaled to the whole organ, a consistent gestational age–dependent increase in abundance of all seven proteins was observed (Supplemental Fig. 3B). This finding is due to the dramatic increase in placental weight (up to 500-fold) with gestation (eq. 3) in comparison with modest changes (2–3-fold) in protein abundance per gram of tissue. Hence, placental weight becomes the major determinant for the differences observed in the whole organ.
Our quantification results captured some elements of placentogenesis, which is a very dynamic and multifaceted process (Abduljalil et al., 2012; Burton and Fowden, 2015). The pattern of placental transporter protein abundance was similar between T1 and T2 but less similar between T1/T2 and term (Fig. 4). Such observations can be explained by the T1 and T2 placentae being closer in gestational age than term placentae (Table 1) and, hence, more similar in developmental processes. Additionally, induction of parturition-responsive genes can alter placental gene expression as the organ reaches term (Peng et al., 2011). Hence, at earlier gestational ages (T1 and T2), fetal drug exposure to transporter substrates may be more similar than at term.
The observed strong correlation between pairs of protein abundances (Supplemental Fig. 5; Table 2) may indicate the involvement of common regulatory mechanisms (e.g., by the same nuclear receptor) or possibly protein-protein interactions as reported between OATP1B3 and OCT1 in human hepatocytes (Shoop et al., 2015).
Our approach to transporter quantification has several limitations. We assumed that all measured transporter proteins are active and localized to the membrane indicated in Fig. 1 rather than internalized or present in cells other than the syncytiotrophoblast layer (Vahakangas and Myllynen, 2009; Joshi et al., 2016). Since the enrichment values for both ALP and Na+/K+-ATPase were similar, misclassification as to which membrane (apical vs. basal) the transporter was localized will not have a large impact on the quantification of the transporters and eventual use of these values in in vitro to in vivo extrapolation. Although methods are available to separate the apical from the basal membrane, such methods do not yield complete purification of each membrane (Jimenez et al., 2004). Therefore, we believe that our approach of using a membrane marker is superior to experimentally attempting to separate the apical from the basal membrane. The use of biotinylation assay can potentially address localization in in vitro systems (Kumar et al., 2017), although such estimation in ex vivo tissue has not been evaluated. Furthermore, in addition to syncytiotrophoblast, some transporters (e.g., OCT3, BCRP) have been reported to be present on other placental cell types, such as the endothelial cells (Joshi et al., 2016; Lee et al., 2018). Thus, our approach may lead to an overestimation of total transporter proteins at the plasma membrane of syncytiotrophoblast.
Collectively, these data can be used to populate a maternal-fetal PBPK model to predict fetal exposure to xenobiotic transporter substrates at various gestational ages. Failing to account for placental transporter abundance changes (e.g., P-gp) may lead to biased estimates of fetal exposure to transporter substrates and therefore fetal drug toxicity and efficacy (for drugs in which fetus is a therapeutic target; e.g., antenatal corticosteroids or human immunodeficiency virus drugs). To predict fetal drug exposure, these data should be married with drug transport kinetics (i.e., Michaelis-Menten constant and Vmax) determined in vitro, wherein the in vitro Vmax can be extrapolated to that in vivo using the proteomics data presented here. Additionally, this transporter abundance can also help estimate the fraction transported in vivo by a given transporter. Estimate of fraction transported will also aid in prediction of placental drug-drug interactions that can modulate fetal drug exposure. This is especially important because when monitored from maternal plasma, perpetrator-driven inhibition of drug efflux (e.g., P-gp) can go undetected in maternal plasma while considerably modulating fetal drug exposure and therefore fetal toxicity or efficacy (Patilea-Vrana and Unadkat, 2016). Collectively, gestational age–dependent abundance of transporters in the placenta is valuable in predicting fetal drug exposure and therefore fetal efficacy and toxicity associated with drug administration during pregnancy (Zhang and Unadkat, 2017).
Acknowledgments
We would like to thank Dale Wittington and Scott Edgar for help with mass spectrometry analysis and the University of Washington Pharmacokinetics of Drug Abuse during Pregnancy (UWPKDAP) program.
Authorship Contributions
Participated in research design: Anoshchenko, Prasad, Unadkat.
Conducted experiments: Anoshchenko.
Contributed new reagents or analytic tools: Wang, Mao.
Performed data analysis: Anoshchenko.
Wrote or contributed to the writing of the manuscript: Anoshchenko, Prasad, Neradugomma, Wang, Mao, Unadkat.
Footnotes
- Received April 7, 2020.
- Accepted June 11, 2020.
This work was supported by National Institutes of Health National Institute on Drug Abuse [Grant P01-DA32507] and the Bill & Melinda Gates Foundation [Grant INV-006678].
↵
 This article has supplemental material available at dmd.aspetjournals.org.

Abbreviations
- ALP
- alkaline phosphatase
- BCRP
- breast cancer resistance protein
- BSA
- bovine serum albumin
- HP
- homogenate protein
- LC-MS/MS
- liquid chromatography tandem mass specrometry
- LLOQ
- Lower Limit of Quantification
- MP
- total membrane protein
- Na+/K+-ATPase
- sodium/potassium–ATPase
- NET
- norepinephrine transporter
- OAT4
- organic anion transporter 4
- OATP
- organic anion–transporting polypeptide
- OCT
- organic cation transporter
- P-gp
- P-glycoprotein
- PBPK
- physiologically based pharmacokinetics
- SERT
- serotonin transporter
- T1
- first trimester
- T2
- second trimester
- Copyright © 2020 The Author(s)
This is an open access article distributed under the CC BY Attribution 4.0 International license.


