


Major Role for the Cytochrome P4503A (CYP3A) Subfamily
Abstract
In vitro studies were conducted to identify the hepatic cytochrome P450 (CYP) protein(s) involved in the oxidative metabolism of [14C]clarithromycin (CLAR) in the presence of native human liver microsomes. The identity of the two major CLAR metabolites present in microsome incubates, 14-(R)-hydroxy-CLAR andN-desmethyl-CLAR, was confirmed by MS. Over the CLAR concentration range of 1.0–140 μM, the rate of CLAR 14-(R)-hydroxylation (KM = 48.7 ± 17.7 μM; Vmax = 206 ± 76 pmol/min/mg protein;Vmax/KM = 4.2 ± 0.21 μl/min/mg; mean ± SD, N = 3 livers) andN-demethylation (KM = 59.1 ± 24.0 μM; Vmax = 189 ± 52.0 pmol/min/mg protein; Vmax/Km = 3.3 ± 0.53 μl/min/mg) conformed to monophasic (saturable) Michaelis-Menten kinetics and was highly correlated (r= 0.90–0.92; p < 0.001; N = 11) with CYP3A-selective erythromycin N-demethylase activity. Ketoconazole (≤2.0 μM) or troleandomycin, CYP3A-selective inhibitors, markedly decreased (≥99%) the formation of both metabolites, whereas inhibitors selective of other CYP forms were relatively ineffective (≤10% inhibition). In agreement with chemical inhibitor studies, CLAR metabolism was only detectable with human B-lymphoblastoid microsomes containing cDNA-expressed CYP3A4 (vs. CYP2C19, CYP2C9, CYP2D6, CYP1A2, CYP2E1, or CYP2A6). Furthermore, the apparent KM characterizing the 14-(R)-hydroxylation and N-demethylation of CLAR in the presence of insect cell microsomes containing cDNA-expressed CYP3A4 (KM = 18–63 μM) was similar to that obtained with native human liver microsomes. Based on the results of this study, it is concluded that the 14-(R)-hydroxylation and N-demethylation of CLAR is primarily mediated by one or more members of the human liver CYP3A subfamily.
CLAR1(Abbott-56268; Biaxin®), a 14-membered macrolide, has been shown to exhibit a broadin vitro antibacterial spectrum that includes staphylococci, streptococci, Legionella, Haemophilis influenzae, Neisseria gonorrhoeae, Chlamydia, and anaerobes (1, 2). Although several studies have provided evidence that CLAR is effective in the treatment of dermal and urogenital tract infections, it has primarily been used in the treatment of respiratory tract infections and infections located in the oromaxillofacial and ophthalmic areas (e.g.pharyngitis, sinusitis, acute bronchitis, community-acquired pneumonia, and otitis media) (1, 2). Moreover, CLAR is also effective in the erradication of MAC in patients with AIDS (1). In combination with a H+,K+-ATPase inhibitor, such as omeprazole, the drug is also indicated for the treatment of Helicobacter pylori-associated gastric and duodenal ulcers (3,4).
CLAR differs structurally from ERN only in the substitution of anO-methyl group for the hydroxy group at position 6 of the lactone ring, and is superior to ERN as a result of reduced acid lability and a favorable gastrointestinal side-effect profile (1, 2). However, both drugs are considered to be clinically relevant inhibitors of CYP3A, as a result of their effects on the pharmacokinetics of drugs such as terfenadine, cyclosporin, carbamazepine, and omeprazole (5-9). Inhibition of CYP may be a direct consequence of the formation of a NADPH-dependent ferrous CYP3A-MI complex (10-12). Formation of this complex is thought to be initiated by CYP-dependentN-demethylation, in effect causing ERN and CLAR to behave as quasi-irreversible mechanism-based inhibitors (11, 12).
The pharmacokinetics and metabolism of CLAR in humans are relatively well documented (2, 13-15). For instance, a number of metabolites have been detected in the urine and feces of subjects receiving low (250 mg) and high (1200 mg) doses of CLAR. These have includedN-desmethyl-CLAR, 14-(R)-HC, 14-(S)-HC, 14-(R)-hydroxy/N-desmethyl-CLAR, 14-(S)-hydroxy/N-desmethyl-CLAR, descladinosyl-CLAR, and N,N-didesmethyl-CLAR (13). However, N-desmethyl-CLAR and 14-(R)-HC are considered to be the major metabolites, and cladinose ring hydrolysis occurs nonenzymatically (fig. 1). The metabolic profile of CLAR is unique, because no other 14-membered macrolide has been shown to undergo 14-hydroxylation in humans. In addition, the formation of 14-(R)-HC is clinically relevant, because this metabolite is detected in plasma and is pharmacologically active (1, 15).

Proposed major [14C]CLAR oxidative pathways.
Asterisk indicates the position of the carbon-14 label, whereas the shaded regions represent sites of metabolism.
Despite the fact that the metabolic profile of CLAR in humans has been well described, in addition to a number of drug–drug interactions implying CYP3A-dependent metabolism, there is a lack of data concerning which form(s) of CYP are involved in the metabolism of the drug. Toward this end, the purpose of this study was: 1) to define the NADPH-dependent in vitro metabolism of CLAR in human liver microsomes; and 2) to identify the CYP enzyme(s) that catalyze the metabolic reactions.
Materials and Methods
Chemicals.
QND, COU, TAO, ERN, 4-MP, and all cofactors were obtained from Sigma Chemical Co. (St. Louis, MO). (S)-(+)-mephenytoin (Salford Ultrafine Chemicals and Research, Manchester, UK), KTZ, FURA, and SLF (Research Biochemicals International, Natick, MA) were purchased from the sources indicated. [14C]CLAR (specific activity: 56.5 mCi/mmol; radiochemical purity >98%), 14-(R)-HC (Abbott-62671) and N-desmethyl-CLAR (Abbott-61048) were prepared as previously described (13). RIT was obtained from Dr. K. Marsh (Abbott Laboratories, North Chicago, IL). All other commercially available reagents and solvents were of either analytical or HPLC grade.
Preparation of Human Liver Microsomes.
Transplant quality human liver tissue was obtained from IIAM (Exton, PA) and was received at Abbott Laboratories within 24 hr of removal from the donor. Microsome suspensions (15–30 mg protein/ml) were prepared by differential centrifugation (16-19).
Incubation of [14C]CLAR with Native Human Liver Microsomes.
In vitro incubations of CLAR with human hepatic microsomes were performed at 37°C (under air) in a Dubnoff water bath (with agitation), using 1.5 ml polypropylene Eppendorf microcentrifuge tubes. The final assay volume was 0.5 ml and consisted of the following at the indicated final concentration: 0.1 M potassium phosphate buffer (pH 7.4), EDTA (0.1 mM), magnesium chloride (3 mM), microsomal protein (0.5–2 mg/ml), and [14C]CLAR (1–140 μM; 0.01 μCi–1.6 mCi/incubation). After a 3-min preincubation period at 37°C, the reactions were initiated by addition of a NADPH-generating system containing β-NADP+ (4.0 mM), D-glucose 6-phosphate (10 mM), and D-glucose 6-phosphate dehydrogenase (Sigma Type VII, from Baker’s yeast, 2.0 units/ml). Reactions were terminated by the addition of 0.25 ml of a mixture of chilled acetonitrile:methanol (90:10, v/v) to precipitate the proteins. After sitting on ice for at least 5 min, the samples were centrifuged (16,000g for 10 min) and an aliquot of supernatant (0.1 ml) was analyzed directly by HPLC with radioactivity flow detection. In addition, aliquots of the incubation mixtures removed before initiation of the reaction and at the end of the incubation period were radioassayed directly in Insta-Gel XF (Packard Instrument Co., Meriden, CT) scintillation fluid. The recovery of total C-14 radioactivity in the supernatant was ≥98%.
Kinetic Analyses.
Kinetic parameters (apparent KM andVmax) for the N-demethylation and 14-(R)-hydroxylation of CLAR (1–140 μM) were determined under conditions that were linear with respect to protein concentration and time of incubation. The untransformed data were fitted to a one- or two-enzyme model (PCNONLIN version 4.0; Statistical Consultants, Inc., Lexington, KY) using at least nine different concentrations of CLAR. Initial kinetic parameter estimates were obtained using EnzymeKinetics (Macintosh version 1.3; Trinity Software, Compton, NH).
Univariate Regression Analysis.
The rate of CLAR metabolism was determined in a panel of microsomes prepared from 11 different organ donors, at two different concentrations of drug (∼KM /10 and ∼2KM ). The rates of CLARN-demethylation and 14-(R)-hydroxylation were compared with those of selective CYP substrates: ERODase (CYP1A2), COHase (CYP2A6), TOLase (CYP2C9), DEXase (CYP2D6), DMNase (CYP2E1), ERNDase (CYP3A), and MEPHase (CYP2C19). All assays were conducted as previously described (16-19). The levels of microsomal CYP2D6 protein were also measured using an ELISA assay (19). Correlation coefficients (r) were determined by linear regression using CA-Cricket Graph software (Computer Associates, San Jose, CA). The statistical significance of the correlation is denoted by *p < 0.05, **p < 0.01, and ***p < 0.001.
Ferrous CYP-MI Complex Formation.
The ability of CLAR or 14-(R)-HC to elicit a ferrous CYP-MI complex was investigated with native human liver microsomes, which were diluted with 0.1 M potassium phosphate buffer (pH 7.4), containing 0.1 mM EDTA, to a final microsomal protein concentration of 0.5 mg/ml (0.9 nmol total CYP/ml). Ferrous CYP-MI complex formation was determined as described by Lindstrom et al. (20). An extinction coefficient of 64 mM−1 cm−1 was used to quantitate the ferrous CYP-MI complex, which was expressed as the percentage of total spectrally detectable (ferrous-carbon monoxide complex) CYP (20).
CYP Form-Selective Inhibitors.
A series of alternative substrates (inhibitors) were incubated in the presence of CLAR to determine which compounds could inhibit metabolism (18, 19). The following inhibitors, used at the designated concentrations, have been shown to inhibit selectively the various CYP forms: FURA (30 μM) for CYP1A2; COU (200 μM) for CYP2A6; SLF (5 μM) for CYP2C9; QND (5 μM) for CYP2D6; 4-MP (50 μM) for CYP2E1; KTZ (2 μM) or TAO (200 μM) for CYP3A; MEPH (500 μM) for CYP2C19; and RIT (2.0 μM) for CYP3A and CYP2D6. The choice of inhibitor concentration was based on Ki values obtained from the literature (17–19, 21, and references therein). In addition, all experiments were performed at a final CLAR concentration that approximated apparent Km . Under the experimental conditions chosen, the concentration of inhibitor was high (≥10-fold above Ki ) and ensured that fractional inhibition (i), where i = [I]/([I] +2 Ki ), was substantial (≥0.8) (22). Except for QND and 4-MP, which were dissolved in water, all inhibitors were dissolved in ethanol. The volume of ethanol added to the incubation mixtures was minimized (0.5% of the incubation volume or less) to avoid solvent effects on metabolism.
Incubation of [14C]CLAR with Microsomes Containing cDNA-Expressed CYP Proteins.
Microsomes prepared from human B-lymphoblastoid cells (AHH-1 TK +/−) containing cDNA-expressed CYP1A2 (117 pmol CYP/mg), CYP2A6 (83 pmol CYP/mg), wild-type CYP2D6-Val374 (44 pmol CYP/mg), wild-type CYP2C9-Arg144 (21 pmol CYP/mg), CYP3A4 (56 pmol CYP/mg), CYP2C19 (16 pmol/mg), or CYP2E1 (141 pmol CYP/mg) were obtained from Gentest Corporation (Woburn, MA). Except for CYP1A2 and CYP2C19, all microsome preparations contained additional (cDNA-expressed) NADPH-CYP reductase. These incubations were conducted at 37°C in 1.5 ml polypropylene centrifuge tubes in a final volume of 0.25 ml, as described for native human liver microsomes. Incubations with cDNA-expressed CYP2A6 and CYP2C9 were conducted in 50 mM Tris-HCl buffer (pH 7.4), containing 0.1 mM EDTA. In all cases, samples were preincubated for 5 min, and the reaction was started with the addition of 25 μl of rapidly thawed (37°C) microsomal protein (final protein concentration was 1.0 mg/ml; 16–41 pmol CYP/ml). For control incubations, microsomes prepared from human B-lymphoblastoid cells without vectors were used. Reactions were terminated with 125 μl of acetonitrile:methanol (90:10; v/v), and the samples were processed and analyzed as described for native human liver microsomes.
Kinetic studies were conducted with microsomes prepared from baculovirus-infected BTI-TN-5B1-4 cells, which contained overexpressed CYP3A4 and NADPH-CYP reductase (Supersomes, Gentest Corp.). Some experiments were conducted with microsomes that also contained coexpressed cytochrome b5 (molar ratio of cytochrome b5 to CYP3A4 was 2:1, or 525 pmol/mg vs. 256 pmol/mg). In the absence of cytochromeb5 the specific content of CYP3A4 was 400 pmol/mg. In microsomes containing cytochrome b5the rate of NADPH-dependent cytochrome c (CYP) reductase activity was 3.0 units/mg (1 unit = 1 μmol cytochromec reduced/min). NADPH-dependent cytochrome creductase activity in the presence of insect microsomes devoid of cytochrome b5 was lower (0.11 units/mg). This meant that the ratio of NADPH-CYP reductase activity to CYP3A4 was higher in microsomes containing cytochrome b5(11 vs. 0.3 units of cytochrome c reductase activity/nmol CYP3A4). All incubations were performed as previously described, except that the concentration of [14C]CLAR was varied (1–140 μM) and the final concentration of CYP3A4 was 0.1 nmol CYP/ml. To avoid secondary metabolism, reactions with insect microsomes containing cytochrome b5 were terminated after only 6 min. Activity in microsomes devoid of cytochromeb5 was lower and allowed for a longer incubation time of 20 min. In both cases, metabolite formation was linear with respect to time of incubation.
HPLC.
Analysis was performed using a Hewlett-Packard 1050 HPLC system, which included a model 1050 LC pump, model 1050 autosampler, and a model 1050 multiple wavelength detector (216 nm). Separations were accomplished at ambient temperature in a reversed-phase mode using a 5 μm YMCbasic (250 × 4.6 mm) column at ambient temperature (YMC, Inc., Wilmington, NC), which was attached to a YMCbasic guard column cartridge. Two mobile phases were used in the analyses (method 1). Mobile phase I consisted of 66% (v/v) 0.1 M ammonium acetate (pH 7.0), containing 28 mM TEA:10% (v/v) methanol:24% (v/v) acetonitrile, whereas mobile phase II consisted of 60% (v/v) 0.1 M ammonium acetate (pH 7.0), containing 28 mM TEA:10% (v/v) methanol:30% (v/v) acetonitrile.
After injection of the sample, a linear gradient was run from 100% mobile phase I to 100% mobile phase II over a period of 45 min. The flow rate was maintained at 1.0 ml/min. Radioactivity in the column effluent was monitored with a Flo/One Beta A-500 series flow detector (Radiomatic Instruments, Inc., Meriden, CT) using Ultima Flo-M (Packard Instrument Co., Meriden, CT) as the scintillator. Under these conditions, the retention time (±1 min) of authentic 14-(R)-HC, N-desmethyl-CLAR, and CLAR standard was 16, 33, and 37 min, respectively. Microsome incubates generated in the course of routine experiments were analyzed by radio-HPLC using this method. Authentic standards of 14-(R)-HC andN-desmethyl-CLAR were combined with microsomal incubates and were shown to co-elute with the two major radioactive metabolite peaks.
LC/MS Analysis and Confirmation of Metabolite Structure.
The identity of the major metabolites present in scaled-up (2 ml) CLAR incubations was confirmed by LC/MS analysis using a Perkin-Elmer Sciex API 300 tandem mass spectrometer (Sciex, Toronto, Canada). The instrument was equipped with an pneumatically assisted ion spray source using an ion energy of 35 eV and was interfaced with a Hewlett-Packard series 1050 HPLC module consisting of a quaternary LC pump equipped with a Rheodyne model 8125 manual injector. Separations were accomplished at ambient temperature in a reversed-phase mode using a SynChropak SCD 100 (250 × 0.2 mm) column (SynChrom, Inc., Lafayette, IN). To resolve all potential CLAR metabolites, three mobile phases were used in the analyses (method 2). Mobile phase I consisted of 60% (v/v) 20 mM ammonium acetate (pH 6.9):30% (v/v) acetonitrile:10% (v/v) methanol, whereas mobile phase II consisted of 30% (v/v) 20 mM ammonium acetate (pH 6.9):60% (v/v) acetonitrile:10% (v/v) methanol. Mobile phase III consisted of 100% (v/v) acetonitrile.
After injection of the sample, an isocratic system (100% mobile phase I) was used for the first 15 min. Thereafter, a linear gradient was run from 100% mobile phase I to 60% mobile phase I and 40% mobile phase II over a period of 30 min. At a run time of 45–47 minutes, the column was washed with 60% mobile phase I and 40% mobile phase II. Over an additional 2-min period (47–49 min), a second linear gradient was run from 60% mobile phase I and 40% mobile phase II to 10% mobile phase I and 90% mobile phase III. The flow rate was maintained at 0.2 ml/min. Under these conditions, authentic standards of 14-(R)-HC, N-desmethyl-CLAR, and CLAR were characterized by a retention time (±1.0 min) and molecular ion ([M + H]+) of 22.2 min (m/z = 765.4 amu; M+16), 31.6 min (m/z = 735.4 amu; M − 14), and 37.5 min (m/z = 749.4 amu), respectively. These data were used to confirm the presence of 14-(R)-HC andN-desmethyl-CLAR in human liver microsomal incubates:M3 (m/z = 765.4; retention time = 22.9 min) and M4 (m/z = 735.4; retention time = 32.5 min), respectively. Two minor metabolites were tentatively identified as 14-(S)-HC (M2: retention time = 19.2 min; m/z = 765.4 amu; M + 16) and N-desmethyl/14-hydroxy-CLAR (M1: retention time = 18.6 min; m/z = 751.4 amu; M + 2). In microsome incubates, the retention time of CLAR was 37.8 min.
Results
Oxidative Metabolites.
A typical radiochromatograph of the supernatant after incubation of [14C]CLAR with human liver microsomes in the presence of a NADPH-generating system is presented in fig. 2. After incubation, two major metabolite peaks were generated and were identified as 14-(R)-HC (peak 1; retention time of 17 min) and N-desmethyl-CLAR (peak 2; retention time of 34 min), because the retention times were similar to those of the authentic standards. In both cases, structure was confirmed by LC/MS analysis (see Materials and Methods). The earlier eluting peak (retention time of 15 min) was tentatively identified as 14-(S)-HC (13).

Typical HPLC radioactivity profile after incubation of [14C]CLAR in the presence of native human liver microsomes.
Peaks 1, 2, and 3 represent 14-(R)-HC, N-desmethyl-CLAR, and CLAR, respectively. [14C]CLAR (50 μM) was incubated for 8 min with human liver microsomes (2.0 mg protein/ml) as described inMaterials and Methods.
Reaction Kinetics.
In the presence of native human liver microsomes, the formation of 14-(R)-HC and N-desmethyl-CLAR was linear with respect to microsomal protein concentration (0.5–2.0 mg/ml; ≤0.9 nmol total CYP/ml) and time of incubation (0–8 min) (data not shown). Therefore, apparent KM andVmax were determined using a final microsomal protein concentration of 2.0 mg/ml (∼0.6 nmol total CYP/ml) and an incubation time of 6 min. Analysis of the untransformed data (PCNONLIN) yielded a single apparent KM andVmax (table 1), which indicated that the 14-(R)-hydroxylation and N-demethylation of CLAR (1–140 μM) conformed to monophasic Michaelis-Menten kinetics and that there was no evidence of substrate or endproduct inhibition.
Apparent kinetic parameters describing the N-demethylation and 14-(R)-hydroxylation of CLAR in the presence of native human liver microsomes
Monophasic kinetics was confirmed using Eadie-Hofstee plots of reaction velocity (v) against v/[S] (data not shown). In accordance, ferrous CYP-MI complex formation was only detected when CLAR or 14-(R)-HC (10–100 μM) was incubated with human liver microsomes and NADPH after a prolonged incubation period (>8 min). After a 30-min incubation with CLAR or 14-(R)-HC, the extent of CYP complexation (≤22% of total CYP) was comparable with that observed with ERN (19% of total CYP). By comparison, CYP complexation in the presence of TAO was more pronounced (∼40% of total CYP) (data not shown).
Intersubject Variability.
The microsomal metabolism of CLAR (0.1) mM was studied with a panel of 11 human livers, and the intersubject variability was 26-fold (range = 35.8–935 pmol/min/mg; mean = 272 ± 269 pmol/min/mg, mean ± SD) and 46-fold (range =13.3–614 pmol/min/mg; mean = 182 ± 185 pmol/min/mg, mean ± SD) in the case of 14-(R)-hydroxylation andN-demethylation, respectively. A similar result was obtained using a low (5.0 μM) concentration of CLAR (data not shown). However, despite the marked variability, the rate of CLAR 14-(R)-hydroxylation was highly correlated (r = 0.99; p < 0.001;N = 11) with the rate of CLARN-demethylation (table 2).
Correlation of various CYP form-selective monooxygenase activities with CLAR N-demethylase and 14-(R)-hydroxylase activity in a panel of human liver microsomes
Regression analysis indicated that 14-(R)-hydroxy formation at low (5.0 μM) and high (0.1 mM) CLAR concentrations was highly correlated (r = 0.99; p < 0.001;N = 11). Because the rate of N-demethylation at both concentrations of CLAR was also highly correlated (r = 0.96;p < 0.001; N= 11), these results suggested that both reactions were mediated by the same CYP form(s) over a relatively wide CLAR concentration range (KM/10 to 2KM) (table 2). The low concentration of CLAR used in the study fell within the therapeutic plasma concentration range of total (bound and free) drug (Cmax = 0.6–4.5 μg/ml; 0.8–6.0 μM) (2,14).
Correlation Studies with CYP Form-Selective Monooxygenase Activities.
The rates of CLAR (0.1 mM; 2KM) metabolism were correlated with the metabolic activities for seven CYP form-selective substrates in the same panel of microsomes (table 2). Although not shown, similar results were obtained at a lower CLAR concentration (5.0 μM; KM/10).
The N-demethylation and 14-(R)-hydroxylation of CLAR was significantly correlated with ERNDase (CYP3A) activity (r = 0.90–0.92; p < 0.001;N = 11), CYP2C19-selective MEPHase activity (r = 0.88–0.91; p < 0.001;N = 11), COHase (CYP2A6) activity (r = 0.63–0.67; p < 0.05; N = 11), and the level of total CYP (r = 0.82–0.86; p≤ 0.01; N = 11). In contrast, no statistically significant correlation (r ≤ 0.51) was observed between CLAR metabolism and TOLase (CYP2C9), DMNase (CYP2E1), or ERODase (CYP1A2) activities. This finding suggested that CYP2C9, CYP2E1, and CYP1A2 played only a minor role in the metabolism of CLAR. Similarly, a relatively weak correlation with DEXase activity (r ≤ 0.39) indicated that this CYP form was not involved in the metabolism of CLAR, which was further confirmed using an ELISA assay employing anti-CYP2D6 monoclonal antibodies (table 2). Collectively, regression analysis indicated that multiple forms of CYP (i.e. CYP3A, CYP2C19, and CYP2A6) could potentially be involved in the N-demethylation and 14-(R)-hydroxylation of CLAR.
Inhibitor Studies.
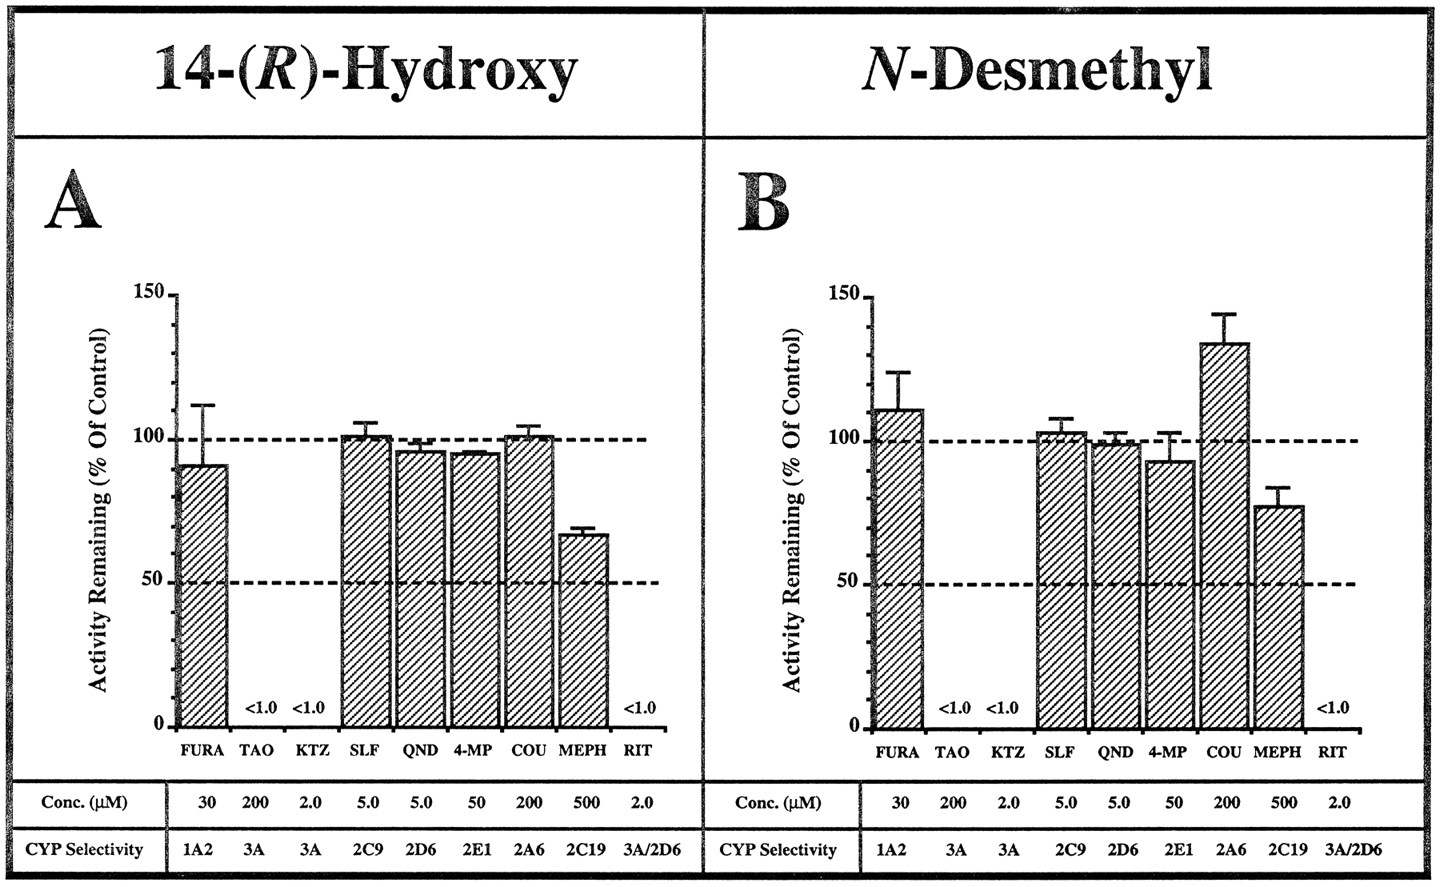
Of the CYP inhibitors studied, KTZ (≤2.0 μM) and TAO markedly inhibited (≥99%) both the N-demethylation and 14-(R)-hydroxylation of CLAR (50 μM; ∼KM ) (fig. 3). Because both of these agents are considered to be selective for CYP3A, these data indicated that CLAR metabolism was largely mediated by members of the human liver microsomal CYP3A subfamily (e.g. CYP3A4, CYP3A5, and possibly CYP3A7) (18, 21, 23). In agreement, only minimal inhibition (≤9%) of CLAR metabolism was observed in the presence of FURA (CYP1A2-selective), SLF (CYP2C9-selective), QND (CYP2D6-selective), 4-MP (CYP2E1-selective), or COU (CYP2A6-selective). However, some inhibition (∼28%) was observed with MEPH (0.5 mM) (fig. 3). Because RIT (ABT-538) is a potent (Ki = 0.02 μM) mixed (competitive/noncompetitive) inhibitor of CYP3A activity in vitro, and has been shown to inhibit CLAR metabolism in vivo (21, 24), we sought to investigate its effect on CLAR metabolism in vitro. At the concentration used in this study, RIT (2.0 μM) essentially abolished the formation of N-desmethyl-CLAR and 14-(R)-HC. In this regard, RIT was as potent as KTZ (fig. 3).

The effect of various putative CYP form-selective inhibitors on CLAR metabolism in the presence of native human liver microsomes.
The rate of (A) 14-(R)-hydroxylation and (B) N-demethylation of CLAR was measured in the absence or presence of various CYP form-selective inhibitors. Data are expressed as percentage activity remaining relative to a control (ethanol or water alone, ≤1.0% v/v) incubation and represent mean ± SD of three different human livers. Incubations were conducted as described in Materials and Methods. Conc., concentration.
Metabolism of CLAR by cDNA-Expressed CYP Proteins.
B-lymphoblast microsome preparations containing cDNA-expressed CYP3A4 exhibited measurable CLAR N-demethylase (340 pmol/min/nmol CYP) and 14-(R)-hydroxylase (410 pmol/min/nmol CYP) activity. No activity was detected in (control) microsomes prepared from B-lymphoblastoid cells containing the selectable plasmid vector without cDNA insert, which were essentially devoid of CYP. Similarly, no activity was detected with microsomes containing cDNA-expressed CYP1A2, CYP2A6, CYP2E1, CYP2D6, CYP2C9, or CYP2C19 (data not shown).
To characterized further the metabolism of CLAR, experiments were conducted with insect cell (BTI-TN-5B1-4) microsomes containing cDNA-expressed CYP3A4 and NADPH-CYP reductase, in the absence or presence of cytochrome b5. An attempt was made to study the effect cytochrome b5 on CLAR metabolism, because it has been shown to stimulate insect cell-expressed CYP3A4-dependent monooxygenase activity (25, 26). In this instance, however, the ratio of NADPH-CYP (cytochromec) reductase activity to CYP3A4 is elevated in microsomes containing cytochrome b5 (11 vs. 0.3 units of reductase activity/nmol CYP3A4), so the effect of cytochromeb5 on CLAR metabolism in BTI-TN-5B1-4 cell microsomes may be difficult to interpret. Nevertheless, CLAR metabolism conformed to single-enzyme Michaelis-Menten kinetics and the apparentKM characterizing the N-demethylation (∼30 μM) and 14-(R)-hydroxylation (∼20 μM) of CLAR in BTI-TN-5B1-4 microsomes was comparable with that obtained with native human liver microsomes (table 3). For both 14-(R)-hydroxylase (3.6 vs. 0.3 nmol/min/nmol CYP3A4) and N-demethylase (4.7 vs. 0.7 nmol/min/nmol CYP3A4) activity, apparent Vmaxwas higher in the presence of insect cell microsomes containing cytochrome b5 (table 3).
Apparent kinetic parameters characterizing the N-demethylation and 14-(R)-hydroxylation of CLAR by insect cell (BTI-TN-5B1-4) microsomes containing cDNA-expressed CYP3A4 and NADPH-CYP reductase
Discussion
The results of these studies demonstrate that CLAR undergoes CYP-dependent N-demethylation, and 14-(R)-hydroxylation in the presence of human liver microsomes and regression analysis indicates that both reactions are mediated by the same CYP form(s). In both cases, the apparentKM (20–60 μM) obtained with native human liver microsomes and cDNA-expressed CYP3A4 is comparable with that of many CYP3A substrates (27-30). However, although CLAR metabolism conformed to classical Michaelis-Menten kinetics after a relatively short incubation period (≤8 min), a CYP-MI complex was detected with native human liver microsomes after prolonged incubation. This may partly explain the nonlinear pharmacokinetics observed in subjects receiving CLAR over the dosage range of 100–1,200 mg (13, 14).
Several lines of evidence have demonstrated that member(s) of the CYP3A subfamily, most likely CYP3A4, are the principal human liver microsomal enzymes involved in the metabolism of CLAR: 1) metabolism in a panel of human liver microsomes was strongly correlated (r = 0.90–0.92; p < 0.001;N = 11) with CYP3A-selective ERNDase activity;2) both N-demethylation and 14-(R)-hydroxylation of CLAR was essentially abolished (≥99% inhibition) by the CYP3A-selective inhibitors KTZ (≤2.0 μM) or TAO; 3) of the CYP forms tested, only cDNA-expressed CYP3A4 was able to catalyze the N-demethylation and 14-(R)-hydroxylation of CLAR; 4) because CYP3A is the most abundant form of the enzyme in native human liver microsomes (26), the metabolism of CLAR was highly correlated (r = 0.82–0.86; p < 0.001; N = 11) with the levels of total CYP; and 5) the apparentKM characterizing the metabolism of CLAR in native human liver microsomes (KM ∼ 50 μM) was similar to that obtained with cDNA-expressed CYP3A4 (KM = 20–60 μM). In toto, data indicate that the 14-(R)-hydroxylation andN-demethylation of CLAR is mediated by CYP3A4, and that CYP2C19, CYP2D6, CYP2E1, CYP1A2, CYP2C9, and CYP2A6 play a relatively minor role. In this regard, the CYP profile is similar to that of ERN and TAO (9-12, 18, 21, 23). Because TAO has been shown to interact with CYP3A4 and CYP3A5, it is possible that the metabolism of CLAR may also be catalyzed by multiple members of the human liver microsomal CYP3A subfamily (23). However, the native human liver microsomes used in this study were not characterized with respect to the levels of CYP3A5 (vs. CYP3A4). Evidence indicates that CYP3A5 is only expressed in 25% of individuals. When it is expressed, the level of CYP3A5 is usually lower (∼30%) than that of CYP3A4 (29).
Although a significant correlation was obtained with CYP2A6-selective COHase activity (table 2), cDNA-expressed CYP2A6 was unable to metabolize CLAR. Furthermore, COU failed to inhibit CLAR metabolism in native human liver microsomes. This discrepancy may be related to the fact that COHase activity significantly correlated (r = 0.88; p < 0.001; N = 11) with the level of total CYP in the bank of microsomes (data not shown). Likewise, the correlation between CLAR metabolism and CYP2C19-selective MEPHase activity (table 2) is also considered fortuitous, because MEPHase and ERNDase activity were highly correlated (r= 0.81; p < 0.01; N = 11). In accordance, no metabolism was detected in the presence of cDNA-expressed CYP2C19, whereas TAO and KTZ have not been shown to inhibit CYP2C19 activity in native human liver microsomes (unpublished observations). The effect of MEPH (0.5 mM) on CLARN-demethylation (23% inhibition) and 14-(R)-hydroxylation (33% inhibition) may have arisen from the inhibition of CYP3A (fig. 3). This is because theN-demethylation of MEPH (KM ∼ 0.8 mM) in human liver microsomes has been shown to be mediated by CYP3A (31).
Assuming competitive inhibition (KM ∼Ki ), the inhibition of CYP3A by MEPH would be expected to be characterized by a Ki of ∼800 μM. If [S]/KM = 1 and [I] = 500 μM (22), the predicted fractional inhibition (i) of CLAR metabolism is 23%, which is similar to that observed (fig. 3).
The findings of this study are of clinical relevance, given thatN-demethylation and 14-(R)-hydroxylation accounts for the majority of the metabolism of CLAR and that CYP3A is induced by various agents (e.g. phenytoin, rifampicin, phenobarbital, rifabutin, and/or carbamazapine) (32). In agreement, the administration of rifampicin has been shown to decrease the mean serum level of CLAR (5.4 μg/ml to 0.7 μg/ml) in subjects with lung disease due to MAC (33). In addition, because of the presence of CYP3A4 in the gut, it is probable that the first-pass metabolism of CLAR is mediated by both the intestine and liver. In accordance, the gut is thought to play a role in the observed interaction between cyclosporin and CLAR (6). In this instance, CLAR enhances the oral bioavailability of cyclosporin by inhibiting CYP3A in the gut and liver. BecauseN-demethylation of most 14-membered macrolides is associated with the inhibition of CYP, via formation of a ferrous CYP-MI complex, it is likely that N-demethylation of CLAR is also occurring in the gut (6, 11, 12, 20). This observation may also explain why CLAR increases the mean area under the plasma concentrationvs. time curve (AUCoral) of a number of coadministered CYP3A substrates (e.g. omeprazole, terfenadine, FK-506, and carbamazepine) (5-9).
In terms of inhibition, potent inhibitors (Ki ≤ 1.0 μM) of CYP3A are likely to have a pronounced effect on the metabolism of CLAR. This is clinically relevant because 14-(R)-HC is a pharmacologically active metabolite (1, 2,15). In agreement, RIT has been shown to decrease markedly the plasma AUC of 14-(R)-HC (15.7 μg · hr/ml vs. 0.04 μg · hr/ml) in subjects receiving CLAR (24). This implies that the fractional inhibition (i) of 14-(R)-HC formationin vivo is high (0.99).2Fractional inhibition in the presence of RIT can also be estimated using the relationship [I]/([I] +Ki ). In this instance, in vitro Ki = 0.02 μM and [I] equates with the concentration of total (protein bound and free) RIT attained in plasma (Cmax = 5.8 μg/ml; 8.0 μM) (21, 24). Using these values, fractional inhibition is also estimated to be 0.99 (99%), which suggests a good in vitro-in vivocorrelation.
In conclusion, the results of this study indicate that one or more members of the human liver microsomal CYP3A subfamily are responsible for catalyzing the N-demethylation and 14-(R)-hydroxylation of CLAR. Because CYP3A4 is the most abundant form of CYP in the liver and intestine of adults, this enzyme probably accounts for the majority of the drug–CLAR interactions observed in the clinic (27, 29, 32). At least qualitatively, the drug interaction profile of CLAR would be expected to be similar to that of other 14-membered macrolides, such as ERN, flurithromycin, and TAO (12). Given that CLAR is often used in combination with CYP3A4 inducers, or cosubstrates, and that 14-(R)-HC is pharmacologically active, these findings are clinically relevant.
Acknowledgments
We thank Drs. J. Ferrero, L. Gustavson, and M. Karol (Abbott Laboratories) for very useful discussions. The technical assistance provided by Ms. S. Shoghi (purification of [14C]CLAR) is also acknowledged.
Footnotes
-
Send reprint requests to: Dr. A. David Rodrigues, Drug Metabolism I, Merck Research Laboratories, Sumneytown Pike, P.O. Box 4, WP26A 2044, West Point, PA 19486-0004.
-
↵2 Fractional inhibition (i) of 14-(R)-HC formation in vivo estimated using the equation: i = {AUCc − AUCi}/AUCc. AUCc and AUCi represent AUC of 14-(R)-HC in the absence and presence of RIT, respectively.
- Abbreviations used are::
- CLAR
- clarithromycin
- MAC
- Mycobacterium avium complex
- AIDS
- acquired immune deficiency syndrome
- ERN
- erythromycin
- CYP
- cytochrome P450
- MI
- metabolic intermediate
- N-desmethyl-CLAR
- N-desmethyl-clarithromycin
- 14-(R)-HC
- 14-(R)-hydroxy-clarithromycin
- 14-(S)-HC
- 14-(S)-hydroxy-clarithromycin
- QND
- quinidine
- COU
- coumarin
- TAO
- troleandomycin
- 4-MP
- 4-methylpyrazole
- KTZ
- ketoconazole
- FURA
- furafylline, SLF, sulfaphenazole
- RIT
- ritonavir
- IIAM
- Institute for the Advancement of Medicine
- KM
- apparent Michaelis constant
- Vmax
- apparent maximal initial reaction velocity
- ERODase
- 7-ethoxyresorufin O-deethylase
- COHase
- coumarin hydroxylase
- TOLase
- tolbutamide methyl hydroxylase
- DEXase
- [O-methyl-14C]dextromethorphanO-demethylase
- DMNase
- N,N-dimethylnitrosamine N-demethylase
- ERNDase
- erythromycin N-demethylase
- MEPHase
- (S)-(+)-mephenytoin 4′-hydroxylase
- MEPH
- (S)-(+)-mephenytoin
- Ki
- inhibition constant
- i
- fractional inhibition
- [I]
- inhibitor concentration
- TEA
- triethylamine
- [S]
- substrate concentration
- Cmax
- maximal concentration of drug in plasma
- AUC
- area under the plasma concentration-time curve. AUCc, area under the plasma concentration vs. time curve in the absence of inhibitor
- AUCi
- area under the plasma concentration vs. time curve in the presence of inhibitor
- Received November 5, 1996.
- Accepted February 10, 1997.
- The American Society for Pharmacology and Experimental Therapeutics
References
DMD articles become freely available 12 months after publication, and remain freely available for 5 years.Non-open access articles that fall outside this five year window are available only to institutional subscribers and current ASPET members, or through the article purchase feature at the bottom of the page.
|


