


Article Figures & Data
Figures
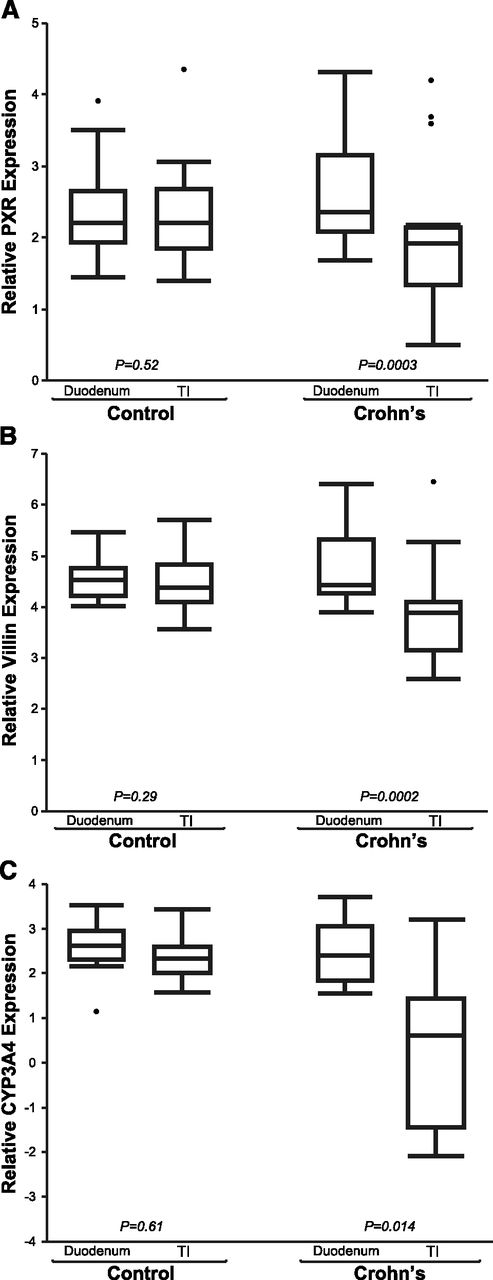
- Fig. 1.
Relative gene expression of PXR (A), VIL1 (B), and CYP3A4 (C) in the TI and the duodenum of children with Crohn’s disease (CD; n = 18) versus age- and sex-matched controls without IBD (n = 12). Mean differences in relative gene expression (triplicate determinations of molecule number per sample, normalized to GAPDH, and log2-transformed) were compared between the TI and the duodenum in the same children, using a two-tailed paired Student’s t test (α = 0.05).
- Fig. 2.
Correlation relationships (Spearman’s correlation; α = 0.05) in relative gene expression (triplicate determinations of molecule number per sample, normalized to GAPDH, and log2-transformed) between (A) PXR and VIL1 across all tissue samples (n = 30; r = 0.78, P = 0.01); (B) PXR and IL8 in the TI of CD (r = –0.45, P = 0.06) and controls (r = 0.18, P = 0.6), (C) VIL1 and IL8 in the TI of CD (r = –0.44, P = 0.07) and controls (r = 0.27, P = 0.4), and (D) CYP3A4 and IL8 in the TI of CD (r = –0.68, P < 0.01) and controls (r = 0.21, P = 0.5). Crohn’s disease (CD) tissue denoted by cross (n = 18), control tissue by circle (n = 12).


Additional Files
Data Supplement
- Supplemental Data -
Supplementary Table 1 - Spearman’s correlation (α < 0.05) for genes of interest expressed in small intestinal tissue, duodenum and terminal ileum (TI), from 30 children; 18 children with Crohn’s disease (CD) with active inflammation in the TI , and 12 age- and sex-matched Controls without intestinal inflammation.
Supplementary Table 2 - Spearman’s correlation (α < 0.05) for IL8 (marker of inflammation) and genes of interest expressed in the terminal ileum (TI) from 30 children; 18 children with Crohn’s disease (CD) with active inflammation in the TI, and 12 age- and sex-matched Controls without intestinal inflammation.
Supplementary Figure 1 - Correlation relationship in mRNA gene expression between PXR and CYP3A4, across all tissue samples in children with (cross) and without Crohn’s disease (open circle).
Supplementary Figure 2 - Correlation relationship in mRNA gene expression between VIL1 and CYP3A4, across all tissue samples in children with and without Crohn’s disease. Crohn’s disease tissue (cross), control tissue (circle).
- Supplemental Data -


