


Article Figures & Data
Figures
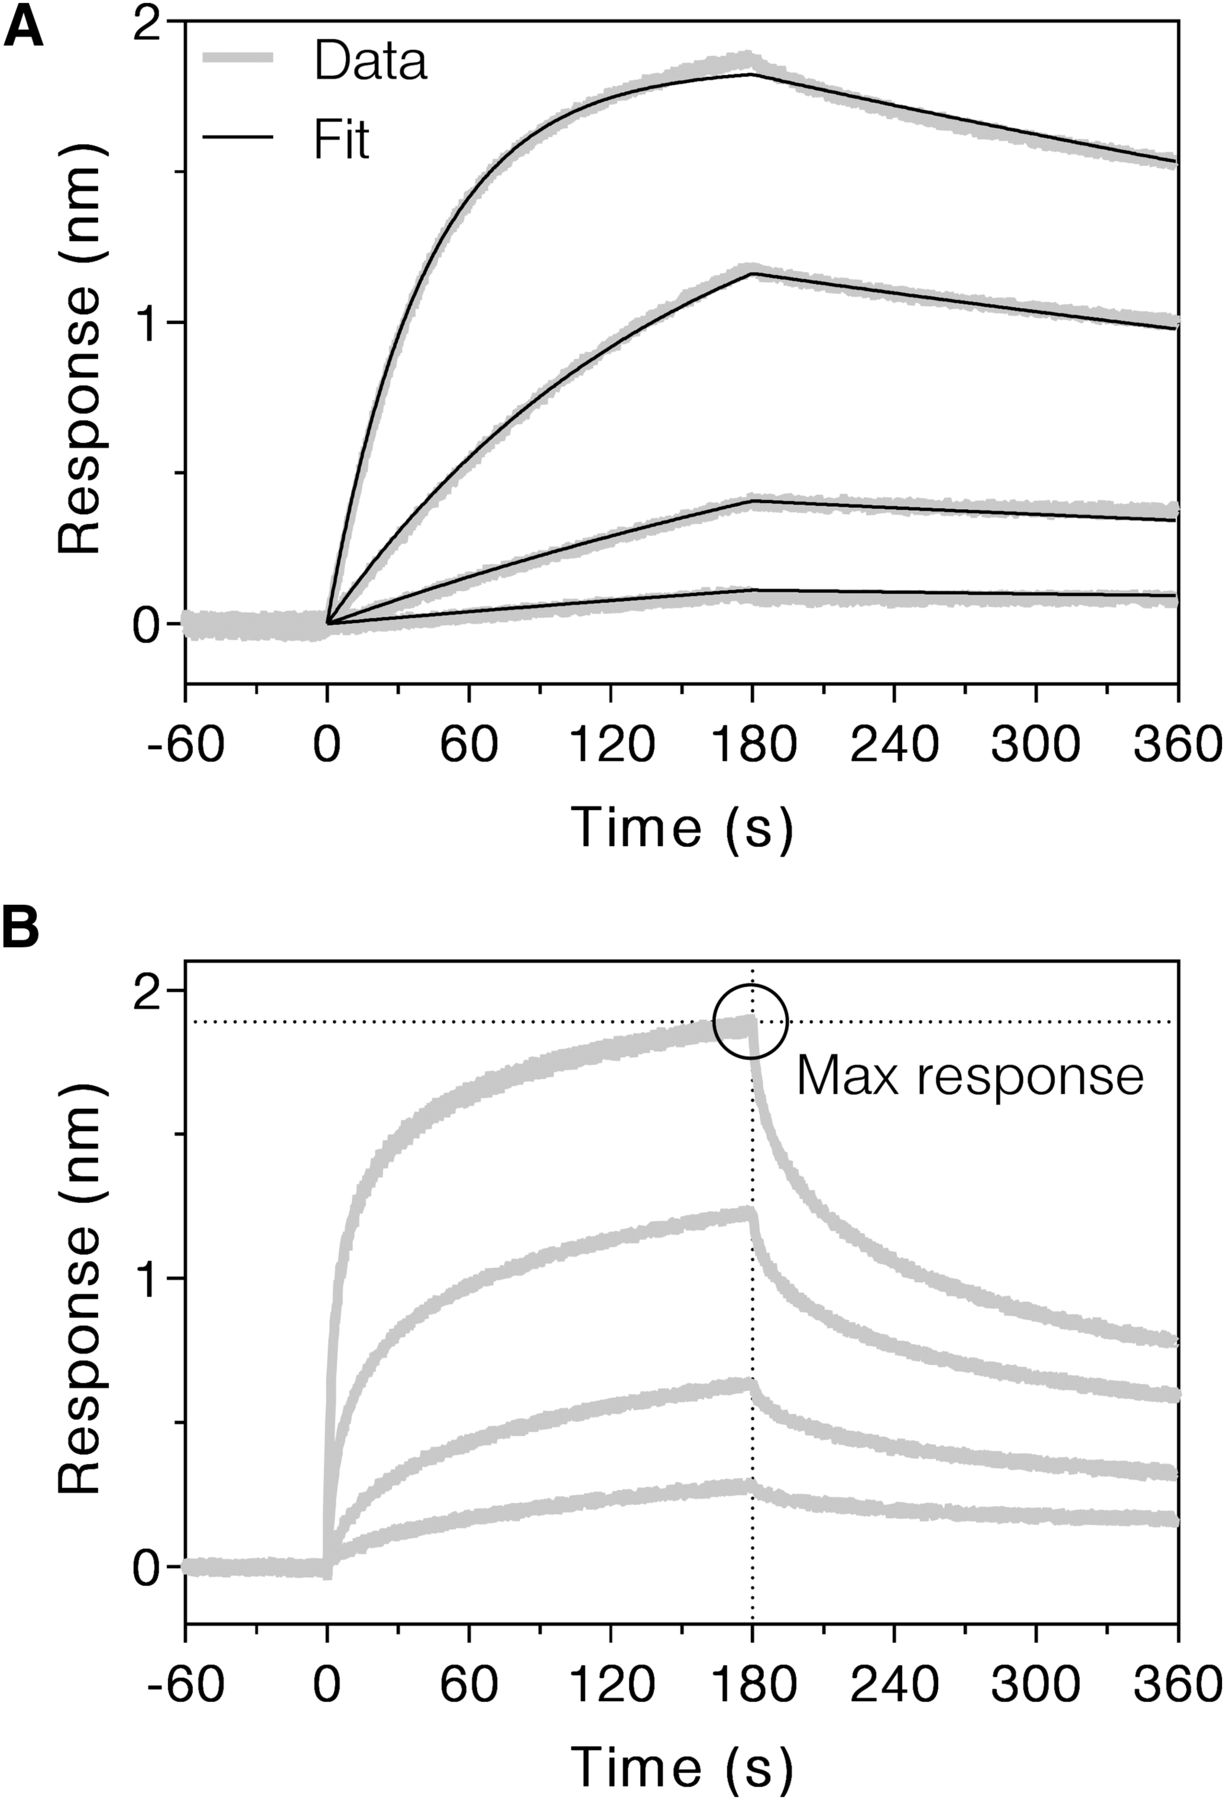
- Fig. 1.
BLI sensorgrams of bevacizumab binding to immobilized human FcRn at pH 6.0 (A) and 7.0 (B). At pH 6.0, Ni-NTA tips loaded with FcRn were dipped in buffer containing 66.7, 16.7, 4.17, or 1.04 nM bevacizumab to observe the association phase for 3 minutes, followed by dipping in buffer lacking bevacizumab to observe the dissociation phase for 3 minutes. Thick gray lines show the data, and narrow black lines show a global fit of all four concentrations to a 1:1 binding model, which yielded kinetic parameters ka and kd. At pH 7.0, Ni-NTA tips loaded with FcRn were dipped in buffer containing 6670, 1670, 417, or 104 nM bevacizumab to observe the association phase for 3 minutes, followed by dipping in buffer lacking bevacizumab to observe the dissociation phase for 3 minutes. Thick gray lines show the data, and the black circle highlights the maximum binding response achieved for the 6.67 μM concentration. FcRn binding data at pH 6.0 and 7.0 are shown for other mAbs in Supplemental Figs. 1–5. Max, maximum.
- Fig. 2.
DSC thermograms showing the unfolding of bevacizumab at pH 7.2. (A) After performing “Progress Baseline” subtraction, the data were fit to a three-component, non–two-state model to extract the ΔH and Tm associated with three unfolding events. Data are shown as a thick gray line, the fit is shown as a narrow black line, and the fitted components are shown as black dotted lines. (B) Baselines of the folded and unfolded states were fit using the “Step at Half Area” baseline option. The difference in CP at half area was calculated as the ΔCP. Replicates, peak fits, and baseline fits are shown for all mAbs in Supplemental Figs. 6–8.
- Fig. 3.
Correlations between mAb half-life or clearance and individual biophysical parameters. The FcRn ka values at pH 6.0 (A), FcRn kd values at pH 6.0 (B), and FcRn maximum binding response after 3 minutes at pH 7.0 (C) were obtained from BLI experiments. The values for total ΔH (D), weight-averaged Tm (E), and ΔCP of unfolding (F) were obtained from DSC experiments. Half-life values are plotted on the left axis as open circles, with linear fits plotted as gray dotted lines containing the gray R2 values listed at the top right. Clearance values are plotted on the right axis as closed circles, with linear fits plotted as black solid lines containing the black R2 values listed at the bottom right.
- Fig. 4.
LASSO analysis to determine the most important predictors of mAb half-life (A) and clearance (B). As the value of the regularization parameter λ increased, the number of nonzero coefficients (gray line, left axis) decreased while the mean squared error (black line, right axis) increased. The most important parameters for multiple regression of half-life (introduced at the highest values of λ) were pH 7.0 response (R7.0), ΔCP of unfolding, weight-averaged Tm, total ΔH of unfolding, pH 6.0 ka (ka,6.0), and pH 6.0 kd (kd,6.0), in that order. For clearance, the order of importance was ΔCP, R7.0, kd,6.0, ka,6.0, ΔH, and Tm.
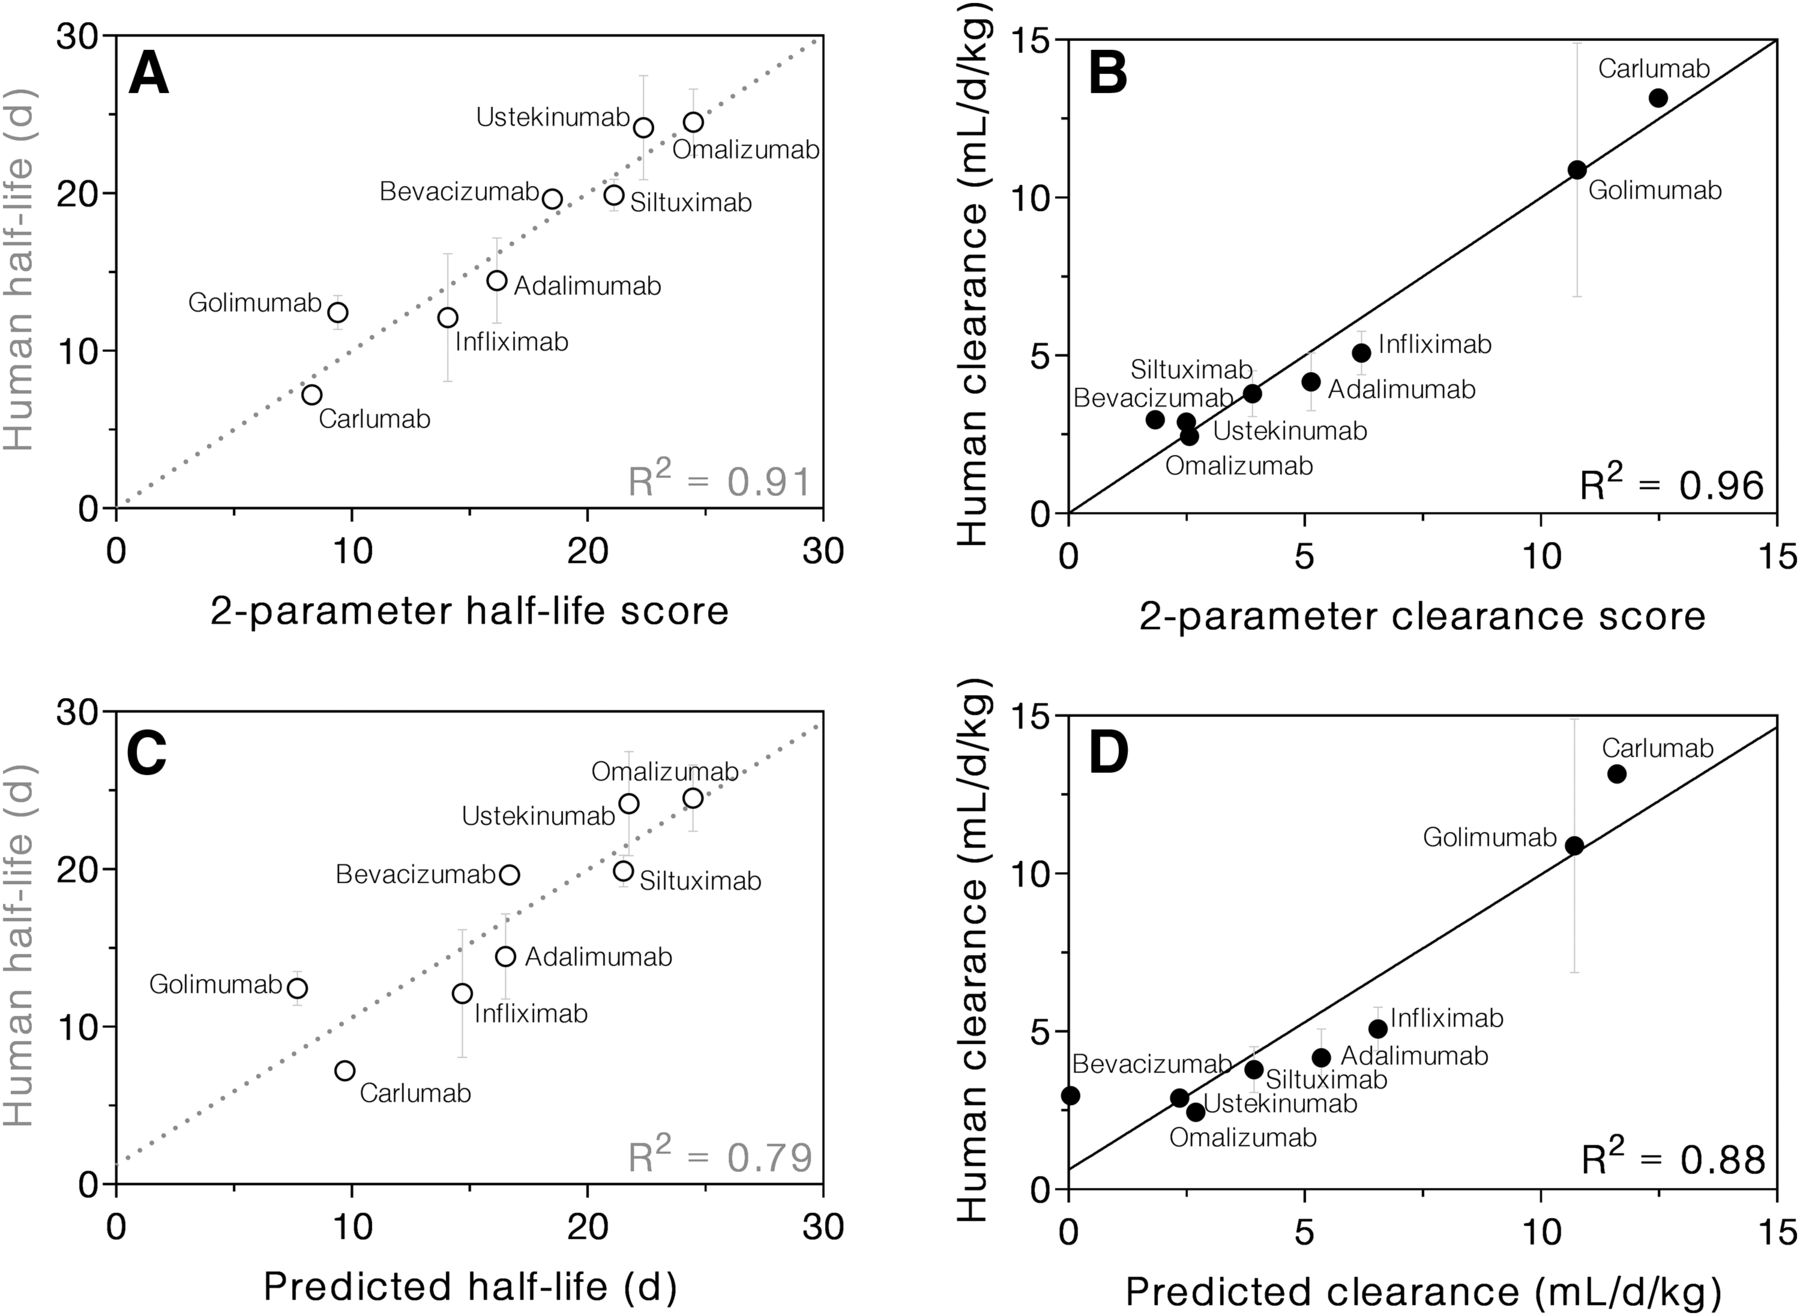
- Fig. 5.
mAb half-life (A) and clearance (B) correlated strongly with the respective two-parameter scores, which are based on the FcRn response at pH 7.0 and ΔCP. Half-life (C) and clearance (D) predictions were validated using leave-one-out analysis. Multiple regression was performed using response at pH 7.0 and ΔCP as predictors. Each mAb in turn was omitted from the regression, and then its values of pH 7 response and ΔCP were used to predict its half-life or clearance using the regression results of the remaining seven mAbs.


Tables
Antibody Human Half-Life Human Clearance FcRn ka, pH 6.0 FcRn kd, pH 6.0 FcRn Response, pH 7.0 ΔH Weight Average Tm ΔCP d ml/day per kilogram mM−1s−1 ks−1 nm kcal/mol °C kcal/mol per degree celsius Adalimumaba−c 14.5 ± 2.7 4.2 ± 0.9 641 ± 1 1.59 ± 0.01 1.77 948 ± 1 73.9 ± 0.1 11.9 ± 1.1 Bevacizumabd−g 19.7 ± 0.4 3.0 ± 0.3 349 ± 0 0.96 ± 0.00 1.89 709 ± 69 72.6 ± 0.2 6.7 ± 2.3 Carlumabh,i 7.2 ± 0.4 13.2 437 ± 1 3.09 ± 0.01 1.97 884 ± 133 71.8 ± 0.2 21.1 ± 3.7 Golimumabj−o 12.4 ± 1.1 10.9 ± 4.0 459 ± 1 1.56 ± 0.00 2.05 854 ± 98 75.0 ± 0.1 18.3 ± 2.5 Infliximabp−t 12.1 ± 4.0 5.1 ± 0.7 423 ± 0 0.91 ± 0.00 1.96 843 ± 26 71.2 ± 0.1 12.4 ± 1.7 Omalizumabu,v 24.5 ± 2.1 2.4 ± 0.1 371 ± 0 1.64 ± 0.00 0.72 932 ± 55 78.5 ± 0.2 13.6 ± 2.2 Siltuximabw,x 19.9 ± 1.0 3.8 ± 0.7 505 ± 1 2.27 ± 0.01 1.10 706 ± 11 71.5 ± 0.1 13.5 ± 0.6 Ustekinumaby,z 24.2 ± 3.3 2.9 535 ± 1 2.38 ± 0.01 1.10 738 ± 45 73.1 ± 0.4 11.6 ± 3.9 ↵a https://www.accessdata.fda.gov/drugsatfda_docs/label/2017/125057s399lbl.pdf.
b Weisman et al. (2003).
↵c den Broeder et al. (2002).
↵d https://www.accessdata.fda.gov/drugsatfda_docs/label/2016/125085s317lbl.pdf.
e Han et al. (2016).
f Li et al. (2013).
↵g Lu et al. (2008).
↵i Sandhu et al. (2013).
↵j https://www.accessdata.fda.gov/drugsatfda_docs/label/2015/125433s014lbl.pdf.
k Zhuang et al. (2012).
l Zhuang et al. (2013).
m Ling et al. (2010).
n Xu et al. (2010).
↵o Zhou et al. (2007).
↵p https://www.accessdata.fda.gov/drugsatfda_docs/label/2013/103772s5359lbl.pdf.
q Dotan et al. (2014).
r Fasanmade et al. (2011).
s Cornillie et al. (2001).
↵t Ternant et al., 2008.
↵u https://www.accessdata.fda.gov/drugsatfda_docs/label/2016/103976s5225lbl.pdf.
↵v Hayashi et al. (2007).
↵w https://www.accessdata.fda.gov/drugsatfda_docs/label/2014/125496s000lbl.pdf.
↵x Kurzrock et al. (2013).
↵y https://www.accessdata.fda.gov/drugsatfda_docs/label/2016/761044lbl.pdf.
↵z Zhu et al. (2013).
Antibody Omitted and Predicted Half-Life Prediction Clearance Prediction Intercept FcRn Response, pH 7.0 Coefficient ΔCP Coefficient Intercept FcRn Response, pH 7.0 Coefficient ΔCP Coefficient Adalimumab 17.1 ± 0.8 −4.48 ± 0.87 −3.03 ± 0.87 5.82 ± 0.33 1.94 ± 0.34 3.07 ± 0.34 Bevacizumab 16.4 ± 0.9 −5.04 ± 0.99 −2.13 ± 1.25 5.31 ± 0.19 1.45 ± 0.20 3.90 ± 0.26 Carlumab 17.1 ± 0.9 −4.47 ± 0.90 −2.31 ± 1.17 5.48 ± 0.35 1.76 ± 0.35 2.80 ± 0.46 Golimumab 16.2 ± 0.6 −5.13 ± 0.60 −3.50 ± 0.62 5.65 ± 0.39 1.84 ± 0.41 3.13 ± 0.43 Infliximab 17.1 ± 0.8 −4.31 ± 0.87 −3.05 ± 0.83 5.86 ± 0.30 2.04 ± 0.32 3.06 ± 0.31 Omalizumab 16.8 ± 1.0 −4.62 ± 1.26 −2.89 ± 0.94 5.71 ± 0.40 1.80 ± 0.53 3.17 ± 0.40 Siltuximab 17.0 ± 0.9 −4.85 ± 0.96 −2.84 ± 0.89 5.69 ± 0.39 1.84 ± 0.42 3.16 ± 0.39 Ustekinumab 16.5 ± 0.8 −4.34 ± 0.89 −2.78 ± 0.84 5.61 ± 0.38 1.93 ± 0.41 3.18 ± 0.38 Average 16.8 ± 0.4 −4.66 ± 0.32 −2.82 ± 0.43 5.64 ± 0.18 1.83 ± 0.18 3.18 ± 0.31 (None omitted) 16.8 ± 0.8 −4.63 ± 0.83 −2.88 ± 0.83 5.67 ± 0.32 1.86 ± 0.35 3.15 ± 0.35
Data Supplement
- Supplemental Figures -
Supplemental Figure 1 showing FcRn-IgG binding at pH 6.0 via biolayer interferometry (BLI)
Supplemental Figure 2 showing FcRn-IgG binding at pH 7.0 via BLI
Supplemental Figure 3 showing independent FcRn-IgG binding experiments at pH 6.0 via BLI
Supplemental Figure 4 showing independent FcRn-IgG binding experiments at pH 7.0 via BLI
Supplemental Figure 5 showing comparison of FcRn-IgG binding experiments
Supplemental Figure 6 showing unfolding thermograms via differential scanning calorimetry (DSC)
Supplemental Figure 7 showing 3-component, non-2-state fits of IgG DSC data
Supplemental Figure 8 showing calculation of IgG ΔCP of unfolding via DSC
Supplemental Figure 9 showing LASSO analysis with pH 6.0 response
Supplemental Figure 10 showing the effects of allotype and framework on IgG pharmacokinetics
Supplemental Figure 11 showing a comparison of IgG ΔCP of unfolding and GRAVY score
- Supplemental Figures -


