


Article Figures & Data
Figures
- Fig. 1.
Changes in total protein content (A), total P450 content (B), and relative content of P450 (C) (nanomoles per milligram of microsomal protein) after systemic administration of oleamide. The total protein content in individual RLMs was assessed according to the method of Lowry et al., and the total P450 content was determined using a CO difference spectroscopy method according to Omura et al. Animals were treated intraperitoneally with oleamide 0.1 (n = 10), 1 (n = 10), 10 mg/kg per day (n = 10), and propylene glycol (control group, n = 6). Bars and whiskers express the mean (S.D.). Statistical significance was assessed by Kruskal-Wallis test followed by multiple comparisons of mean ranks (A and C) and one-way ANOVA test followed by Tukey’s significant difference test for unequal sample sizes (B). Statistical significance with respect to the control group (propylene glycol) is indicated with *P ≤ 0.05.
- Fig. 2.
(A) Relative metabolic activities of CYP2A, CYP2B, CYP3A, and CYP2C11 after systemic administration of oleamide, measured as the rate of testosterone hydroxylation and shown as the percentage of the rate of reaction in the control group. The absolute control values (picomoles per minute per milligram of total protein content) were as follows: 217.4 ± 23.7, 37.5 ± 6.1, 76.2 ± 14.8, 614.8 ± 92.0, 3303.0 ± 779.0, and 2934.5 ± 791.6 (testosterone 7α-, 16β-, 2β-, 6β-, 2α-, and 16α- hydroxylations, respectively). Animals were treated intraperitoneally with oleamide 0.1 (n = 10), 1 (n = 10), 10 mg/kg per day (n = 10), and propylene glycol (control group, n = 6). Reactions were performed in the presence of testosterone (400 µM) in RLMs (1 mg/ml of the total protein content) with an NADPH-generating system in a final volume of 1 ml at 37°C for 20 minutes. (B) Specific metabolic activities of CYP2A, CYP2B, CYP3A, and CYP2C11 after systemic administration of oleamide measured as the rate of testosterone hydroxylation per nanomoles of total P450 content per minute and shown as the percentage of the rate of reaction in the control group. The absolute control values (picomoles per minute per nanomoles of total P450 content) were as follows: 350.8 ± 38.8, 60.3 ± 8.2, 122.5 ± 20.2, 989.5 ± 127.0, 5321.8 ± 1188.7, and 4726.4 ± 1209.4 (testosterone 7α-, 16β-, 2β-, 6β-, 2α-, and 16α- hydroxylations, respectively). All values are expressed as bar graphs of the mean (S.D.). Statistical significance was assessed by the Kruskal-Wallis test, followed by multiple comparisons of mean ranks (A) and one-way ANOVA test (B). Statistical significance with respect to the control group (propylene glycol, n = 6) is indicated with **P ≤ 0.01.
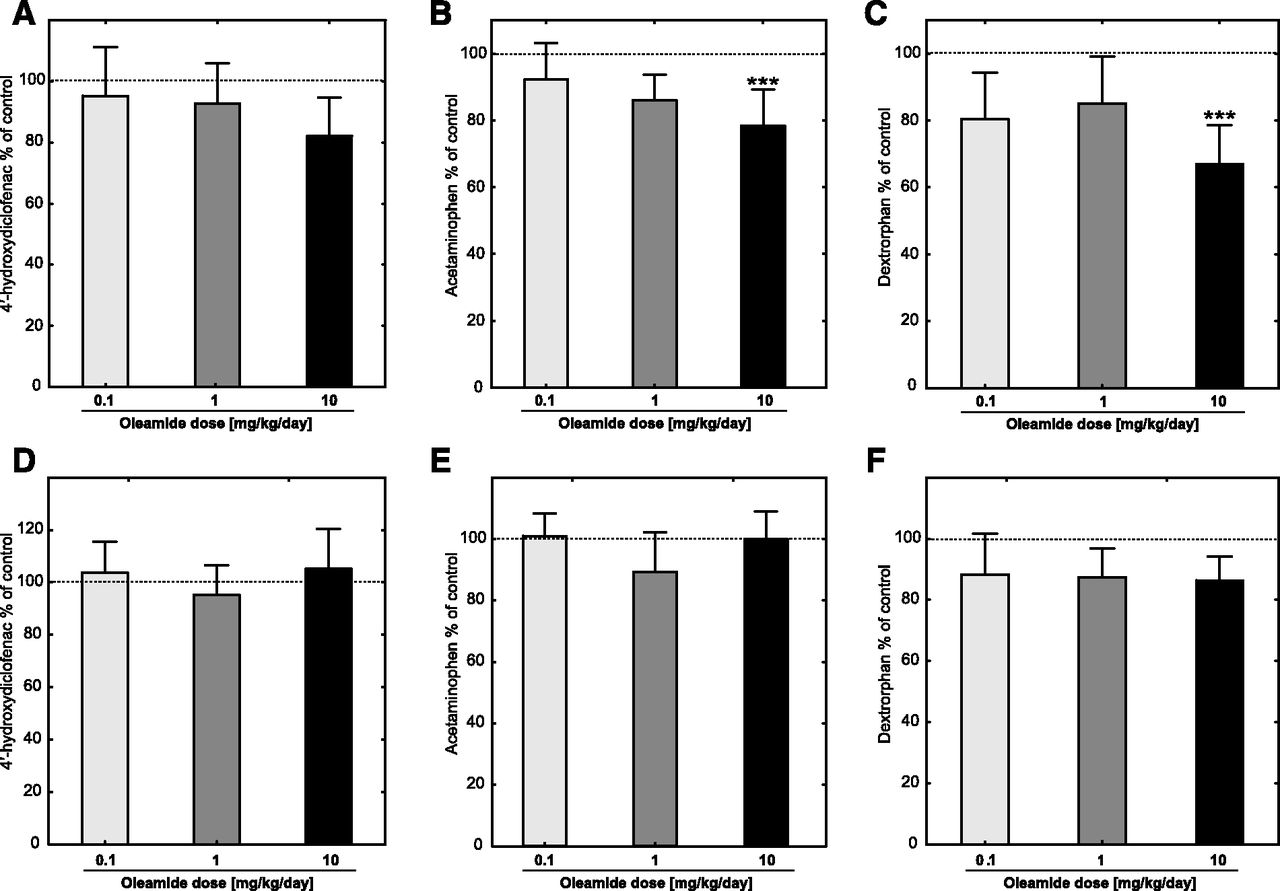
- Fig. 3.
(A) Relative metabolic activity of CYP2C6 after systemic administration of oleamide, measured as rate of diclofenac 4′-hydroxylation and shown as the percentage of the rate of reaction in the control group. The absolute control value was 1194.4 ± 184.4 pmol/min per milligram of total protein content. (B) Relative metabolic activity of CYP1A2 after systemic administration of oleamide, measured as the rate of phenacetin O-deethylation and shown as the percentage of the rate of reaction in the control group. The absolute control value was 361.3 ± 21.5 pmol/min per milligram of total protein content. (C) Relative metabolic activity of CYP2D2 after systemic administration of oleamide, measured as rate of dextromethorphan O-demethylation and shown as the percentage of the rate of a reaction in the control group. The absolute control value was 1154.9 ± 135.0 pmol/min per milligram of total protein content. Animals were treated intraperitoneally with oleamide, 0.1 (n = 10), 1 (n = 10), 10 mg/kg per day (n = 10), and propylene glycol (control group, n = 6). Reactions were performed in the presence of diclofenac (100 µM), phenacetine (400 µM), or dextromethorphan (500 µM) in RLMs (1 mg/ml of the total protein content) with the NADPH-generating system in a final volume of 1 ml at 37°C for 15 minutes (phenacetine) or 20 minutes (diclofenac and dextromethorphan). (D–F) Specific metabolic activities of CYP2C6, CYP1A2, and CYP2D6 after systemic administration of oleamide measured as the rate of testosterone hydroxylation per nanomoles of total P450 content per minute and shown as the percentage of the rate of reaction in control group. The absolute control values (picomoles per minute per nanomoles of total P450 content) were as follows: 1926.3 ± 292.4, 582.48 ± 23.4, and 1859.5 ± 169.2 (diclofenac 4′′-hydroxylation, phenacetin O-deethylation, and dextromethorphan O-demethylation, respectively). Bars and whiskers express the mean (S.D.). Statistical significance was assessed by one-way ANOVA test, followed by Tukey’s significant difference test for unequal sample sizes. Statistical significance with respect to the control group (propylene glycol, n = 6), is indicated with ***P ≤ 0.001.
- Fig. 4.
Western blot analysis showing the expression of CYP1A2, CYP2B, CYP2C11, and CYP3A1 enzymes in RLMs after systemic administration of oleamide. Animals were treated intraperitoneally with oleamide 0.1 (n = 10), 1 (n = 10), 10 mg/kg per day (n = 10), and propylene glycol (control group, n = 6). (A) Representative blots of three individual animals of each group show expression of each indicated protein (10 µg in all cases). (B–E) Bar graphs show quantification of blots for CYP1A2, CYP2B, CYP2C11, and CYP3A1 protein, respectively. The bars represent means (S.D.) of individual animals of each group in three repetitions. Blots were quantified relative to the loading control (β-actin). Statistical significance was assessed by Wilcoxon signed-rank test and is shown as **P ≤ 0.01; ***P ≤ 0.001 compared with the control.
- Fig. 5.
Dixon plot of the effect of oleamide on 4′-hydroxydiclofenac formation in RLMs from naïve animals in a competitive model of inhibition. Reactions were performed in the presence of diclofenac (4, 8, 16 µM) and various concentrations of oleamide (0, 10, 25, 37.5, 50 µM) in RLMs (0.25 mg/ml of the total protein content) with the NADPH generating system in a final volume of 1 ml at 37°C for 30 minutes after 10 minute preincubation. The reaction was performed in triplicate. V = velocity of the reaction (nanomoles of 4′hydroxydiclofenac per minute per milligram protein) and I = concentration of oleamide (μM).
- Fig. 6.
Interaction of oleamide with PXR, AhR, or CAR in luciferase assays in HepG2 cells in agonistic (A, C, and E) and antagonistic (B, D, and F) modes. In the agonistic mode, cells were treated with 0.1% DMSO (control) or with prototype ligands (5 µM) or three concentrations of oleamide 1, 10, or 30 µM. In the antagonistic mode, cells were treated with prototype ligands (5 µM) in combination with oleamide at concentrations of 1, 10, or 30 µM. Rifampicin (RIF, PXR activator), 3-methylcholanthrene (3-MC, AHR activator), and CITCO (CAR activator) were used as prototype ligands. The data are expressed as the fold-change in firefly luciferase activity normalized to Renilla luciferase activity in each sample and relative to the vehicle (DMSO)-treated control means, which were set to 1. Statistical analyses were performed using at least three independent assays (n = 3) performed in triplicate, and statistical significance was assessed by one-way ANOVA followed by Dunnett’s test.
- Fig. 7.
Oleamide does not affect CYP2B6, CYP2C9, CYP3A4, and CYP1A2 enzymatic activities in vitro and mRNA expression in primary human hepatocytes. It does not inhibit metabolic activities of human CYP2B6 (A), CYP2C9 (B), CYP3A4 (C), and CYP1A2 (D), enzymes expressed in the microsomal fraction of P450 cDNA baculovirus-infected cells. Assays were performed in three independent experiments (n = 3) measured in triplicate. (E) qRT-PCR experiment in primary human hepatocytes treated with oleamide (10 μM), CITCO, RIF, or 3-methylcholantrene (3-MC) for 48 hours before total RNA isolation and qRT-PCR analysis were done. Data are presented as the means (S.D.) of triplicates from a representative batch of primary human hepatocytes (human long-term hepatocytes in monolayer, batch HEP220971, Biopredic) and are expressed as the fold mRNA upregulation relative to the vehicle-treated controls (set to 100%). Statistical significance was assessed by one-way ANOVA, *P ≤ 0.05; ***P ≤ 0.001.
- Fig. 8.
Effect of systemic administration of oleamide on hormone concentrations in rat blood serum. Animals were treated intraperitoneally with oleamide 10 mg/kg per day (n = 10) and propylene glycol (control group, n = 6). Bar graphs show concentrations of free triiodothyronine (A), prolactin (B), and corticosterone (C). The bars represent means (S.D.) of individual animals of each group in three repetitions. Statistical significance was assessed by Mann-Whitney U test.


Tables
Antibody Biologic Source Speciesa Catalog No. Company Dilution Anti-CYP1A2 Mouse m, r, h sc-53241 Santa Cruz Biotechnologyb 1:500 Anti-CYP2B1/2B2 Mouse m, r sc-73546 Santa Cruz Biotechnology 1:500 Anti-CYP2C11 Goat r R-PAP 121 Cypexc 1:5000 Anti-CYP3A1 Mouse m, r, h sc-53246 Santa Cruz Biotechnology 1:1500 Anti-β-actin Rabbit m, r, h, b, p, k sc-4970 Cell Signaling Technologyd 1:500 Anti-mouse Goat A4416 Sigma-Aldriche 1:5000 Anti-goat Rabbit A5420 Sigma-Aldrich 1:5000 Anti-rabbit Goat A6667 Sigma-Aldrich 1:5000 - TABLE 2
P450s interactions with oleamide in vitro (data from the pilot experiment)
The metabolic activities of CYP2A, CYP2B, CYP3A, and CYP2C11 were measured as the rate of testosterone hydroxylation. The absolute control values (picomoles per milligram of protein per minute) were as follows: 1866.7 ± 0.9, 1773.7 ± 0.4, 2080.4 ± 3.5, 2123.9 ± 5.0, 1773.6 ± 0.8, 1825.6 ± 1.3 (testosterone 7α-, 16β-, 2α-, 16α-, 2β-, and 6β- hydroxylation, respectively). The metabolic activity of CYP1A2 was measured as the rate of phenacetin O-deethylation and control value of 53.3 ± 1.2 pmol/mg of protein per minute. The metabolic activity of CYP2C6 was measured as the rate of diclofenac 4′-hydroxylation and the control value 203.8 ± 11.3 pmol/mg of protein per minute. The metabolic activity of CYP2D2 was measured as the rate of dextromethorphan O-demethylation and a control value of 320.2 ± 7.6 pmol/mg of protein per minute. Experiments were performed with single concentrations of substrates phenacetin (300 µM), testosterone (100 µM), diclofenac (8 µM), or dextromethorphan (28 µM) and three concentrations of oleamide in RLMs from naïve animals (0.25 mg/ml of the total protein content) with the NADPH-generating system in a final volume of 1 ml at 37°C. After 10 minutes of preincubation with a different concentration of oleamide, reactions were initiated by the addition of specific markers. The incubation times were 40 (phenacetin and dextromethorphan), 20 (testosterone), and 30 minutes (diclofenac). All reactions were performed in triplicate.
Oleamide CYP450 Metabolic Activity (% Activity of Control) 1A2 2C6 2D2 2A 2B 2C11 3A 0.1 μM 99.7 110.5 110.0 99.9a 100.0b 100.1c 99.6d 100.0e 100.1f 1 μM 108.6 94.2 96.8 100.1a 100.0b 100.8c 100.6d 100.0e 100.2f 100 μM 774 44.2 70.4 98.4a 99.9b 100.9c 99.4d 100.0e 100.0f


