


Article Figures & Data
Figures
- Fig. 1.
Histograms comparing clearances in cynomolgus monkey (lot A 10310012, lot B 10353012) and human (HH1025 and a published donor pool) hepatocytes for nine known OATP substrates. For all drugs, variation across duplicate measurements was <10%. Total uptake (A), passive (B), active clearance (C), and Kpuu (D).
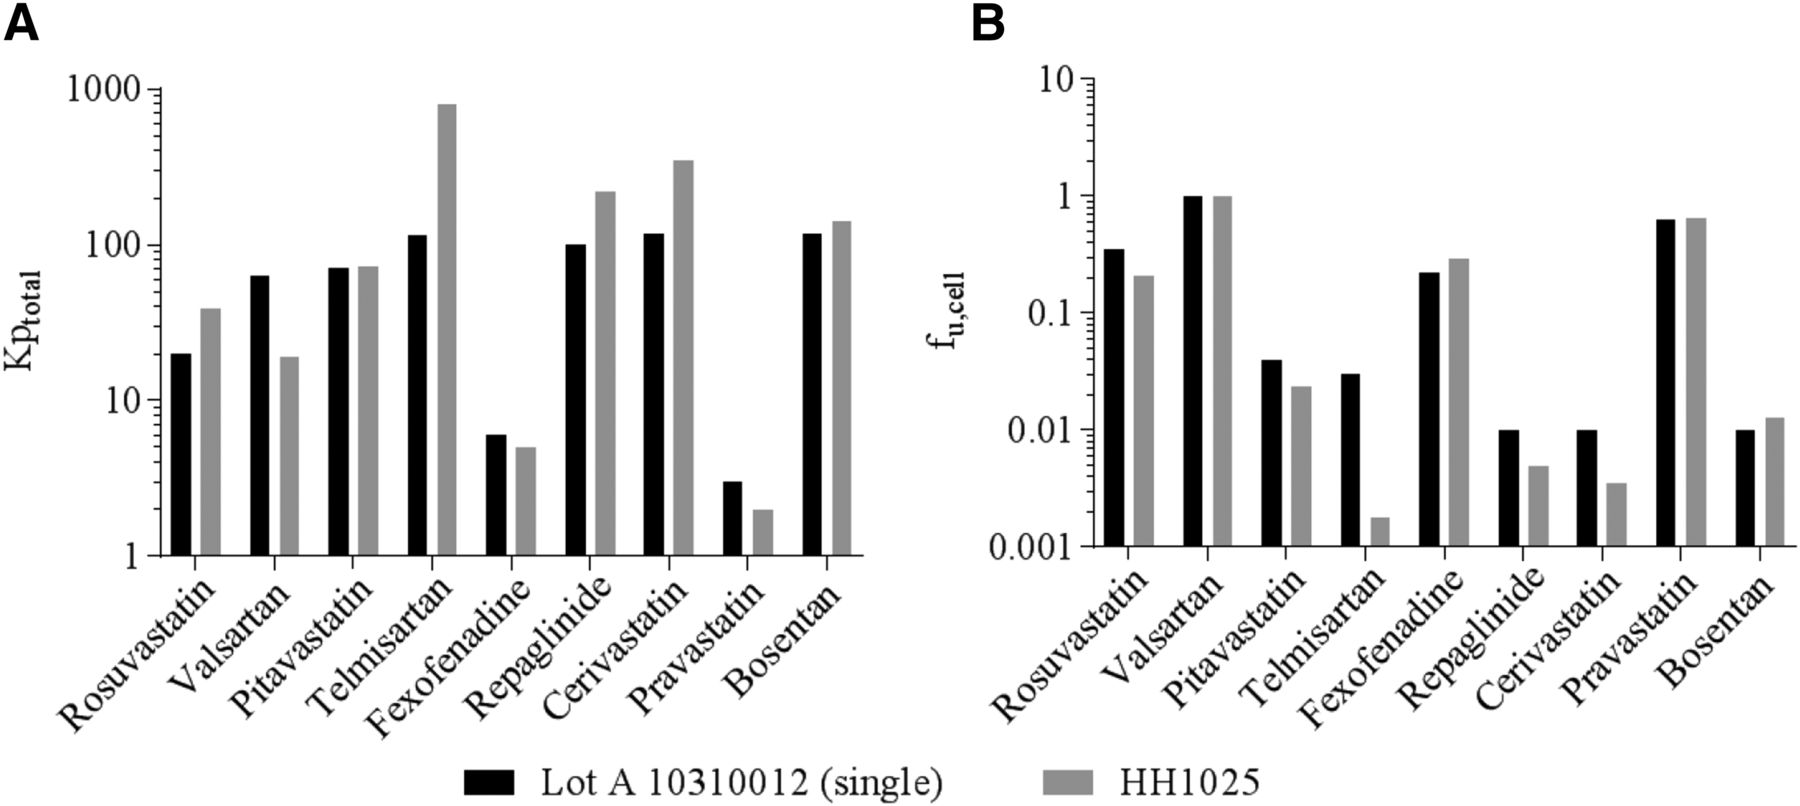
- Fig. 2.
Histograms showing the Kptotal (A) and fucell (B) values for nine known OATP substrates in hepatocytes from cynomolgus monkey (lot A 10310012) and human (HH1025) donors.
- Fig. 3.
Relationships between log D7.4 and passive permeability and cellular binding of nine drugs in cynomolgus monkey and human hepatocytes. (A and B) Plots of CLpassive for cynomolgus monkey (lot A 10310012) and human (HH1025) hepatocytes, respectively. The regression equations shown are log CLpassive = 0.40 log D7.4 + 1.1 and log CLpassive = 0.82 log D7.4 + 0.52, respectively. (C and D) fucell for cynomolgus monkey (lot A 10310012) and human (HH1025) hepatocytes, respectively. The regression equations shown are log fucell = −0.59 log D7.4 + 0.63 (no valsartan value included) and log fucell = −0.75 log D7.4 + 0.71, respectively. Numbers shown relate to particular drugs: 1, pravastatin; 2, fexofenadine; 3, rosuvastatin; 4, valsartan; 5, repaglinide; 6, pitavastatin; 7, cerivastatin; 8, telmisartan; 9, bosentan.
- Fig. 4.
Comparison of the kinetic parameters (A–C) and hepatocyte to medium partition coefficient for unbound drug (Kpuu) (D) of nine OATP substrates obtained between cynomolgus monkey (lot A 10310012) and human hepatocytes (HH1025). CLtotal, CLactive, and CLpassive are total, active, and passive uptake clearance, respectively. Solid and dashed lines represent the line of unity and the 2-fold under-/overprediction boundaries, respectively. Numbers shown relate to particular drugs: 1, pravastatin; 2, fexofenadine; 3, rosuvastatin; 4, valsartan; 5, repaglinide; 6, pitavastatin; 7, cerivastatin; 8, telmisartan; 9, bosentan.
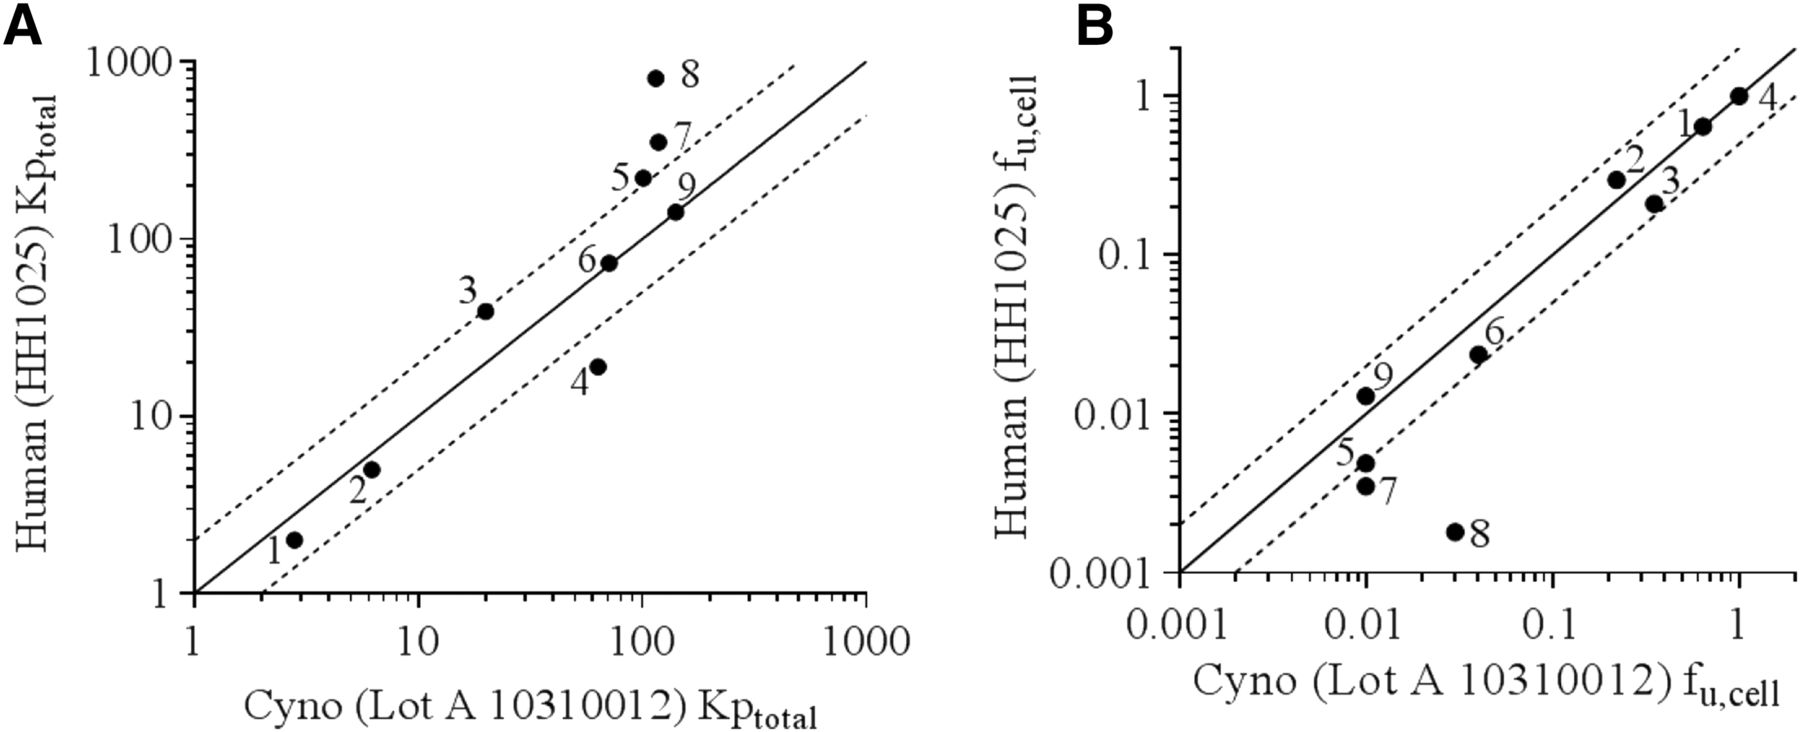
- Fig. 5.
Correlation between Kptotal (A) and intracellular fraction of unbound drug (fucell) (B) in human and cynomolgus monkey hepatocytes. Solid and dashed lines represent the line of unity and the 2-fold under-/overprediction boundaries, respectively. Numbers shown relate to particular drugs: 1, pravastatin; 2, fexofenadine; 3, rosuvastatin; 4, valsartan; 5, repaglinide; 6, pitavastatin; 7, cerivastatin; 8, telmisartan; 9, bosentan.
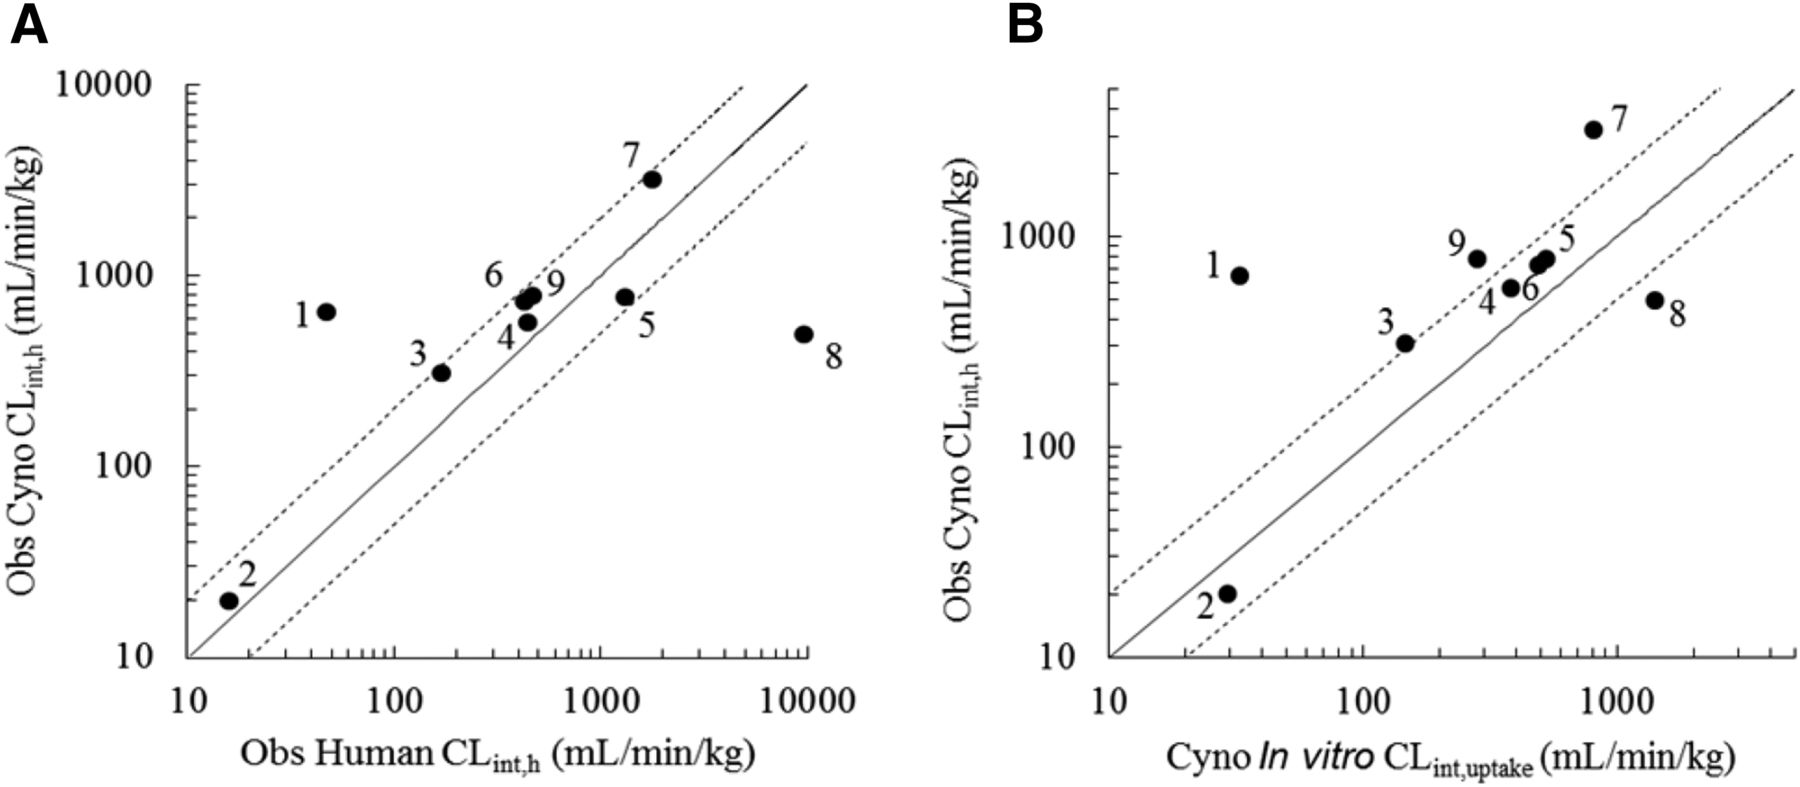
- Fig. 6.
Comparison of in vivo intrinsic hepatic clearance (CLint,h) of nine OATP substrates between cynomolgus monkeys and humans (A) and correlation between observed (Obs) and calculated CLint,h in cynomolgus monkeys (B). CLint,h values were determined from hepatic clearance calculated from systemic clearance following intravenous bolus administration and using the well stirred liver model (eq. 4). The in vitro data in cynomolgus monkey hepatocytes were from lot A 10310012. The solid and dashed lines represent the line of unity and 2-fold under-/overprediction boundaries, respectively. Numbers shown relate to particular drugs: 1, pravastatin; 2, fexofenadine; 3, rosuvastatin; 4, valsartan; 5, repaglinide; 6, pitavastatin; 7, cerivastatin; 8, telmisartan; 9, bosentan.
- Fig. 7.
Correlation between observed (Obs) and calculated in vivo intrinsic hepatic clearance values (CLint,h; milliliters per minute per kilogram) in humans (A–C) and the corresponding residual plots for these predictions (D–F). Direct use of in vitro parameters (A and D) and use of empirical scaling factors (B, C, E, and F) for human prediction obtained from using either the average of all cynomolgus monkey drug clearances (ESFav) or individual specific drug clearances (ESFsd), respectively. The solid and dashed lines represent the line of unity and 2-fold under-/overprediction boundaries, respectively. Numbers shown relate to particular drugs: 1, pravastatin; 2, fexofenadine; 3, rosuvastatin; 4, valsartan; 5, repaglinide; 6, pitavastatin; 7, cerivastatin; 8, telmisartan; 9, bosentan.


Tables
- TABLE 1
In vitro kinetic parameters for the hepatic uptake of nine OATP substrates in cynomolgus monkey and human hepatocytes
Donor CLuptake CLpassive CLactive Kpuu µl/min/mg protein Bosentan Lot A 77 54 23 1.4 Lot B 137 86 51 1.6 HH1025 81 44 37 1.8 Cerivastatin Lot A 223 221 1.5 1 Lot B 161 117 44 1.4 HH1025 244 199 45 1.2 Fexofenadine Lot A 8 5.9 2.1 1.4 Lot B 9.7 3.4 6.3 2.8 HH1025 8.4 5.7 2.7 1.5 Pitavastatin Lot A 134 52 82 2.6 Lot B 73 42 32 1.8 HH1025 172 100 72 1.7 Pravastatin Lot A 9 5 4 1.8 Lot B 7.9 0.4 7.5 19 HH1025 1 0.8 0.2 1.3 Repaglinide Lot A 129 121 8 1.1 Lot B 138 101 37 1.4 HH1025 95 88 7 1.1 Rosuvastatin Lot A 40.1 ± 9 5.7 ± 2 34.4 7.0 Lot B 53 17 36 3.1 HH1025 37 ± 9 4.8 ± 0.5 33 8.2 Telmisartan Lot A 387 104 283 3.7 Lot B 425 407 18 1 HH1025 351 242 109 1.5 Valsartan Lot A 105 21 84 5.1 Lot B 85 2 83 37 HH1025 15.9 0.2 15.7 80 Lot A and lot B represent a single (10310012) and pooled (10353012) donors of cynomolgus hepatocytes, respectively. The mean uptake of rosuvastatin control across all experiments performed in this study (n = 5) for cynomolgus monkeys and (n = 3) for humans is shown, and for all other drugs variation across duplicate measurements was <10%.
- TABLE 2
Hepatocyte-to-medium drug concentration ratios and intracellular fraction of unbound drug for nine OATP substrates in plated cynomolgus and human hepatocytes
Compounds Cynomolgus Monkey Human Log D7.4 Kptotal fucell Kptotal fucell Bosentan 141 0.01 142 0.01 1.25 Cerivastatin 118 0.01 352 0.004 1.9 Fexofenadine 6 0.22 5 0.3 0.3 Pitavastatin 71 0.04 73 0.024 1.2 Pravastatin 3 0.64 2 0.64 −0.4 Repaglinide 101 0.01 221 0.01 2.3 Rosuvastatin 20 0.35 39 0.21 −0.33 Telmisartan 115 0.03 807 0.002 2.5 Valsartan 64 1.0a 19 1.0 −1.11 ↵a Calculated from the relationship log fucell = −0.59 log D7.4 + 0.63.
- TABLE 3
In vivo hepatic clearance values, Rb values, and protein binding for nine OATP substrates
In vivo hepatic clearance values (CLint,h) were calculated from in vivo CLh after intravenous dosing to cynomolgus monkeys. Blood-to-plasma partitioning (Rb) in cynomolgus monkeys was assumed to be equal to reported Rb values in humans. Protein binding was determined in vitro using membrane dialysis.
Species CLtotal CLR CLh CLint,h Rb fu References ml/min/kg Bosentan Cynomolgus 17.9 ± 3.1 n/d 17.9 776 0.66 0.061 Human 2.1 n/d 2.1 468 0.053 Weber et al. (1996, 1999), Jones et al. (2012) Cerivastatin Cynomolgus 19 ± 3.6 n/d 19 3181 0.76 0.014 Human 2.9 n/d 2.9 1778 0.002 Muck et al. (1997), Jones et al. (2012) Fexofenadine Cynomolgus 6.5 ± 1.7 1.7 4.8 19 0.55 0.31 Human 3.1 1.2 1.9 13 0.18 Lappin et al. (2010), Watanabe et al. (2011) Pitavastatin Cynomolgus 10.9 ± 2.4 0.1 10.8 723 0.58 0.026 Human 5.7 n/d 5.7 434 0.025 Watanabe et al. (2010) Pravastatin Cynomolgus 30 ± 4.0 6.9 23.1 644 0.56 0.65 Human 14 6.6 7.4 48 0.43 Singhvi et al. (1990), Jones et al. (2012), Poulin et al. (2012) Repaglinide Cynomolgus 6.9 ± 0.7 n/d 6.9 771 0.62 0.012 Human 7.8 n/d 7.8 1326 0.015 van Heiningen et al. (1999), Plum et al. (2000), Obach et al. (2008) Rosuvastatin Cynomolgus 23.7 ± 1.8 4.3 19.4 305 0.69 0.18 Human 10.5 2.9 7.6 172 0.09 Martin et al. (2003), Jones et al. (2012) Telmisartan Cynomolgus 9 ± 2.5 n/d 9 490 0.78 0.025 Human 12 n/d 12 9657 0.005 Stangier et al. (2000), Yoshida et al. (2012), Shitara et al. (2013) Valsartan Cynomolgus 6.5 ± 0.6 0.6 5.9 560 0.55 0.014 Human 0.49 0.14 0.35 361 0.001 Flesch et al. (1997), Watanabe et al. (2011), Jones et al. (2012) n/d, not detectable.
- TABLE 4
Statistical data comparing the accuracy and precision of the approaches used to predict human CLint,h
Human donor HH1025 hepatocytes were used.
Methods Direct ESFav ESFsd gmfe 3.8 (3.5)a 2.5 (2.3)a 2.4 (4.4)a rmse 2963 2430 3140 % within 2-fold error 33 (43)a 33 (57)a 67 (57)a ↵a Corresponding metrics when published human donor hepatocyte pool (Ménochet et al., 2012b) was used.
- TABLE 5
Drug-specific empirical scaling factors obtained in cynomolgus monkey hepatocytes and used to estimate CLint,uptake in human hepatocytes
Compounds ESF Rosuvastatin 2.07 Pitavastatin 1.47 Valsartan 1.46 Repaglinide 1.63 Fexofenadine 0.67 Pravastatin 19.5 Telmisartan 0.34 Bosentan 2.76 Cerivastatin 3.89
Data Supplement
- Supplemental Figures -
Supplemental Figure 1 - Uptake profiles of nine OATP substrates (1 μM) generated in cryopreserved cynomolgus monkey hepatocytes (Lot A: 10310012) in the absence (closed symbols) and presence (open symbols) of OATP inhibitor rifamycin SV (100 μM)
Supplemental Figure 2 - Uptake profiles of nine OATP substrates (1 μM) generated in cryopreserved human hepatocytes (HH1025) in the absence (closed symbols) and presence (open symbols) of OATP inhibitor rifamycin SV (100 μM)
Supplemental Figure 3 - Comparison of CLuptake (panel A), CLactive (panel B), CLpassive (panel C) and Kpuu (panel D) of nine OATP substrates between two different lots (single lot A: 10310012, pooled lot B: 10353012) of cryopreserved cynomolgus monkey hepatocytes
Supplemental Figure 4 - Plasma concentration (ng/mL) over time (h) profiles of nine OATP substrates obtained in cynomolgus monkey
Supplemental Figure 5 - Comparison of in vivo intrinsic hepatic clearance (CLint,h) with scaled in vitro intrinsic clearance (CLint,uptake) of nine OATP substrates in cynomolgus monkey (panel A) and human (panel B) following the optimization of CLint,uptake by the empirical scaling factor from average bias (2.7- and 3.8-fold, respectively)
Supplemental Figure 6 - Correlation between observed and calculated in vivo intrinsic hepatic clearance values CLint,h (mL/min/kg) in humans (panel A-C) and the precision error (as log of the predicted/observed CLint ratio) for predicted human CLint for nine OATP substrates (panel D-E)
- Supplemental Figures -


