


Abstract
[18F]fluorocholine is the fluorinated analog of [11C]choline and is used in positron emission tomography to monitor tumor metabolic activity. Although important to optimize its use and expand the clinical indications, the molecular determinants of fluorocholine cellular uptake are poorly characterized. In this work, we described the influx kinetics of fluorocholine mediated by the organic cation transporter 2 (OCT2, SLC22A2) and compared with that of choline. Then we characterized the expression pattern of OCT2 in renal cell carcinoma (RCC). In HEK293 cells stably transfected with OCT2 fluorocholine influx, kinetics was biphasic, suggesting two independent binding sites: a high-affinity (Km = 14 ± 8 µM, Vmax = 1.3 ± 0.5 nmol mg−1 min−1) and a low-affinity component (Km = 1.8 ± 0.3 mM, Vmax = 104 ± 4.5 nmol mg−1 min−1). Notably, choline was found to be transported with sigmoidal kinetics typical of homotropic positive cooperativity (h = 1.2, 95% confidence interval 1.1–1.3). OCT2 mRNA expression level was found significantly decreased in primary but not in metastatic RCC. Tissue microarray immunostaining of 216 RCC biopsies confirmed that the OCT2 protein level was consistent with that of the mRNA. The kinetic properties described in this work suggest that OCT2 is likely to play a dominant role in [18F]fluorocholine uptake in vivo. OCT2-altered expression in primary and metastatic cancer cells, as compared with the surrounding tissues, could be exploited in RCC imaging, especially to increase the detection sensitivity for small metastatic lesions, a major clinical challenge during the initial staging of RCC.
Introduction
Choline is a dietary requirement for most mammals. In the liver and in the kidney, choline serves for the synthesis of phosphatidylcholine and betaine. In neurons choline is the precursor of the neurotransmitter acetylcholine (Pelech and Vance, 1984). Cancer cells often display an abnormal choline intracellular accumulation possibly as result of the upregulation of membrane transporters or of the choline kinase, the first committed step in the synthesis of phosphatidylcholine (Glunde et al., 2011). [11C]choline showed promising results as positron emission tomography (PET) tracer for imaging of brain, liver, and prostate tumors (Glunde et al., 2015). However, due to the short half-life of the carbon-11 (20.1 minutes), the fluorine-18 (109.8 minutes)–labeled choline [18F]fluorocholine is more commonly used (DeGrado et al., 2001).
[18F]fluorocholine has been recognized to improve the noninvasive diagnostic sensitivity in a number of malignancies, yet a rigorous characterization of its cellular uptake may contribute to optimize and perhaps further expand its clinical application. Studies on fluorocholine cellular pharmacology are scarce probably because it is practical considering fluorocholine a mere surrogate of choline, although it has been already demonstrated that the fluorine modification can increase the affinity of the molecule for the choline kinase and reduces its oxidation to betaine (DeGrado et al., 2002; Glunde et al., 2011; Witney et al., 2012).
[11C]choline and [18F]fluorocholine pattern of hepatic and renal distribution is substantially different, suggesting that also the transport of fluorocholine across the plasma membrane may differ from that of choline (Haroon et al., 2015). Indeed, we recently found that [18F]fluorocholine accumulation in the liver was associated with the expression levels of the organic cation transporters 1 and 3 (OCT1 and OCT3). Functional studies confirmed that fluorocholine, unlike choline, is substrate of both OCT1 and OCT3 (Visentin et al., 2017), supporting the hypothesis that fluorocholine and choline may have distinct cellular uptake pattern. In the kidney, OCT2, the main choline transporter, was previously shown to recognize fluorocholine as a substrate (Gorboulev et al., 1997; Severance et al., 2017; Visentin et al., 2017). The different renal distribution between choline and fluorocholine might be due to diverse recognition modalities by OCT2. The current work kinetically characterized the transport of fluorocholine mediated by the organic cation transport 2 (OCT2-SLC22A2), and compared with that of choline. The expression levels of OCT2 in primary and metastatic renal cell carcinoma (RCC) were assessed, and the possible implications for kidney cancer [18F]fluorocholine PET imaging were discussed.
Materials and Methods
Patients and Tissues.
All of the procedures followed the ethical standards on human experimentation and the Helsinki declaration. The local medical ethics committee approved the study (KEK-ZH 2013-0629). Patients diagnosed with RCC were identified from the database of the Department of Pathology and Molecular Pathology of the University Hospital of Zurich. All RCCs were histologically re-evaluated by one expert pathologist and then selected upon evaluation of the H&E-stained tissue sections. The RCC tissue microarray (TMA) was constructed, as previously described (Mertz et al., 2007). Tumors were staged and histologically classified according to the World Health Organization classification (Moch et al., 2016). The TMA included 354 renal tumors and 14 normal kidney tissue as control. More information about patient characteristics is available in Table 1. cDNA samples used for the assessment of SLC22A2 mRNA expression level were commercially available from Origene (Rockville, MD). Patient information is available online (https://www.origene.com/catalog/tissues/tissuescan/hkrt102/tissuescan-kidney-cancer-cdna-array-ii).
Patients and tumor characteristics included in the TMA
Reagents.
Fluoromethylcholine[1,2-3H]chloride ([3H]fluorocholine, specific activity 60 Ci/mmol) was purchased from American Radiolabeled Chemicals (St. Louis, MO), and choline chloride [methyl-14C] ([14C]choline, specific activity 52 mCi/mmol) from Perkin Elmer (Boston, MA). Nonlabeled fluoromethylcholine (fluorocholine) was provided by BioTrend (Köln, Germany), and nonlabeled choline chloride by Sigma-Aldrich (St. Louis, MO). All cell culture reagents were purchased from Gibco (Parsley, UK).
Cell Lines.
Wild-type (WT)-HEK293 cells and HEK293 cells stably transfected with OCT2 (OCT2-HEK293) were cultured in Dulbecco’s modified Eagle’s medium supplemented with 10% fetal bovine serum, 100 U/ml penicillin, and 100 µg/ml streptomycin at 37°C in a humidified atmosphere of 5% CO2. OCT2-HEK293 cells were maintained under selective pressure with Geneticin G-418 at the extracellular concentration of 500 μg/ml (Thevenod et al., 2013).
Real-Time Polymerase Chain Reaction.
The kidney cDNA array was commercially available from Origene. The cDNA products were used as template for polymerase chain reaction amplification of the SLC22A2 (Hs00533907_m1) and β-actin (4310881E-1501041) cDNA by TaqMan assay (Applied Biosystems, Foster City, CA).
Immunofluorescence of WT- and OCT2-HEK293 Cells.
Cells were seeded on chamber slides coated with 0.1 mg/ml poly-D-lysine (Corning, Bedford, MA). Twenty-four hours later, cells were washed with cold phosphate-buffered saline (PBS), fixed in 4% paraformaldehyde, and treated with 0.1% Triton X-100 in PBS for 15 minutes and with 0.1% Tween 20 in 1% bovine serum albumin/PBS for 30 minutes. Then the cells were incubated at 4°C overnight with an antibody raised against the full-length OCT2 protein (clone 640438; R&D Systems, Minneapolis, MN). After washing, the cells were stained with AlexaFluor 488 goat anti-mouse IgG (A-11001; Thermo Fisher, Waltham, MA). Actin was probed with ActinRed555 (R37112). Cells were mounted with 4′,6′-diamidino-2-phenylindole (Vector Laboratories, Burlingame, CA) and visualized under fluorescent microscope (DMI6000B; Leica, Heerbrugg, Switzerland).
Isolation of Membrane Fractions from WT- and OCT2-HEK293 Cells and Immunoblot Analysis.
The isolation of a total membrane fraction from WT- and OCT2-HEK293 cells was modified from a method described previously (Huber et al., 2007). After homogenization of the cells with a Teflon homogenizer in 5 mM sucrose buffer supplemented with 5 mM phenylmethylsulfonate, 1 µg/ml antipain, and leupeptin, the homogenates were centrifuged for 10 minutes at 900g in a Sorvall SS34 rotor. The supernatant was collected and centrifuged for 20 minutes at 8500g in a Sorvall SS34 rotor. The supernatant was transferred and centrifuged for 1 hour at 100,000g in a Kontron ultracentrifuge. The total membrane fractions were resuspended in 250 mM sucrose with a 25G needle and stored until use at −80°C. Protein samples (30 µg) were resolved on 10% (w/v) polyacrylamide gels and electroblotted onto polyvinylidene difluoride membranes (GE HealthCare, Piscataway, NJ). The membranes were blocked with 5% nonfat dry milk in PBS supplemented with 0.1% (v/v) Tween 20 (PBS-T), washed in PBS-T buffer, and incubated overnight at 4°C with anti-OCT2 antibody (clone 640438; R&D Systems), followed by probing with horseradish peroxidase–conjugated secondary antibody. Blots were developed with SuperSignal West Femto Maximum Sensitivity Substrate (Thermo Scientific) and Fusion FX7 (Vilber Lourmat, Eberhardzell, Germany). As loading control, the sample blots were probed with anti-protein disulfide isomerase (Wlcek et al., 2014).
Immunohistochemistry of the Tissue Microarray.
Immunostaining was performed on TMA paraffin section using a microwave-based antigen-retrieval technique. Sections were treated with the Envision+ diaminobenzidine kit (Dako, Basel, Switzerland), according to the manufacturer’s instruction, and then probed with the anti-OCT2 antibody previously tested (clone 640438; R&D Systems). The intensity of immunostainings for OCT2 was assessed according to protocols previously described (Gai et al., 2010). Briefly, digital images of random high-power fields were analyzed by an unbiased observer. The cross-sectional areas with positive staining were determined using Adobe Photoshop (version C3 for Windows). Five high-power fields were analyzed per biopsy.
Transport Studies in Intact Cells.
Uptake of radiolabeled compounds was measured using a protocol designed for uptake determination in intact cells (Schroeder et al., 1998; Visentin et al., 2015). WT-HEK293 and OCT2-HEK293 cells were seeded on 35-mm dishes coated with 0.1 mg/ml poly-D-lysine at the density of 2 × 10⁵ cells/dish (Corning). Seventy-two hours after seeding, cells were washed and equilibrated in transport buffer (116.4 mM NaCl, 5.3 mM KCl, 1 mM NaH2PO4, 0.8 mM MgSO4, 5.5 mM D-glucose, and 20 mM HEPES/NaOH, pH 7.4) at 37°C, and then the buffer was aspirated, and transport buffer containing the radiolabeled substrate was added. Uptake was stopped by quick aspiration, followed by extensive washing with ice-cold transport buffer. Cells were solubilized with 1% (v/v) Triton X-100, and intracellular radioactivity was assessed by liquid scintillation counting. Protein content was determined by the bicinchoninic acid protein assay (Interchim, Montluçon Cedex, France). OCT2-independent uptake was determined in WT-HEK293 cells and subtracted from the total uptake to quantify the OCT2-mediated transport. Uptake is expressed as picomoles/nanomoles of substrate per milligram of protein.
Statistical Analysis.
Statistical comparisons were performed using GraphPad Prism (version 5.0 for Windows; GraphPad Software San Diego, CA). The variance in mRNA expression levels of each target gene was subjected to the nonparametric Kruskal–Wallis test and to a Dunn’s test for head-to-head comparisons (post hoc comparisons). Immunohistochemistry quantifications were compared by Mann–Whitney test. Comparisons of transport measurements were analyzed with the two-tailed Student’s unpaired t test.
Results
OCT2-Mediated Influx of Choline and Fluorocholine.
Figure 1 illustrates the time course of uptake of choline and fluorocholine over an interval of 5 to 6 seconds at an extracellular concentration of 0.5 μM at pH 7.4. The increase in intracellular choline and fluorocholine as a function of time was linear, and the uptake slope extrapolates to the point of origin. Hence, uptake over this interval reflects the unidirectional flux of the substrates into these cells. The transport rate of choline was ∼twofold greater than that in the WT cells (slope, 0.70 ± 0.04 pmol mg−1 s−1 versus 0.38 ± 0.02 pmol mg−1 s−1) (Fig. 1A), whereas fluorocholine influx in OCT2-HEK293 was ∼10 times that in WT-HEK293 cells (slope, 0.49 ± 0.03 pmol mg−1 s−1 versus 0.05 ± 0.01 pmol mg−1 s−1) (Fig. 1B). Notably, the endogenous transport of choline contributed for more than 50% to the choline influx rate in OCT2-HEK293 cells, and only for 10% of that of fluorocholine, indicating that, at low concentrations, fluorocholine uptake in HEK293 cells was OCT2-dependent. Figure 2 shows the OCT2-mediated influx of fluorocholine and choline at the extracellular concentration of 1 µM (Fig. 2A) or 1 mM (Fig. 2B). It can be seen that fluorocholine OCT2-mediated influx was ∼4 times that of choline at low concentration (116.2 ± 14.3 pmol mg−1 min−1 versus 29.9 pmol mg−1 min−1 versus 8.0 pmol mg−1 min−1). No difference in influx was observed at high extracellular concentration of substrate.
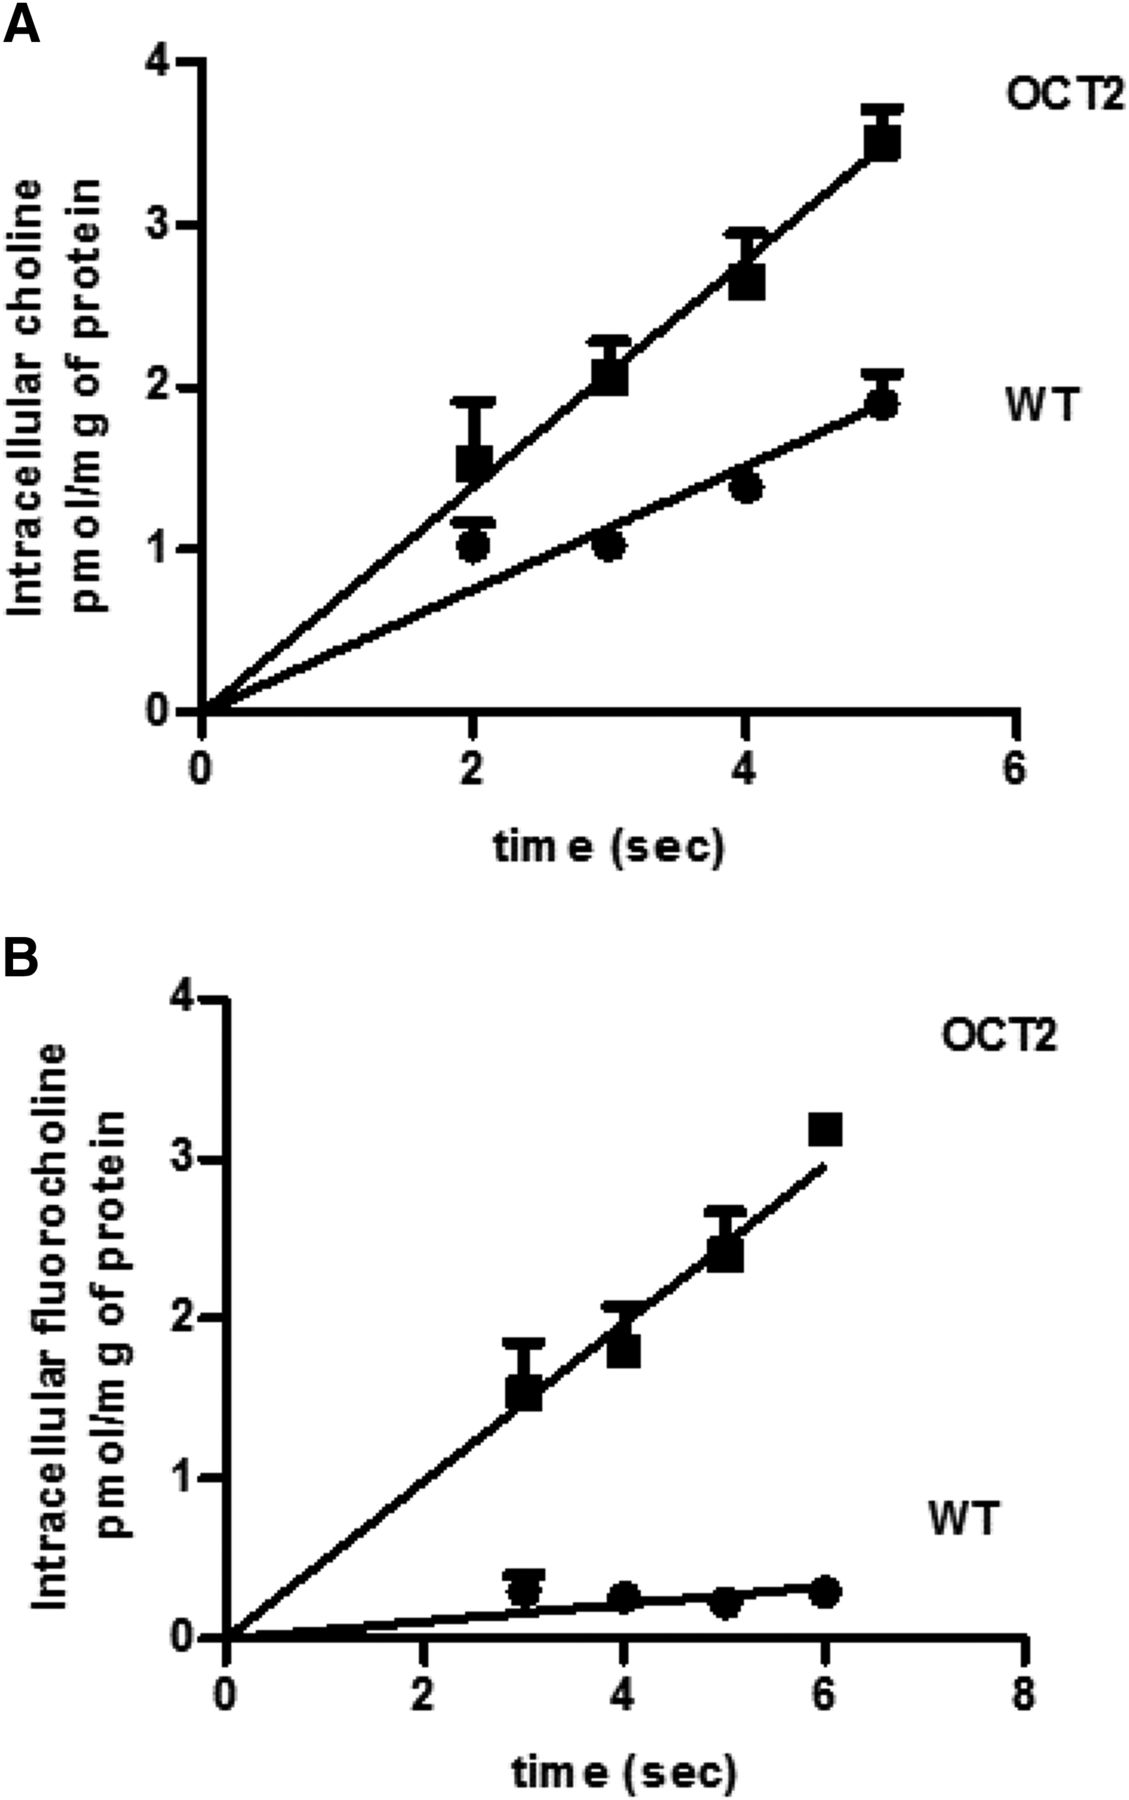
Impact of OCT2 expression on the influx rate of choline and fluorocholine. Time course of choline (A) or fluorocholine (B) at the extracellular concentrations of 0.5 µM in WT- and OCT2-HEK293 cells. Results represent the mean ± S.D. from three independent experiments.

OCT2-mediated influx as a function of the substrate concentration. Influx rate of choline and fluorocholine at the extracellular concentration of 1 µM (A) or 1 mM (B). Data were corrected for uptake in WT-HEK293 cells and represent the mean ± S.D. from three independent experiments.
Influx Kinetics of Choline and Fluorocholine Mediated by OCT2.
The higher rate of fluorocholine over choline influx at the extracellular concentration of 1 µM was consistent with a substantial difference in the binding properties of fluorocholine and choline for OCT2. Accordingly, the kinetic basis for these changes in influx was assessed. OCT2-mediated influx of choline and fluorocholine as a function of the extracellular concentration of substrate was measured over 5 seconds. Figure 3 illustrates the nonlinear regression, the Eadie–Hofstee, and the Hill plot of choline influx. A sigmoidal rather than hyperbolic curve was observed, indicating allosterism (Fig. 3, A and B). The K0.5 and the Vmax values were computed to be 0.30 ± 0.03 mM and 38.3 ± 0.84 nmol mg−1 min−1.

Kinetic analysis of choline influx. Initial uptake of choline was assessed as a function of the extracellular concentration of substrate over 5 seconds at pH 7.4 in OCT2-HEK293 cells. Data were corrected for uptake in WT-HEK293 cells and represented as sigmoidal plot (A). Enlargement of the first part of the kinetic analysis (B). Eadie–Hofstee (C) and Hill (D) transformation. Results represent the mean ± S.D. from three independent experiments.
The concave curvature toward the y-axis of the Eadie-Hofstee plot (Fig. 3C) and a Hill coefficient >1 (1.2, 95% confidence interval 1.1–1.3) (Fig. 3D) are consistent with a homotropic positive cooperativity. Fluorocholine influx kinetics appeared to best fit the Michaelis–Menten kinetics (Fig. 4A). However, a first deflection from linearity could be observed when the lower data points were inspected (Fig. 4B). Biphasic influx kinetics was confirmed by Eadie–Hofstee transformation of the data (Fig. 4C). Two distinct slopes were generated from the plot, suggesting that fluorocholine could bind to the OCT2-binding pocket at two distinct and independent sites (Table 2).

Kinetic analysis of fluorocholine influx. Initial uptake of fluorocholine was assessed over 5 seconds at pH 7.4 in OCT2-HEK293 cells. Data were corrected for uptake in WT-HEK293 cells and represented as hyperbolic curve (A). Enlargement of the first portion of the kinetic (B) and Eadie–Hofstee transformation (C). Results represent the mean ± S.D. from three independent experiments.
Kinetic parameters of fluorocholine and choline transport rate mediated by OCT2
OCT2 Expression in Renal Cell Carcinoma.
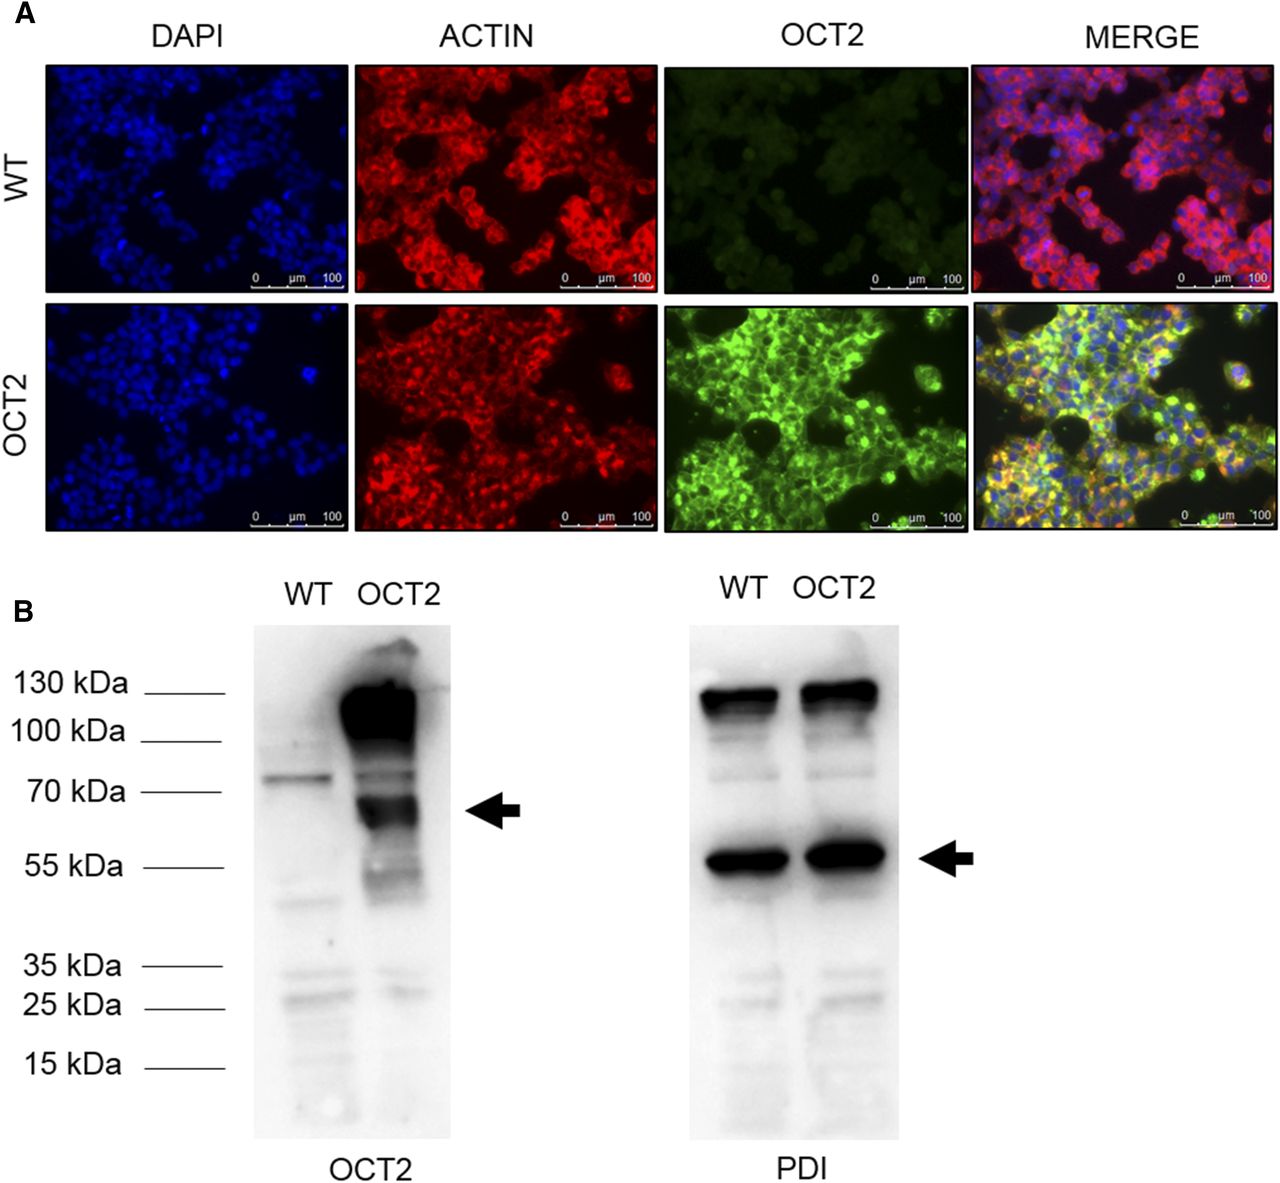
The kinetic data suggest that [18F]fluorocholine accumulation in the kidneys in vivo may vary with the expression level of OCT2. Thus, the modulation of OCT2 expression was assessed in RCC samples. The mRNA expression level of OCT2 was analyzed by relative quantitative method of real-time reverse-transcription polymerase chain reaction based on ΔCt method and expressed in Log10 scale. Based on a previous housekeeping stability analysis within 16 clear cell RCC (ccRCC) samples and their matched healthy tissues, β-actin gene was used in the current study as internal reference (Dupasquier et al., 2014). Eighteen primary ccRCC, six ccRCC metastasis, and 11 primary papillary RCC (pRCC) were compared with nine healthy kidney tissues. Figure 5A shows that OCT2 mRNA level was significantly lower in primary ccRCC (0.01 ± 0.02 versus 0.06 ± 0.06) but not in pRCC (0.03 ± 0.02 versus 0.06 ± 0.06) as compared with that in the normal tissues. The mRNA level of OCT2 was comparable between early and late tumor stages (Fig. 5B). pT1-pT2 (0.01 ± 0.01) and pT3-pT4 (0.01 ± 0.03) ccRCC clusters showed lower OCT2 mRNA levels as compared with the samples from normal kidneys (0.06 ± 0.06). Figure 5C illustrates that the OCT2 mRNA level in metastatic ccRCC was comparable to that of normal tissues (0.07 ± 0.12 versus 0.06 ± 0.06). Immunostaining of OCT2 in RCC was performed using an antibody whose specificity was tested in WT- and OCT2-HEK293 cells by immunostaining (Fig. 6A) and Western blot (Fig. 6B). OCT2 expression was evaluated on a RCC TMA containing 356 tumor specimens and 14 normal renal tissues (Table 1). One hundred and forty biopsies were excluded upon quality control assessment due to residual or lacking biopsy. The analysis was performed on 230 samples classified as follows: 14 normal, 169 ccRCC, 26 pRCC (type I or II), seven chromophobe RCC, nine oncocytoma, and five not otherwise specified cases. In the biopsies from normal kidney, a positive staining was detected at the basolateral side of the proximal tubule (Fig. 7A), in line with the subcellular localization of OCT2 previously reported (Motohashi et al., 2002). Overall, it can be seen that OCT2 expression was markedly reduced in the tumor specimens in all of the histotypes analyzed.
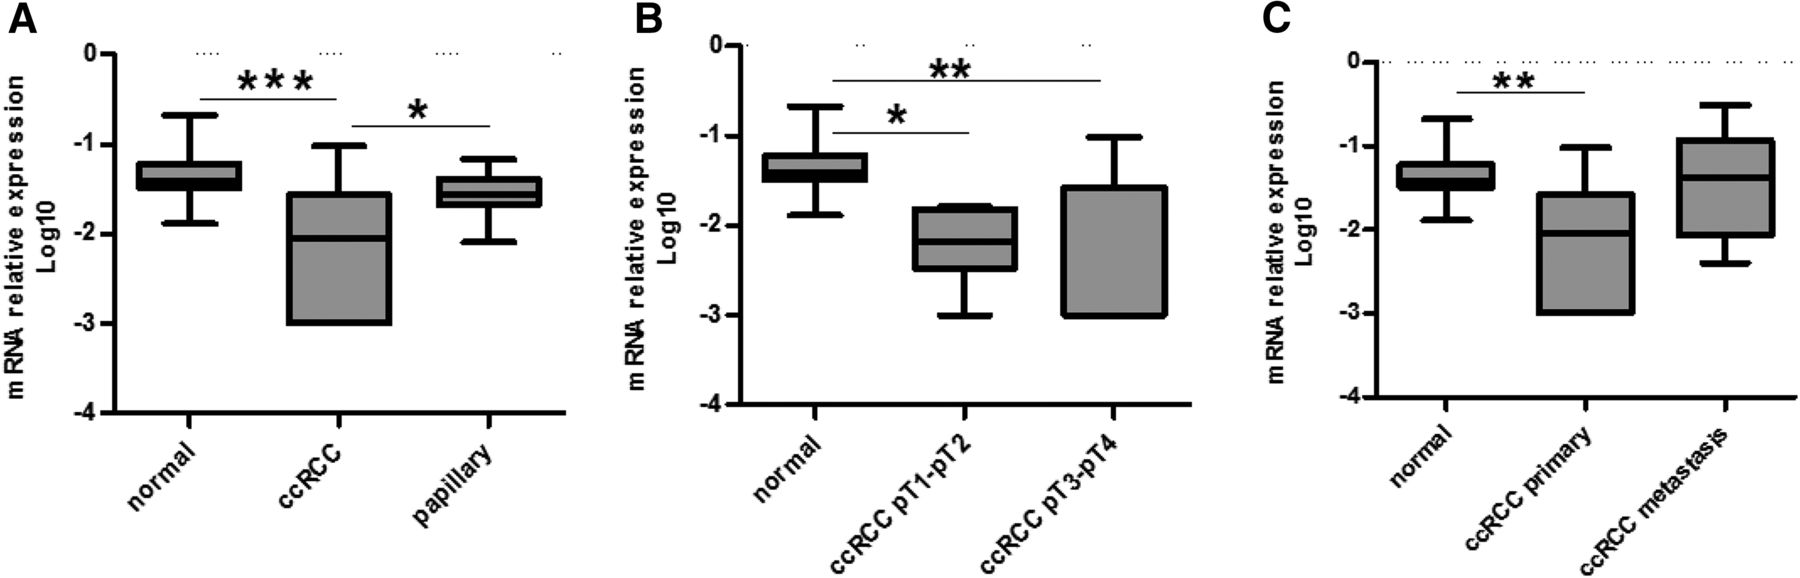
Relative expression of SLC22A2 gene in normal and tumor renal tissues (A–C). mRNA values of the gene SLC22A2, encoding for OCT2, were normalized by the expression of the housekeeping gene β-actin and expressed in Log10 scale and reported as box and whiskers plot analysis with mean, minimum, and maximum values (*P < 0.05; **P < 0.01; ***P < 0.001).

OCT2 expression in WT- and OCT2-HEK293 cells. Representative images of immunostaining (A) and Western blot (B) for OCT2 protein. The protein disulfide isomerase (PDI) was used as loading control of the Western blot analysis.

OCT2 expression in renal biopsy specimens. Representative images of immunohistochemistry staining for OCT2 protein on a TMA constructed from 356 RCC and 14 normal renal tissues (A–E). Quantitative and statistical analysis of the positive staining of OCT2 from the TMA slide (F–I) (Student t test).
Discussion
The structural complexity and the flexibility of the OCT2-binding pocket allow the accommodation of a vast array of xenobiotics, underscoring the dominant role of this transporter in drug tubular secretion and systemic detoxification (Koepsell, 2013). Ligand interaction with OCT2 happens to involve multiple, nonoverlapping sites that can result in atypical kinetics and unexpected drug–drug interactions (Harper and Wright, 2013). The kinetic data presented in this work for the human OCT2-mediated transport of choline in mammalian cells were well modeled empirically by the allosteric sigmoidal equation, demonstrating positive homotropic cooperativity (Hill coefficient >1) with increased binding affinity upon binding of a second choline molecule. Recently, we reported that OCT2 transported the aminoglycoside gentamicin in a similar fashion (Gai et al., 2016). This finding does not reconcile with the previous works on OCT-mediated choline transport. Indeed, choline OCT-mediated uptake measured in Xenopus laevis oocytes or in Chinese hamster ovary (CHO) cells has been described by the classic hyperbola consistent with the Michaelis–Menten model (Gorboulev et al., 1997, 1999; Budiman et al., 2000; Severance et al., 2017). An explanation for this discrepancy might reside in the different in vitro expression systems used. X. laevis oocytes have proven to be remarkably effective for expression of functional membrane carriers, but the modest cholesterol content of the lipid bilayer may affect the binding pocket conformation and protein mobility, with possible consequences in substrate binding and turnover of the protein–substrate complex (Bastiaanse et al., 1997; Hill et al., 2005). Similarly, although CHO and HEK293 cells are both of mammalian origin, it may be speculated that the different CHO cell density used to measure choline influx kinetics, as compared with that of HEK293 cells in the experimental setting described in this study, might result in different plasma membrane lipid composition (Lange et al., 1989; Severance et al., 2017).
Although there is no specific work on OCT2, cholesterol is known to inhibit a number of transmembrane proteins such as Na+/K+-ATPase and Na+/Ca++ exchange (Bastiaanse et al., 1997). A detailed study in membrane vesicles from Sf21 insect cells expressing the multidrug-resistant associated protein 2 (MRP2-ABCC2) showed that high cholesterol content could shift estradiol-17-β-glucuronide influx kinetics from sigmoidal (allosteric binding) to hyperbolic (Michaelis–Menten) (Guyot et al., 2014). Studies dedicated to elucidate the role of plasma membrane lipid composition on OCT2-mediated transport are ongoing in our laboratory.
Fluorocholine influx kinetics was characterized by a biphasic influx kinetics with a high-affinity/low-capacity and a low-affinity/high-capacity component. However, such large difference in binding affinity resulted in only a twofold difference in transport efficiency, making it difficult to separate the contribution of the two binding sites to the transport rate of fluorocholine using the classic hyperbola (Fig. 4, A and B). A better separation was obtained with the Eadie–Hofstee transformation (Fig. 4C) in which data points have equal weight in any range of substrate concentration. Whereas fluorine modification carries the practical advantage of working with the longer-lived radioisotope 18F (half-life ∼110 minutes) as compared with the radioisotope 11C (half-life ∼20 minutes), the high electronegativity of fluorine might affect the neighboring carbon atoms, having a substantial effect on the molecule’s dipole moment, the protonation of nearby groups, and molecule’s lipophilicity (Gillis et al., 2015). Membrane transport processes are often sensitive to microenvironment pH, degree of ionization of the substrates, and protonation of amino acids involved in substrate recognition (Leuthold et al., 2009; Visentin et al., 2012). Indeed, OCT-mediated transport can be inhibited by low pH and depends on the degree of ionization of the compound transported (Kekuda et al., 1998; Okuda and Haga, 2000; Barendt and Wright, 2002). Fluorocholine and choline did interact with different modalities with OCT2, but the calculated transport efficiency (Vmax/Km) was comparable. The higher accumulation of [18F]fluorocholine with respect to [11C]choline in vivo is likely to be OCT2 independent, and may be the result of the concerted activity of OCT1 and OCT3, both previously found to transport fluorocholine, but not choline (Haroon et al., 2015; Visentin et al., 2017).
Nonetheless, OCT2 is likely to play a dominant role in [18F]fluorocholine renal uptake, and it is tempting to speculate that possible changes in OCT2 expression level during renal carcinogenesis result in altered [18F]fluorocholine accumulation. The OCT2 expression level in RCC is a matter of debate. Two independent studies reported conflicting results: Liu et al. (2016) found that OCT2 was downregulated in a small cohort of patients diagnosed with RCC. Winter et al. (2016) could not find any significant change in OCT2 expression in 34 primary RCCs and 17 metastatic RCCs. This work extended such analysis on a larger sample size (216), and the findings are in line with those reported by Liu et al. (2016). Additionally, although performed on a limited numbers of cases (6), it is worth to point out that OCT2 transcription might be reactivated in metastatic lesions.
At pharmacological concentration of [18F]fluorocholine (1/1000th of the OCT2 Km), the rate of transport should be proportional to the total number of molecules. However, the routine PET scan acquisition times (15–30 minutes) are likely to capture the net uptake of fluorocholine rather than the unidirectional flux. Hence, efflux and metabolism might dilute the impact of OCT2 expression level. To explore [18F]fluorocholine PET scan in RCC, the accumulation of [18F]fluorocholine in patients with RCC should be carefully monitored in dynamic acquisition studies.
In conclusion, this work shows that the fluorine modification changes choline–OCT2 interaction. Additionally, OCT2 modulation in primary and metastatic RCC may result in abnormal accumulation of [18F]fluorocholine as compared with the surrounding normal tissues. [18F]fluorocholine PET/computed tomography scan might increase the sensitivity for the detection of early-stage metastatic disease, a major clinical challenge during the initial staging of RCC (Thompson et al., 2009).
Acknowledgments
We acknowledge Susanne Dettwiler from the tissue biobank of the University Hospital of Zurich for providing the renal tissue material; Bruno Stieger, University of Zurich, for the critical reading of the manuscript; and Hermann Koepsell, University of Wurzburg, for providing OCT2-HEK293 cells.
Authorship Contributions
Participated in research design: Visentin, Gai, Kullak-Ublick.
Conducted experiments: Visentin, Torozi, Gai, Häusler, Li, Hiller.
Performed data analysis: Visentin, Torozi, Gai, Hiller, Moch.
Wrote or contributed to the writing of the manuscript: Visentin, Schraml, Moch, Kullak-Ublick.
Footnotes
- Received February 26, 2018.
- Accepted May 16, 2018.
This work was supported by the Swiss National Science Foundation [Grant 320030_144193].
The authors have no conflict of interest to declare.
Abbreviations
- ccRCC
- clear cell RCC
- CHO
- Chinese hamster ovary
- OCT
- organic cation transporter
- PBS
- phosphate-buffered saline
- PET
- positron emission tomography
- pRCC
- papillary RCC
- RCC
- renal cell carcinoma
- TMA
- tissue microarray
- WT
- wild-type
- Copyright © 2018 by The American Society for Pharmacology and Experimental Therapeutics


