


Article Figures & Data
Figures
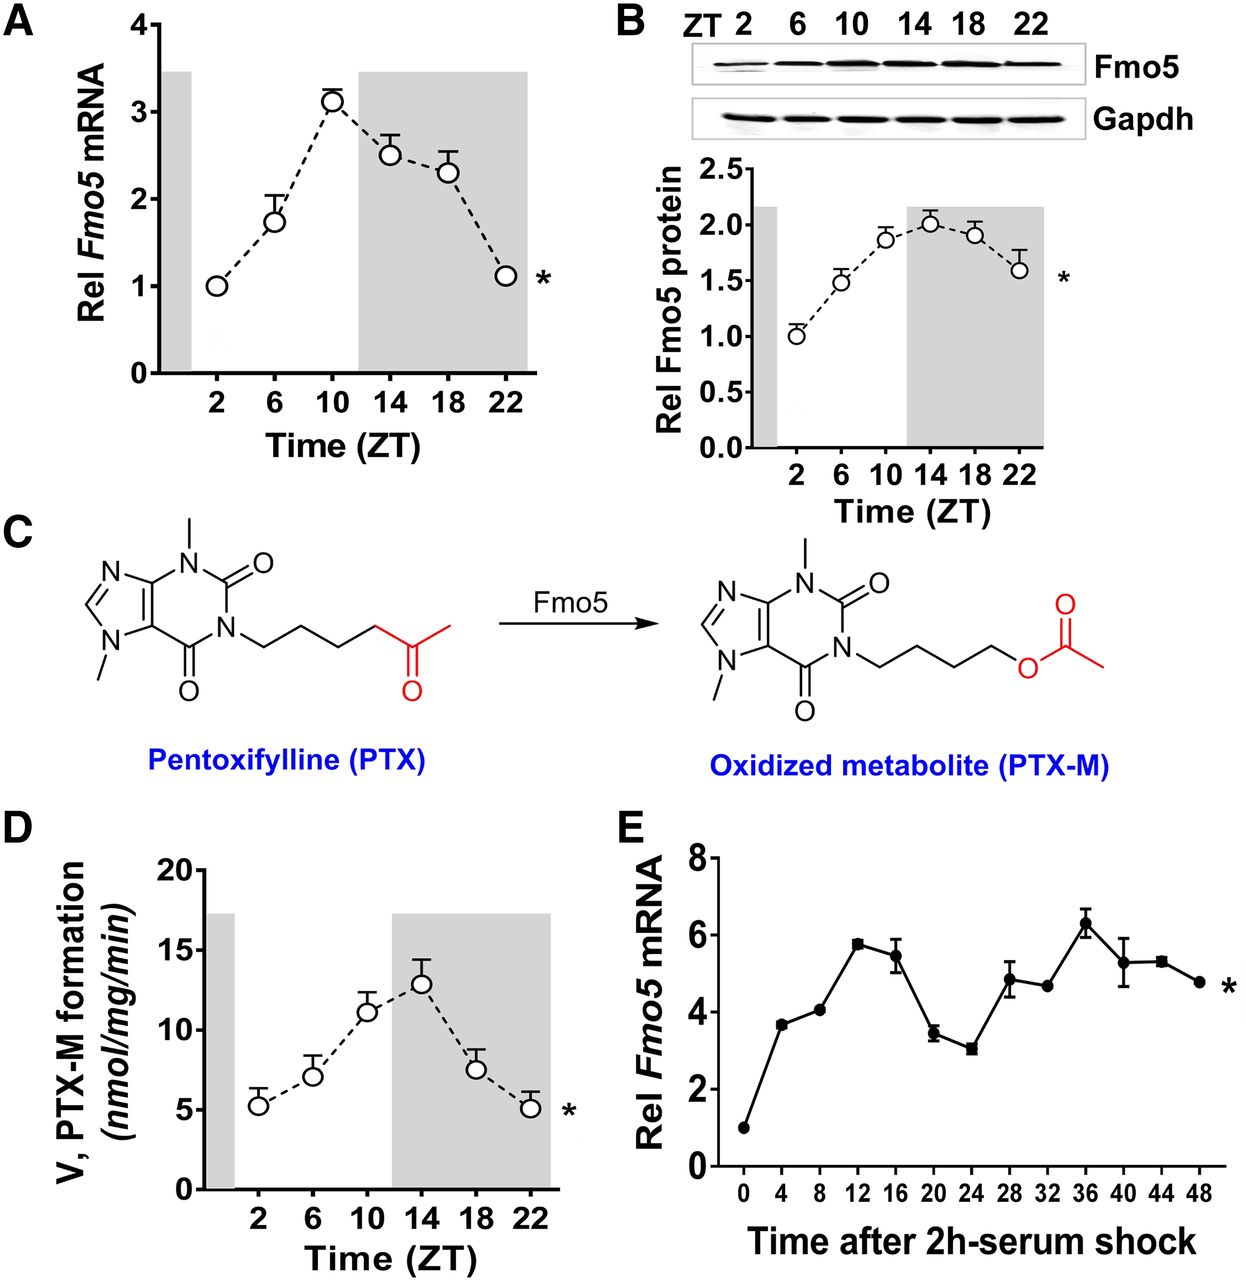
- Fig. 1.
Diurnal rhythm of Fmo5 expression in mouse liver and Hepa1-6 cells. (A) Diurnal rhythm of Fmo5 mRNA in mouse liver. Data are presented as the fold change in Fmo5 expression normalized to Ppib and relative to ZT2. (B) Rhythmic Fmo5 protein expression in mouse liver. Data are presented as the fold change in Fmo5 protein expression normalized to Gapdh and relative to ZT2. (C) Chemical structures of PTX and the Fmo5-generated metabolite PTX-M. (D) Diurnal rhythm of Fmo5 activity in mouse liver microsomes. (E) Temporal mRNA expression of Fmo5 in serum-shocked Hepa1-6 cells. Data are presented as the fold change in Fmo5 expression normalized to Ppib and relative to time 0. Data are mean ± S.D. (n = 5). *P < 0.05 (one-way ANOVA). The dark phase (lights off) is indicated in gray. Rel, Relative.V, metabolic rate.
- Fig. 2.
Dosing time–dependent PTX-M formation from PTX in mice. (A) Plasma PTX concentration-time profile after dosing of PTX (50 mg/kg, i.p.) at ZT2 or ZT14. (B) Liver PTX concentration-time profile after dosing of PTX (50 mg/kg, i.p.) at ZT2 or ZT14. (C) Plasma concentration-time profile of PTX-M after PTX administration (50 mg/kg, i.p.) at ZT2 and ZT14. (D) Liver concentration-time profile of PTX-M after PTX administration (50 mg/kg, i.p.) at ZT2 and ZT14. Data are presented as mean ± S.D. (n = 5). *P < 0.05 vs. ZT2 at individual time points (two-way ANOVA and Bonferroni post-hoc test).
- Fig. 3.
Disrupted rhythms of Fmo5 in Bmal1−/−, Rev-erbα−/−, and E4bp4−/− mice. (A) qPCR analyses of Fmo5 in mouse livers of Bmal1−/−, Rev-erbα−/−, and E4bp4−/− mice and their control littermates. Data are presented as the fold change in Fmo5 expression normalized to Ppib and relative to ZT2 of control littermates. (B) Western blotting analyses of Fmo5 protein in mouse liver of Bmal1−/−, Rev-erbα−/−, E4bp4−/− mice and their control littermates. Data are presented as the fold change in Fmo5 protein expression normalized to Gapdh and relative to ZT2 of control littermates. Data are mean ± S.D. (n = 5). *P < 0.05 between different genotypes at individual time points (two-way ANOVA and Bonferroni post-hoc test). The dark phase (lights off) is indicated in gray. Rel, Relative.
- Fig. 4.
Bmal1 regulates Fmo5 expression in primary mouse hepatocytes and Hepa1-6 cells. (A) Fmo5 mRNA expression in primary mouse hepatocytes transfected with Bmal1 expression plasmid or siBmal1. (B) Bmal1 induces Fmo5 protein expression in primary mouse hepatocytes. (C) Fmo5 mRNA expression in Hepa1-6 cells transfected with Bmal1 expression plasmid or siBmal1. (D) Bmal1 induces Fmo5 protein expression in Hepa1-6 cells. Data are mean ± S.D. (n = 5). *P < 0.05 (t test). Rel, Relative.
- Fig. 5.
E4bp4 and Rev-erbα regulate Fmo5 expression in primary mouse hepatocytes. (A) Effects of E4bp4 overexpression or knockdown on Fmo5 mRNA expression. (B) E4bp4 represses Fmo5 protein expression. (C) Effects of Rev-erbα overexpression or knockdown on Fmo5 mRNA expression. (D) Rev-erbα positively regulates Fmo5 protein expression. (E) Regulatory effects of Rev-erbα on Fmo5 are attenuated in E4bp4-deficient cells. Data are mean ± S.D. (n = 5). *P < 0.05 (t test). Rel, Relative.
- Fig. 6.
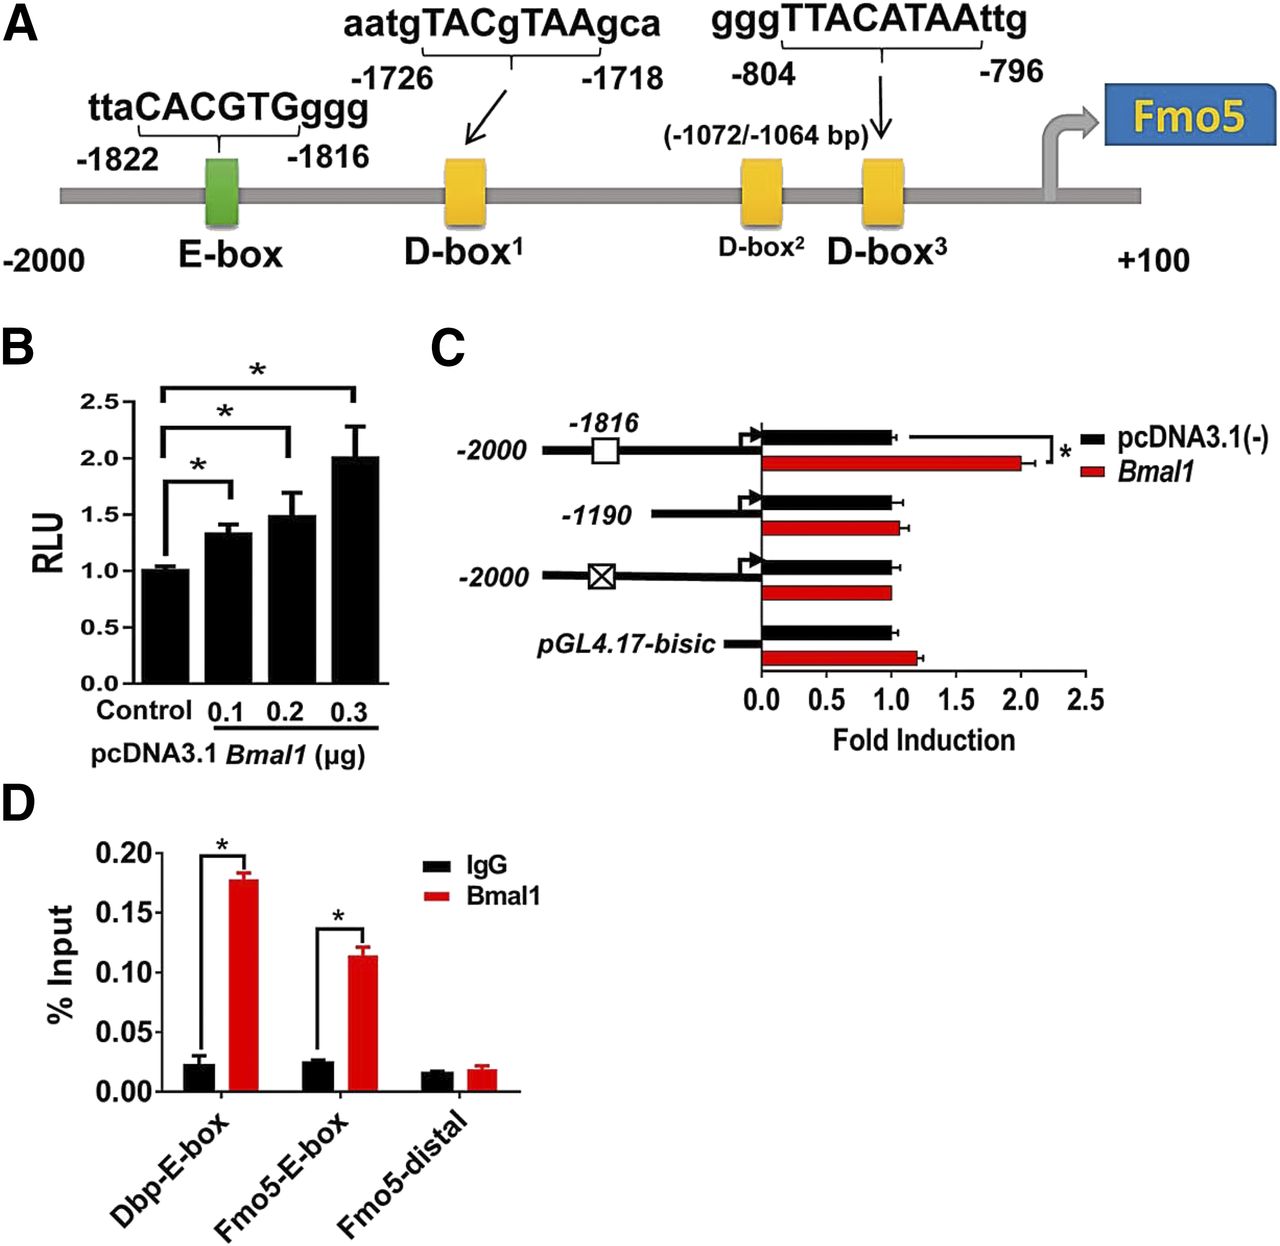
Bmal1 directly regulates Fmo5 expression through binding to an E-box element. (A) Schematic representation of E-box and D-box elements in Fmo5 promoter region. (B) HEK293T cell–based luciferase reporter assays. The cells were transfected with Fmo5-Luc reporter (200 ng) and Bmal1 expression plasmid (100, 200, and 300 ng) or control. (C) HEK293T cell–based luciferase reporter assays. The cells were transfected with truncated or mutated versions of Fmo5 promoter (200 ng) and Bmal1 expression plasmid (300 ng). (D) ChIP assays showing recruitment of Bmal1 protein to Fmo5 promoter (−1822 to −1816 bp region, an E-box element). An E-box of Dbp and a nonspecific (distal) sequence (Table 1) were used as positive and negative controls respectively. Data are mean ± S.D. (n = 5). *P < 0.05 (t test). RLU: relative luciferase unit.
- Fig. 7.
E4bp4 and D-box binding protein (Dbp) directly regulate Fmo5 expression through binding to D-box elements. (A) E4bp4 dose dependently suppresses Fmo5 promoter activity. (B) Effects of E4bp4 on Fmo5-Luc (truncated and mutated versions) reporter activity. (C) ChIP assays showing recruitment of E4bp4 protein to Fmo5 promoter. (D) Dbp dose dependently increases Fmo5 promoter activity. (E) Effects of Dbp on Fmo5-Luc (truncated and mutated versions) reporter activity. (F) ChIP assays showing recruitment of Dbp protein to Fmo5 promoter. A D-box of Per2 and a nonspecific (distal) sequence (Table 1) were used as positive and negative controls respectively. Data are mean ± S.D. (n = 5). *P < 0.05 (t test). RLU: relative luciferase unit.
- Fig. 8.
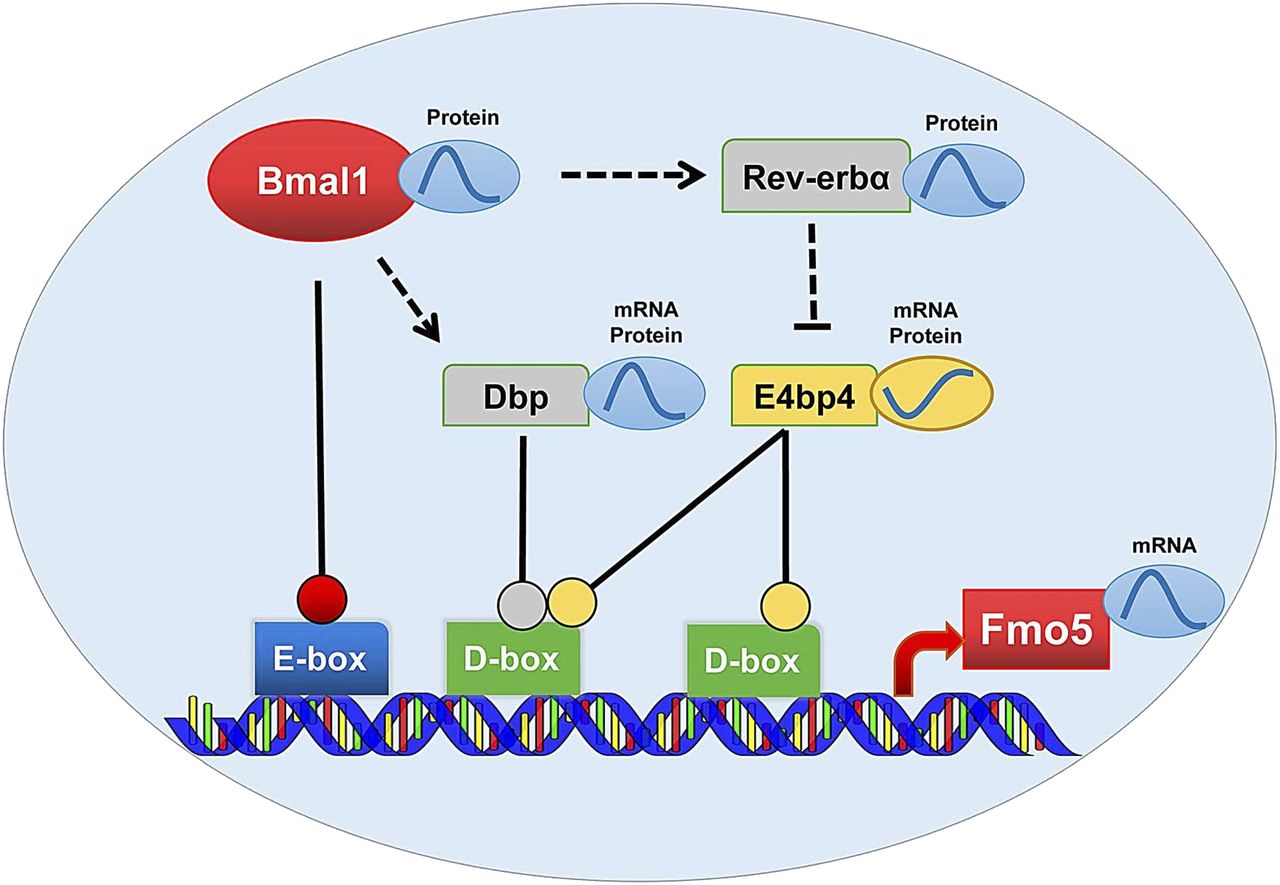
Schematic diagram illustrating the molecular mechanism for generation of rhythmic Fmo5 expression. Fmo5 promoter presents E-box and D-box binding elements for transcriptional actions from circadian clock proteins such as Bmal1, E4bp4 and Dbp. In addition to direct transactivation, the E-box binding protein Bmal1 indirectly regulates the transcription of Fmo5 through Dbp and Rev-erbα/E4bp4 axis. Dashed arrows denote established regulatory pathways in the literature.


Tables
Forward (5′-3′ Sequence) Reverse (5′-3′ Sequence) qPCR Bmal1 CTCCAGGAGGCAAGAAGATTC ATAGTCCAGTGGAAGGAATG Rev-erbα TTTTTCGCCGGAGCATCCAA ATCTCGGCAAGCATCCGTTG E4bp4 CTTTCAGGACTACCAGACATCCAA GATGCAACTTCCGGCTACCA Dbp ACATCTAGGGACACACCCAGTC AAGTCTCATGGCCTGGAATG Fmo5 GAGGGCTTGGAACCTGTCTG CACGGACTGGTAAATACTGGC Ppib TCCACACCCTTTTCCGGTCC CAAAAGGAAGACGACGGAGC ChIP Dbp-E-box TGGGACGCCTGGGTACAC GGGAATGTGCAGCACTGGTT Per2-D-box TTGACGCGGCGAAGCGGTGAGTG GGGACGCAGTGTGAACCTGG Fmo5-E-box TTCCCAATGGTAAGTCCG GTCTTGGCTGAAGGATAG Fmo5-D-box1 TGGCTTCCACTGCTATCC TGAACCCAGGTCTTCTGC Fmo5-D-box3 GCTTGCTTCCTGGGTTGG GGTTCAGTATCTCCCTTCC Fmo5-distal GGTAACCCAACGGCAACT CTCACAGACATTCCCAAA siRNA siBmal1 GCUCUUUCUUCUGUAGAAUTT AAAGAUAUCUUCCCUCGGTT siRev-erbα UUCUCCGAACGUGUCACGUTT ACGUGACACGUUCGGAGAATT siE4bp4 GCACAAGCUUCGAUUAAATT UUUAAUCCGAAGCUUGCTT siNC CGAUUAGUCUAUACGUUCUCCUGAG CUCAGGAGAACGUAUAGACUAAUCG - TABLE 2
Pharmacokinetic parameters derived fromPTX concentration-time profiles
PTX (50 mg/kg, i.p.) was administered to WT mice at ZT2 or ZT14.
Parameter Unit ZT2 ZT14 Liver AUC ng/ml*h 232 ± 35.9 219 ± 24.5 MRT h 0.30 ± 0.04 0.73 ± 0.13* Vss l/kg 0.14 ± 0.05 0.41 ± 0.16 CL l/h per kilogram 0.21 ± 0.03 0.22 ± 0.03 Plasma AUC ng/ml*h 232 ± 40.8 222 ± 26.9 MRT h 0.19 ± 0.01 0.19 ± 0.01 Vss l/kg 0.04 ± 0.01 0.04 ± 0.01 CL l/h per kilogram 0.23 ± 0.04 0.23 ± 0.03 ↵* P < 0.05 vs. ZT2.
- TABLE 3
Pharmacokinetic parameters derived from PTX-M concentration-time profiles
PTX (50 mg/kg, i.p.) was administered to WT mice at ZT2 or ZT14.
Parameter Unit ZT2 ZT14 Liver AUC ng/ml*h 25.4 ± 0.71 54.8 ± 2.5* MRT h 1.62 ± 0.02 0.50 ± 0.03* Vss l/kg 3.75 ± 1.46 0.66 ± 0.08* CL l/h per kilogram 1.48 ± 0.13 1.12 ± 0.23* Plasma AUC ng/ml*h 115 ± 13.0 183 ± 12.1* MRT h 0.43 ± 0.01 0.41 ± 0.01* Vss l/kg 0.26 ± 0.01 0.25 ± 0.05 CL l/h per kilogram 0.32 ± 0.01 0.27 ± 0.01* ↵* P < 0.05 vs. ZT2.
Data Supplement
- Supplemental Data -
Supplementary Methods
Supplementary Figure 1 - Representative extracted ion chromatograms for PTX (a) and PTX-M (b).
Supplementary Figure 2 - Specificity of Fmo5 in generating PTX-M from PTX assessed by incubation of PTX (500 muM) with Fmo-transfected or control cells.
Supplementary Figure 3 - qPCR analyses of hepatic Rev-erbα, E4bp4, and Dbp mRNA levels in Bmal1-/- mice.
Supplementary Figure 4 - Schematic representation of E-box and D-box elements in Fmo1-4 promoter regions.
Supplementary Figure 5 - qPCR analyses of hepatic Fmo5 mRNA levels in Clock-/-mice.
Supplementary Reference
- Supplemental Data -


