


Abstract
The prevalence of cannabis use and the concentrations of the psychoactive cannabinoid in cannabis, (-)-∆9-tetrahydrocannabinol (THC), are rising. Physiologically based pharmacokinetic modeling and simulations (PBPK M&S) can mechanistically predict exposure of THC and its major and active metabolite, 11-hydroxy-THC (11-OH-THC). To build a THC/11-OH-THC PBPK model, mechanistic information about the disposition of these compounds is necessary, including the drug-metabolizing enzymes (DMEs) involved and the fraction metabolized (fm) and metabolic kinetic parameters (intrinsic clearance, maximal formation rate, and Km) via the identified enzymes. We previously identified and quantified the fm of DMEs involved in hepatic depletion of THC and 11-OH-THC. In this study, we extend this work to characterize the enzyme kinetics of THC and 11-OH-THC by monitoring their depletion and formation of some of their metabolites in pooled human liver microsomes. A P450 and UDP-glucuronosyltransferase (UGT) kinetic model was fitted to the concentration–time depletion/formation profiles to establish the contribution and kinetics of the individual DME pathways. CYP2C9 pathway was the major pathway for depletion of THC (fm = 0.91, Km,u = 3 nM) and formation of 11-OH-THC. The remaining THC depletion pathway was attributed to CYP2D6. 11-OH-THC was depleted by UGTs (fm = 0.67 and Km,u = 39 nM), CYP3A4 (fm = 0.18, Km,u = 824 nM), and CYP2C9 (fm = 0.15, Km,u = 33 nM). These mechanistic in vitro data can be used to predict the exposure of THC and 11-OH-THC in healthy and special populations, including in the presence of drug–drug interactions, via PBPK M&S.
Introduction
Cannabis use is increasing in the United States (SAMHSA, 2017). Furthermore, the concentrations of (-)-∆9-tetrahydrocannabinol (THC), the psychoactive component in cannabis, are increasing (ElSohly et al., 2016). This leads to an overall increase in total exposure of THC and its main and psychoactive metabolite, 11-hydroxy-THC (11-OH-THC), in vivo. As such, it is necessary to understand how increased exposure of THC and 11-OH-THC may impact the pharmacokinetics (PK) and potential for drug–drug interactions (DDI) of these cannabinoids, including in special populations. Because conducting THC PK and DDI studies in healthy and special population can be challenging, physiologically based PK modeling and simulation (PBPK M&S) can be used to predict the disposition of THC and 11-OH-THC for various administration routes (e.g., smoking vs. oral administration), in the presence of DDIs or genetic polymorphism. Furthermore, extrapolations can be made from healthy to special populations, such as cancer patients or pregnant women, by adjusting physiologic changes in these populations, such as alterations in drug-metabolizing enzyme (DME) expression.
PBPK M&S requires mechanistic (e.g., identity of DMEs involved) and quantitative information [e.g., intrinsic clearance (CLint) and fraction metabolized (fm) via the enzymes involved] on the disposition of the cannabinoids. We have previously identified the adult hepatic enzymes important in THC and 11-OH-THC disposition and the fm via these enzymes at physiologically relevant concentrations of 500 and 50 nM, respectively (Patilea-Vrana et al., 2019). For successful PBPK M&S of concentrations of THC/11-OH-THC at varying doses of THC, the kinetics [i.e., maximal formation rate (Vmax), Km, CLint] via the relevant DMEs need to be well characterized. The formation of 11-OH-THC (Bornheim et al., 1992; Bland et al,. 2005) and depletion of THC (Benito-Gallo et al., 2016) in human liver microsomes (HLMs) have been previously reported. However, the aforementioned reports did not correct for the extensive nonspecific binding of THC and 11-OH-THC to glassware and plasticware (Garrett and Hunt, 1974). Hence, the reported Km and CLint values may not be reliable (Obach, 1997). Furthermore, previous studies have only looked at total depletion of THC or formation kinetics of 11-OH-THC and do not have mechanistic information on individual enzymatic pathways. Lastly, there is no mechanistic information on the depletion kinetics of 11-OH-THC.
The aims of this study were to determine the enzyme kinetics (Vmax, Km, CLint) of THC and 11-OH-THC using pooled HLMs that are corrected for nonspecific binding of these highly lipophilic drugs [logP of 6.97 and 5.33 for THC and 11-OH-THC, respectively (Thomas et al., 1990)]. Our previous results that identified and quantified the fm of CYP2C9, CYP3A4, and UTG enzymes, the most important DMEs of THC/11-OH-THC, guided our experiments (Patilea-Vrana et al., 2019). We fitted a P450 and UDP-glucuronosyltransferase (UGT) kinetic model to the in vitro concentration–time profiles to estimate the kinetic parameters via specific enzymatic pathways. These kinetic parameters can be used to predict, through PBPK M&S, in vivo exposure to THC/11-OH-THC after consumption of cannabis of varying THC content.
Materials and Methods
Materials
Chemicals and Reagents.
(-)-∆9-THC (1 mg/ml), (±) 11-OH-THC (0.1 mg/ml), and (±) 11-nor-9-carboxy-∆9-THC (COOH-THC) (0.1 mg/ml) DEA-exempt methanol stocks and deuterated internal standards [IS; (-)-∆9-THC-D3, (±) 11-OH-THC-D3, (±) COOH-THC-D3] were purchased from Cerilliant (Round Rock, TX). (-)-∆9-THC (50 mg/ml) was purchased from Cayman Chemicals (Ann Arbor, MI). Micro ultracentrifuge polycarbonate tubes and Dulbecco’s PBS were purchased from Thermo Scientific (Asheville, NC). Low-binding (LB) microcentrifuge tubes (made out of chemical-resistant polypropylene), bovine serum albumin (BSA; fraction V heat–shock treated), acetonitrile, and formic acid (liquid chromatography–mass spectrometry grade) were purchased from Fisher Scientific (Hampton, NH). β-NADP+, D-glucose 6-phosphate, glucose-6-phosphate dehydrogenase, uridine 5′-diphosphoglucuronic acid, itraconazole, and sulfaphenazole were purchased from Sigma-Aldrich (St. Louis, MO). Milli-Q water was used in all preparations. All other chemicals and reagents were obtained at the highest quality available commercially.
Biologic Materials.
Pooled adult HLMs (n = 50, equal mixed gender) were purchased from Corning (Corning, NY). Frozen human plasma from a single healthy donor was purchased from Bloodworks (Seattle, WA).
Cannabinoid HLM Incubations.
For P450-mediated depletion, reaction mixtures (500 μl final volume) in LB tubes contained either 1) 0.010–14.3 μM THC and 0.02 mg/ml HLM or 2) 0.013–60 μM 11-OH-THC and 0.1 mg/ml HLM in 0.1 M potassium phosphate buffer (pH 7.4) containing 0.2% BSA. In a separate set of experiments, 0.02–2 μM THC or 0.5–5 μM 11-OH-THC was incubated in the presence and absence of 10 μM sulfaphenazole (CYP2C9 selective inhibitor) and 2 μM itraconazole (CYP3A selective inhibitor), as described above. The THC and 11-OH-THC concentration range differed in the presence versus absence of inhibitors because the former was limited to the nonlinear concentration range. Reaction mixtures were preincubated at 37°C for 10 minutes in a heated shaking block to allow for protein and nonspecific binding. P450-mediated depletion was initiated with a NADPH-regenerating system (final concentrations: 1.3 mM NADP+, 3.3 mM D-glucose 6-phosphate, 3.3 mM MgCl2, 0.4 U/ml glucose-6-phosphate dehydrogenase). For UGT-mediated depletion, the mixtures contained 0.013–60 μM 11-OH-THC, 0.1 mg/ml HLM, 5 mM MgCl2, and 25 μg/ml alamethicin. Reaction mixtures were incubated for 15 minutes on ice to allow for pore formation and then preincubated, as described above. UGT-mediated depletion was initiated with 2.5 mM uridine 5′-diphosphoglucuronic acid. The incubation period for each cannabinoid concentration was optimized to achieve no more than ∼75% substrate depletion to minimize errors associated with estimation of kinetic parameters (Vmax and Km) when using the substrate depletion approach (Nath and Atkins, 2006). As such, the lowest and highest cannabinoid concentrations had up to 4- and 90-minute incubation periods, respectively. At designated time points, depletion of the cannabinoids was stopped by taking a 50 µl aliquot of the reaction mixture and adding it to 100 µl ice-cold acetonitrile containing the IS (THC-D3, 11-OH-THC-D3, COOH-THC-D3) in LB tubes. Samples were centrifuged for 5 minutes at 10,000g, and the supernatant was removed and placed at −20°C for >1 hour to separate organic and aqueous phases. The top organic layer was added to liquid chromatography glass inserts and stored at −20°C until analysis by LC-MS/MS. Four independent experiments for THC depletion and three independent experiments for 11-OH-THC depletion, each with duplicate determinations, were performed.
Incubation Protein Binding.
Microsomal binding of THC and 11-OH-THC at Cmax concentrations observed after smoking cannabis of contemporary THC content (Hunault et al., 2014) was measured using the tube adsorption method, as previously described (Ishigam et al., 2001; Isoherranen et al., 2004). Briefly, in LB tubes, 500 or 50 nM 11-OH-THC was incubated in either 0.1 M potassium phosphate buffer (group 1) or buffer containing 0.2% BSA and 0.02 or 0.1 mg/ml HLM for THC and 11-OH-THC, respectively (group 2). Mixtures were incubated for 20 minutes at 37°C with shaking to allow for protein and nonspecific binding, and then either 100 μl ice-cold acetonitrile containing IS was added to 50 μl mixture (subgroup A) or 50 μl aliquot of mixture was removed and added to 100 μl ice-cold acetonitrile containing IS (subgroup B). Samples were centrifuged and processed for LC-MS/MS, as described above. We assumed that addition of acetonitrile to the mixture solution desorbs and solubilizes all cannabinoid adsorbed to LB tubes. As such, in group 1 (buffer only) and group 2 (buffer + BSA + HLM), C1A and C2A are the concentration of total unbound cannabinoid in buffer or total bound and unbound cannabinoid in the presence of proteins after desorption from the LB tube surface, respectively. C1B and C2B are the concentration of total unbound cannabinoid in buffer or total bound and unbound cannabinoid in the presence of proteins after adsorption to LB tube surface, respectively. The partition ratio, R, of unbound cannabinoid in buffer to LB surface wall was calculated using eq. 1. (1)The unbound concentration of cannabinoid in incubation mixtures containing protein [fraction unbound in HLM incubation (fuinc)] was calculated using eq. 2.
 (2)Four independent experiments with four to six replicates per group were performed.
Plasma Protein Binding.
Although attempts were made to measure the plasma protein binding of THC and 11-OH-THC using the tube adsorption method, their high plasma protein binding made it difficult to quantify the fraction adsorbed to the LB tubes in the presence of plasma proteins. Therefore, as an alternative, ultracentrifugation was used to measure THC and 11-OH-THC plasma protein binding. Diluted plasma (10-fold dilution with Dulbecco’s PBS) was incubated with 500 nM THC or 50 nM 11-OH-THC in ultracentrifugation tubes (150 μl final volume) for 20 minutes at 37°C with shaking to allow for protein and nonspecific binding. Samples were centrifuged using Sorval Discovery M150 SE centrifuge and S100-AT3 rotor (Thermo Scientific) at 435,000g for 90 minutes at 37°C. The middle aqueous layer was sampled to obtain the unbound cannabinoid concentration. The total bound and unbound cannabinoid concentration was sampled from control incubations that were incubated similarly but not centrifuged. Since both control and centrifuged samples were processed similarly (except for the ultracentrifugation step), we assumed the same degree of nonspecific binding to tubes for both samples. The fraction unbound in plasma (fup) was extrapolated using eq. 3 (Schuhmacher et al., 2000), where fud is the fraction unbound in diluted plasma and plasma DF is the dilution factor of 0.1.
 (3)
(3)LC-MS/MS Analysis.
Acquity ultra-performance liquid chromatography BEH C18 column (1.7 μM 2.1 × 50 mm) attached to C18 × 2-mm guard column was used for chromatographic separation. Samples were analyzed with Acquity ultra-performance liquid chromatography system (Waters, Milford, MA) coupled to an AB Sciex Triple Quad 6500 (SCIEX, Framingham, MA). Acetonitrile or water containing 0.1% formic acid was used as organic and aqueous mobile phases, respectively. Liquid chromatography flow gradient and multiple reaction monitoring parameters used were as previously described (Patilea-Vrana et al., 2019). Integration of the chromatographic peaks was performed using Analyst v1.6 (Framingham, MA).
Data Analyses Using Substrate Depletion and Metabolite Formation Approach.
The depletion rate constant, kdep, at different concentrations of THC and 11-OH-THC, was obtained by fitting a monoexponential decay curve (eq. 4) to the THC or 11-OH-THC concentration–time curves, where Ct is the substrate concentration at a given timepoint (t) and C0 is the substrate concentration at t = 0. (4)Using the substrate depletion approach (Nath and Atkins, 2006), kdep([S] →0), the depletion rate constant at infinitesimal substrate concentrations, and Km, the Michaelis–Menten constant, were obtained by fitting eq. 5 to kdep versus THC or 11-OH-THC concentrations [S]. Vmax, the maximal reaction rate, was obtained using eq. 6 where [HLM] is the HLM concentration in milligram per milliliters.
 (5)
(5) (6)Formation kinetic parameters (Vmax and Km) of 11-OH-THC were obtained by fitting the Michaelis–Menten relationship (eq. 7) to the 11-OH-THC formation rate (V) versus THC concentration [S].
 (7)A substrate inhibition model was used to fit COOH-THC formation rate (V) versus 11-OH-THC concentration [S], as shown in eq. 8.
 (8)The total depletion or formation CLint was calculated using eq. 9.
 (9)Data were analyzed using GraphPad Prism 7 (La Jolla, CA).
Modeling of In Vitro Data.
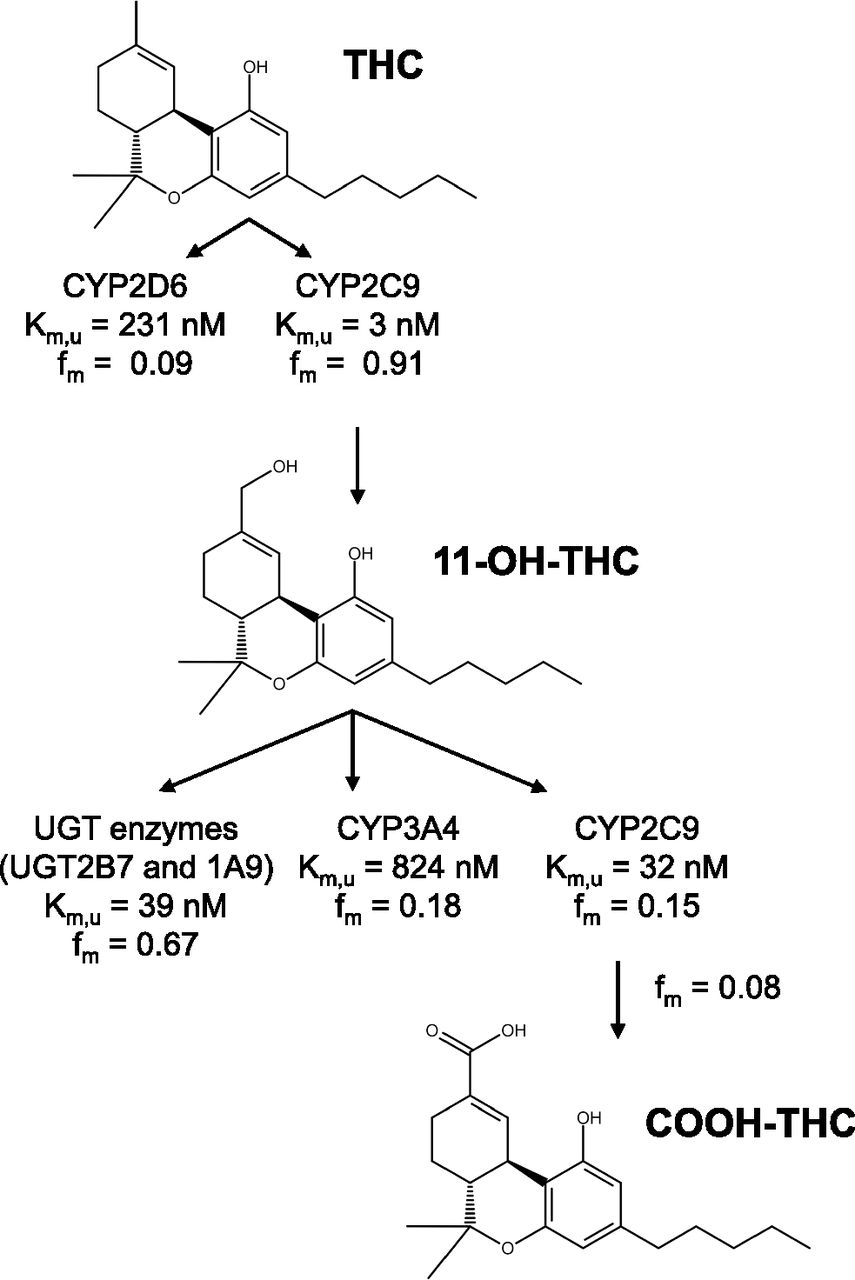
A P450 kinetic model was built to estimate the P450-mediated kinetics of THC, 11-OH-THC, and COOH-THC, and a UGT kinetic model was built to estimate the UGT-mediated depletion of 11-OH-THC. We previously showed that CYP2C9 and CYP2D6 deplete THC with fm of 0.82 ± 0.08 and 0.17 ± 0.15, respectively, and CYP2C9 forms 11-OH-THC with fm = 0.99 ± 0.10. CYP2C9, CYP3A4, and UGTs (UGT1A9 and UGT2B7) deplete 11-OH-THC with fm of 0.09 ± 0.05, 0.20 ± 0.08, and 0.60 ± 0.05, respectively (Patilea-Vrana et al., 2019). Using the previous data as a guide, the P450 kinetic model was set up as follows: the biotransformation of THC to 11-OH-THC was assigned to CYP2C9 with the remaining THC depletion pathway assigned to CYP2D6. The biotransformation of 11-OH-THC to COOH-THC was assigned to CYP2C9 with two additional 11-OH-THC depletion pathways mediated by CYP2C9 and CYP3A4. We assumed that COOH-THC formation and the additional 11-OH-THC CYP2C9 depletion pathway had the same Km value. Additionally, based on our previous observations, we assumed COOH-THC was not depleted in the HLM system. Although we tested the activity of aldehyde dehydrogenase (ALDH) enzymes to turn over 11-OH-THC in cytosolic and S9 fractions, we saw minimal depletion (data not shown), and, as such, restricted the 11-OH-THC depletion model to P450 and UGT enzymes only.
We chose selective inhibitors of CYP2C9 (sulfaphenazole) and CYP3A (itraconazole) to elucidate the fm and enzyme kinetic parameters (CLint, Km, Vmax) via each pathway. Because these inhibitors are not entirely selective, their previously determined inhibition of CYP2C9, CYP3A4, and CYP2D6 (Patilea-Vrana et al., 2019) was incorporated into the P450 kinetic model. We assumed both sulfaphenazole and itraconazole were competitive inhibitors of the P450 enzymes. The UGT kinetic model was not split into specific pathways because we previously were unable to establish UGT1A9 and UGT2B7 fm with confidence due to poor selectivity of UGT inhibitors.
A P450 or UGT kinetic model was fitted to the in vitro concentration–time profiles of THC and 11-OH-THC in the presence and absence of sulfaphenazole and itraconazole. The P450 kinetic model was fitted to COOH-THC concentration–time profile only in the absence of inhibitors because we did not thoroughly establish the identity and fm of DMEs responsible for COOH-THC formation, as done for 11-OH-THC. Because CYP2C9*3/*3 subjects had a 3.2-fold lower COOH-THC area under the curve (AUC)(0-inf) compared with wild-type subjects with no significant change in 11-OH-THC AUC (Sachse-Seeboth et al., 2009), we attributed biotransformation of COOH-THC to CYP2C9 pathway. We used a naive pooled approach implemented in Phoenix 8.1, Certara (Princeton, NJ) to model the in vitro data because the biologic source in all experiments was the same pool of HLMs. The general ordinary differential equations are shown below (eq. 10–14), where INHP450 enzyme represents the fractional inhibition of enzyme activity by sulfaphenazole and itraconazole, as previously measured using P450 enzyme probes (Patilea-Vrana et al., 2019). The governing ordinary differential equations are further explained in the Supplemental Material.
 (10)
(10) (11)
(11) (12)
(12) (13)
(13) (14)
(14)Because THC and 11-OH-THC incubations used different HLM concentrations (0.02 and 0.1 mg/ml, respectively), VTHC and V11-OH-THC were normalized by HLM concentration used, namely 0.05 and 0.01 l/mg, respectively. The normalized volume (l/mg) was multiplied by the starting cannabinoid concentrations (μM) to derive the respective cannabinoid incubation dose (in micromoles per milligram). For the P450 kinetic model, the datasets of when THC was dosed (THC depletion and 11-OH-THC formation concentration–time profiles) were simultaneously fitted with the datasets of when 11-OH-THC was dosed (11-OH-THC depletion and COOH-THC formation concentration–time profiles). This simultaneous fitting approach allowed for parameter estimation of 11-OH-THC formation and depletion kinetic parameters. When fitting the models to the data, the kinetic parameters from Table 2 were used as initial estimates (obtained as described under the preceding section). Various structural and error models were tested. Model performance was tested via goodness-of-fit and residual plots. Model validation was performed using Montel–Carlo simulations utilizing the final P450 kinetic model and an independent dataset not used during model development.
Results
Nonspecific, HLM Incubation, and Plasma Protein Binding of THC and 11-OH-THC.
Both THC (500 nM) and 11-OH-THC (50 nM) had high degree of nonspecific binding (>86%) to the LB tubes. Furthermore, both THC and 11-OH-THC were highly bound to proteins (HLM and BSA) (>96%) in the incubations (Table 1). THC nonspecific and protein binding was higher than that of 11-OH-THC. The fraction of THC and 11-OH-THC unbound in plasma (fup) was similar but lower than the cannabinoids’ corresponding fuinc (Table 1).
Nonspecific, HLM incubation, and plasma protein binding of THC and 11-OH-THC
Data shown are mean ± S.D. of three independent experiments with four to six replicates per experiment.
Estimates of THC, 11-OH-THC, and COOH-THC Depletion and Formation Kinetics Using Substrate Depletion and Metabolite Formation Approach.
The substrate depletion approach (eq. 5) was used to estimate depletion kinetics of THC and 11-OH-THC in pooled HLMs (Fig. 1, A and C). The metabolite formation approach (eq. 7 and 8) was used to estimate the formation kinetics of 11-OH-THC and COOH-THC in pooled HLMs (Fig. 1, B and D). In the absence of inhibitors, kinetic parameters are representative of aggregated enzyme kinetics (Table 2). Inhibitors of CYP2C9 (sulfaphenazole) and CYP3A4 (itraconazole) were used to distinguish between enzymatic pathways (Table 2).

Representative kinetic profiles of (A) THC depletion, (B) 11-OH-THC formation, (C) 11-OH-THC depletion by UGT and P450 enzymes, and (D) COOH-THC formation in pooled HLMs from one (of three to four) independent experiment, each with duplicate determinations. Depletion rate constant (kdep) and formation rate (V) were obtained from cannabinoid concentration–time profiles (see Supplemental Fig. 1 for representative profiles). Substrate depletion (eq. 5) and metabolite formation (eq. 7) were used to determine kinetic parameters (Vmax and Km). A substrate inhibition model (eq. 8) was used to model COOH-THC formation kinetics. Kinetic parameters estimated from these data were used as initial estimates for the subsequent modeling of cannabinoid depletion and formation kinetics using the P450 and UGT kinetics models shown in Fig. 3.
Kinetic parameters quantified using the substrate depletion and metabolite formation approach in pooled HLMs
Data shown are mean ± S.D. of three to four independent experiments with duplicate determinations per experiment. Error propagation was applied to the S.D. of Km,u and CLint using  where
where  ±
±  and
and  ±
±  represents the mean ± S.D. of fuinc and Km or CLint,u, respectively. The values shown here were used as initial estimates for the P450 and UGT kinetic model (Fig. 3).
Although Km,u of THC depletion and 11-OH-THC formation were similar (7 ± 5 nM and 8 ± 3 nM, respectively), the THC depletion Vmax was ∼4-fold larger than Vmax for the formation of 11-OH-THC (Table 2). Based on the mean CLint values, 26% ± 11% of THC was metabolized to 11-OH-THC (Fig. 1, A and B; Table 2). Formation of COOH-THC was not detected in the aforementioned experiments. Per average, THC depletion and 11-OH-THC formation CLint decreased 88% ± 5% and 92% ± 3% in the presence of sulfaphenazole, respectively (Fig. 2, A and B; Table 2).
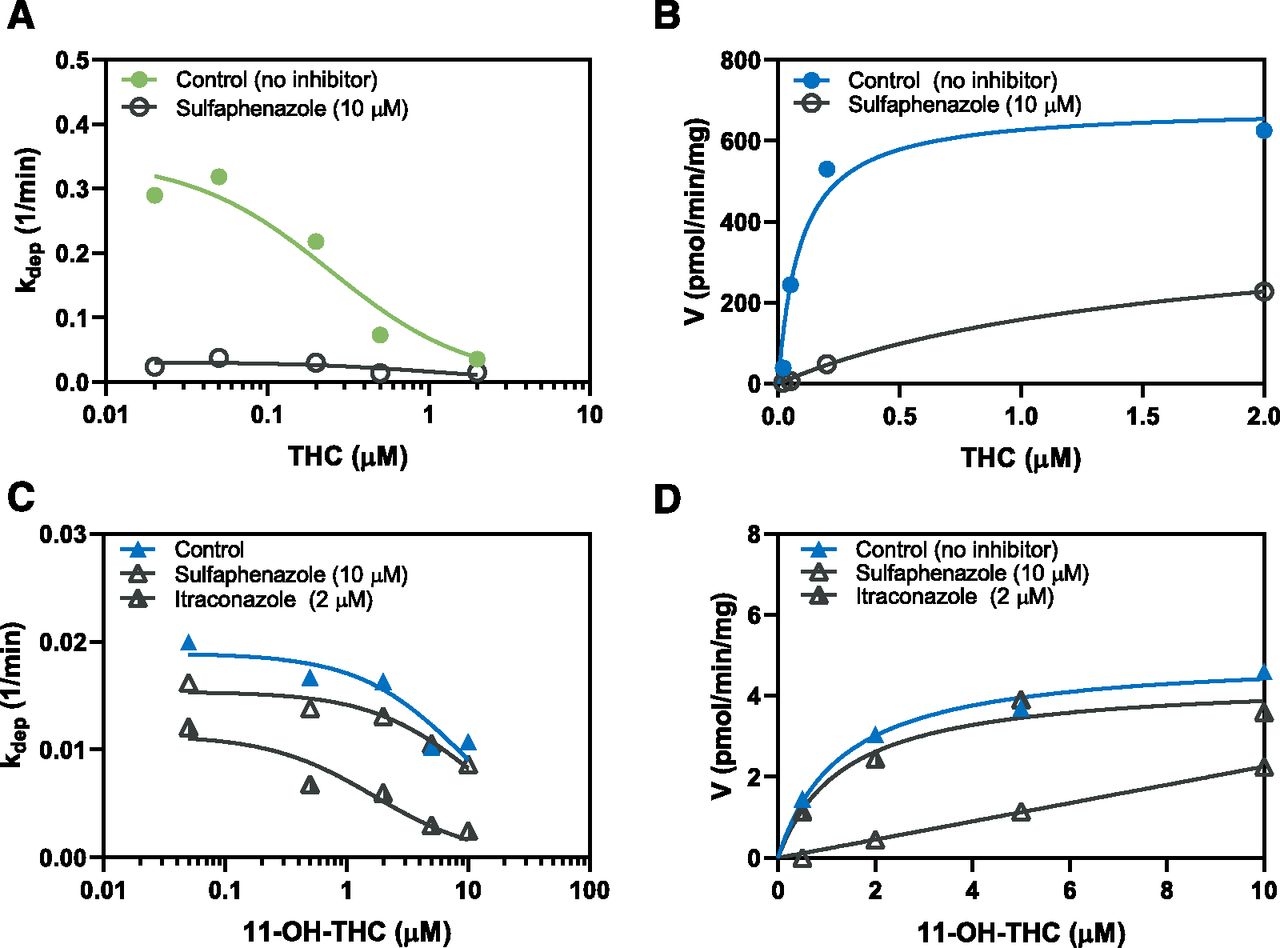
Representative kinetic profiles of (A) THC depletion, (B) 11-OH-THC formation, (C) 11-OH-THC depletion by P450 enzymes, and (D) COOH-THC formation in the presence and absence of sulfaphenazole (CYP2C9 inhibitor) and itraconazole (CYP3A inhibitor) from one (of three) independent experiment, each with duplicate determinations. Inhibition studies were performed over a range of cannabinoid concentrations that spanned the nonlinear kinetic range (see Fig. 1). Substrate depletion (eq. 5) and metabolite formation (eq. 7) were used to determine kinetic parameters (Vmax and Km). Representative concentration–time curves are shown in Supplemental Fig. 2.
UGT enzymes had a higher Km but lower Vmax compared with the P450 enzymes for 11-OH-THC depletion (Fig. 1C; Table 2). Furthermore, in the absence on inhibitors, the CLint of UGT enzymes was ∼2-fold larger than CLint of P450 enzymes (Table 2). Substrate inhibition (estimated by Ki) of COOH-THC formation was observed at >10 μM 11-OH-THC concentrations (Fig. 1D). Based on the mean CLint values, COOH-THC formation accounted for 2% ± 0% of P450-mediated depletion of 11-OH-THC (Table 2). Per average, 11-OH-THC P450 depletion CLint decreased 34% ± 7% and 53% ± 5% in the presence of sulfaphenazole and itraconazole, respectively (Fig. 2C). Per average, COOH-THC formation CLint decreased 93% ± 3% in the presence of sulfaphenazole but was not affected by itraconazole (Fig. 2D; Table 2).
Quantifying Enzyme Kinetics of THC and 11-OH-THC Using the P450 and UGT Kinetic Models.
There were several problems with the kinetic parameters estimated via the conventional substrate depletion and metabolite formation approach described in the previous section. First, the THC concentration–time profiles in Supplemental Fig. 1A show nonlinear depletion, likely due to saturation of CYP2C9. Fitting the THC concentration–time profiles with a monoexponential decay curve did not account for this nonlinearity. Furthermore, based on CLint value in Table 2, the formation of 11-OH-THC accounted only for 26% ± 11% of total THC depletion. Because 11-OH-THC is the major metabolite of THC (Agurell et al., 1986), the conventional substrate depletion approach did not estimate THC depletion CLint with confidence. Second, our published phenotyping data demonstrate that multiple DMEs are involved in the disposition of these cannabinoids. That is, the depletion kinetics of THC and 11-OH-THC in Table 2 represent aggregated kinetics of multiple enzymatic pathways and multiple metabolites formed. To tease out the metabolic kinetics via specific enzymatic pathways, we formulated the P450 and UGT kinetic models (Fig. 3) using our previous data on the identity and fm of the DMEs responsible for the disposition of THC and 11-OH-THC (Patilea-Vrana et al., 2019). We used the data from Table 2 as initial estimates in the kinetic P450 and UGT kinetic models. Even though there was evidence of COOH-THC substrate inhibition (Fig. 1D; Table 2), including COOH-THC substrate inhibition in the P450 model (Fig. 3) did not have a significant decrease in -2LL or AIC values (data not shown). Therefore, COOH-THC formation was modeled without substrate inhibition. Because the identity and fm of DMEs responsible for COOH-THC formation are not relevant to the depletion kinetics of THC and 11-OH-THC, they were not characterized. Thus, only the formation of COOH-THC in the absence of inhibitors was modeled. The absence of COOH-THC concentration–time data did not affect 11-OH-THC parameter estimation in the presence of inhibitors because formation of COOH-THC accounted for only a small percentage of 11-OH-THC depletion (data not shown).

The (A) P450 kinetic model was developed to account for individual P450 pathways using previous data that identified the enzymes and their respective fm values that are relevant to THC and 11-OH-THC disposition in pooled HLMs (Patilea-Vrana et al., 2019). (B) The UGT kinetic model was not split up to account for individual UGT pathways due to lack of selective UGT inhibitors (Patilea-Vrana et al., 2019). The P450 and UGT kinetic models were fitted to the concentration–time profiles of THC, 11-OH-THC, and COOH-THC after incubation with either THC (green arrow) or 11-OH-THC (blue arrow) in the absence or presence of sulfaphenazole (SLF, CYP2C9 inhibitor) and itraconazole (ITZ, CYP3A inhibitor). Kinetic models were fit to data from three to four independent experiments. Kinetic parameters from Table 2 were used as initial estimates. Description of the governing ordinary differential equations can be found in the Supplemental Material.
Goodness-of-fit plots of the P450 and UGT kinetic models show good fit to the observed concentration–time profiles of THC depletion, 11-OH-THC formation/depletion, and COOH-THC formation (Fig. 4). Furthermore, the observed versus predicted concentrations closely follow the line of unity (Supplemental Fig. 3).

Observed (markers) and model prediction (lines) of THC concentration–time profiles in the (A) absence and (B) presence of sulfaphenazole, 11-OH-THC formation in the (C) absence, and (D) presence of sulfaphenazole, 11-OH-THC depletion by P450 enzymes in the (E) absence and presence of (F) sulfaphenazole and (G) itraconazole, (H) 11-OH-THC depletion by UGT enzymes, and (I) COOH-THC formation in the absence of inhibitors. Additional goodness-of-fit graphs are shown in Supplemental Fig. 3.
The final parameter estimates and CV% of the estimates from the P450 and UGT kinetic models are summarized in Fig. 5 and Table 3. Final fm estimates using the CLint estimates from the P450 and UGT kinetic models are summarized in Table 4. The overall THC depletion CLint was 236 ml/min per milligram with 11-OH-THC formation (CLint = 214 ml/min per milligram) by CYP2C9, accounting for 91% of THC depletion. CYP2D6 mediated the remaining 9% of THC depletion. THC Km,u for CYP2C9 was 79-fold larger than that for CYP2D6. The final CLint parameter estimates for THC depletion and 11-OH-THC formation are ∼2-fold smaller and larger, respectively, when compared with the kinetic parameters estimated using substrate depletion and metabolite formation approach in Table 2.

Enzymatic pathways and kinetics of THC, 11-OH-THC, and COOH-THC in HLMs.
Kinetic parameters estimate and CV% using the P450 and UGT kinetic models
The P450 and UGT kinetic models were fitted to data from three to four independent experiments (see Materials and Methods and Fig. 3). Kinetic parameters shown in Table 2 were used as initial estimates. Data shown are parameter estimate and the confidence in these estimates (CV%). Km,u and CLint parameter estimates and CV% were corrected for incubation binding using fuinc.
Fractional metabolism (fm) estimated using the P450 and UGT kinetic models
The fm values were calculated using CLint values (see Table 3). Data shown are parameter estimates and CV% of the estimates.
The overall 11-OH-THC depletion CLint was 12.9 ml/min per milligram. P450 and UGT enzymes accounted for 23% and 67% of total 11-OH-THC depletion CLint, respectively. 11-OH-THC Km,u for CYP2C9 was lower than that for CYP3A4 (33 nM vs. 824 nM). Nevertheless, due to the difference in Vmax value of the enzymes, CYP2C9 and CYP3A4 contribution to the total P450-mediated 11-OH-THC depletion was 45% and 55%, respectively. COOH-THC formation accounted for 4% of overall 11-OH-THC P450-mediated depletion. The final CLint parameter estimates for 11-OH-THC depletion are comparable to the kinetic parameters estimated using substrate depletion and metabolite formation approach in Table 2.
The P450 kinetic model was validated using an independent data set and Monte–Carlo simulations (Supplemental Fig. 4). Using the final P450 kinetic model parameter and associated error (e.g., CV%) estimates, 10 individual Monte–Carlo simulations of THC and 11-OH-THC concentration–time profiles were generated and compared with observed data from an independent incubation of 500 nM THC with HLMs. Model performance was assessed by comparing the Monte–Carlo simulated concentration–time profiles with the observed THC and 11-OH-THC profiles. The simulations were in good agreement with the observed data (Supplemental Fig. 4).
Discussion
We previously identified that CYP2C9 is the most relevant P450 enzyme to the depletion and formation of THC and 11-OH-THC, respectively, whereas UGT enzymes, CYP3A4, and CYP2C9 are the most relevant DMEs to the depletion of 11-OH-THC (Patilea-Vrana et al., 2019). However, we previously determined cannabinoid fm values using maximum plasma concentrations (Cmax) observed after smoking cannabis, i.e., 500 nM THC and 50 nM 11-OH-THC (Hunault et al., 2014). Because THC concentrations quickly decline after inhalation Cmax has been reached, it is necessary to elucidate the enzyme kinetics that drive cannabinoid disposition at various concentrations. In this study, we extend our previous work and provide kinetic parameter estimates (Vmax, Km, CLint) of the relevant enzymatic pathways responsible for THC and 11-OH-THC disposition. These parameters, in addition to estimates of plasma protein binding (fup), provide the hepatic metabolism parameters necessary to eventually predict cannabinoid exposure in healthy and special populations via PBPK M&S.
We quantified the metabolic kinetics of THC and 11-OH-THC using the substrate depletion and metabolite formation approach in pooled HLMs (Table 2). However, the depletion approach cannot account for nonlinearity in the concentration–time profile when fitting the data using a monoexponential decay curve (conventional practice) nor can the metabolite formation approach account for subsequent metabolite depletion. Furthermore, because THC and 11-OH-THC are metabolized by multiple enzymes, the metabolic kinetics are representative of total, or aggregated, enzyme kinetics. To accurately estimate the relevant kinetic parameters, we fitted a sequential P450 and UGT kinetic model simultaneously to THC depletion, 11-OH-THC formation, and 11-OH-THC depletion concentration–time profiles using a naive pooled approach. The modeling approach improved parameter estimate by accounting for the aforementioned limitations. For example, based off CLint values in Table 2, 11-OH-THC formation accounted for 26% ± 11% of THC depletion; however, CLint estimates using the P450 model in Table 3 estimate that 91% of THC is metabolized to 11-OH-THC. Indeed, previous studies have shown 11-OH-THC is the major metabolite of THC (Agurell et al., 1986), and furthermore, at THC concentrations less than Km, 11-OH-THC formation accounted for majority of THC depletion (Supplemental Fig. 1). Lastly, previously established cross-inhibition of sulfaphenazole and itraconazole was incorporated into the P450 kinetic model, thus improving the accuracy of the estimated enzyme kinetic parameters.
The microsomal protein binding of drugs in HLM incubations is an important parameter for correctly estimating the vitro Km and CLint and therefore accurate prediction of in vivo hepatic clearance of THC/11-OH-THC (Obach, 1997). THC and 11-OH-THC are lipophilic compounds with logP of 6.97 and 5.33, respectively (Thomas et al., 1990), and, as such, have high microsomal protein and nonspecific binding. In the absence of microsomal proteins, THC and 11-OH-THC were extensively (>86%) bound to the LB tubes (Table 1). Indeed, others have also reported that polycarbonate and polypropylene containers show extensive nonspecific THC binding (up to 80%) (Garrett and Hunt, 1974). Silanized glass can reduce nonspecific binding of drugs; however, we found that the THC depletion kinetics were comparable between silanized glass and LB tubes (data not shown). Therefore, due to ease of use, we adopted to use the LB tubes for all subsequent studies. In our studies, THC and 11-OH-THC fuinc were 0.040 ± 0.015 and 0.061 ± 0.025, respectively (Table 1). This binding was dependent on BSA concentrations when tested between 0.02% and 2% BSA, but independent of the microsomal concentration (0.02 and 0.1 mg/ml) when 0.2% BSA was included (data not shown). Lastly, we measured plasma protein binding at a single concentration of THC (500 nM) and 11-OH-THC (50 nM) because a previous study reported that this binding is similar across THC concentrations spanning 0.00318–3.18 μM (Garrett and Hunt, 1974).
Formation of 11-OH-THC by CYP2C9 (fm = 0.91) accounted for the majority of THC depletion, whereas the remaining depletion pathway (fm = 0.09) was attributed to CYP2D6 (Table 4). This is consistent with our previous in vitro results (Patilea-Vrana et al., 2019) as well as PK studies in CYP2C9 polymorphic subjects (Sachse-Seeboth et al., 2009). It should be noted that in our previous study, we also saw metabolism of THC by recombinant CYP1A1/2, 2C19, 3A4/5, but the contributions via these enzymes were not significant in HLMs at 500 nM THC (Patilea-Vrana et al., 2019). Metabolites from the minor THC depletion pathway can be due to hydroxylation of THC at the C8 position on the alicyclic ring that forms 8α/β-OH-THC or positions of the pentyl chain (Bornheim et al., 1992; Watanabe et al., 2007; Dinis-Oliveira, 2016). The total (aggregated) THC depletion CLint was 236 ml/min per milligram (Table 4). The depletion Km and CLint of THC in HLMs has been reported to be 3.76 μM and 2.24 ml/min per milligram (tested at 1–10 μM THC), respectively, by Benito-Gallo et al. (2016). The presence of BSA in our study, which led to THC fuinc of 0.04, is much smaller than the predicted fuinc by Benito-Gallo et al (2016) of 0.51, and, as such, differences in protein binding may contribute to the difference in CLint. The reason for the difference in the CLint estimate is unknown. Formation kinetics of 11-OH-THC were Km,u = 3 nM and CLint = 214 ml/min per milligram (Table 3). Bland et al. found that 11-OH-THC formation from THC had an apparent Km of 0.8 μM (tested at 0.25–20 μM THC); however, we cannot compare this value with the Km,u reported in this work (3 nM) because fuinc was not reported in the aforementioned study.
In this work, we provide the first report of 11-OH-THC depletion kinetic estimates. Similar to our previous report, UGT enzymes (fm = 0.67) have a higher contribution to 11-OH-THC depletion compared with P450 enzymes (fm = 0.23). The Km,u of CYP2C9 for 11-OH-THC is higher than that for CYP3A4 (33 nM vs. 824 nM), but the reverse is true for CLint (CLint of 2.2 vs. 1.7 ml/min per milligram), indicating both enzymes will likely play a significant role in the clearance of 11-OH-THC. This conclusion is consistent with two studies. In the first, after oral administration of THC, 11-OH-THC plasma AUC(0-inf) did not change in CYP2C9*3/*3 subjects even though THC plasma AUC(0-inf) increased 3-fold, thus indicating that CYP2C9 impacts both the formation and depletion of 11-OH-THC. In the second, 11-OH-THC plasma AUC(0-inf) increased 1.84-fold when Sativex, an oromucosal spray containing equal part THC and cannabidiol, was coadministered with ketoconazole, a CYP3A inhibitor. COOH-THC accounted for 4% of total 11-OH-THC depletion. Other metabolites, such as 8β-11-di-OH-THC, may have been formed (Dinis-Oliveira, 2016). Indeed, when 11-OH-THC is administered i.v., 80% of the total radiolabeled dose is excreted in feces, mainly as unchanged 11-OH-THC and 8β-11-di-OH-THC (Lemberger et al., 1972).
The measured THC and 11-OH-THC fup (Table 1) using ultracentrifugation is consistent with previous reports of THC and 11-OH-THC plasma protein binding of <0.01–0.03 (Garrett and Hunt, 1974; Widman et al., 1974; Fanali et al., 2011; Benito-Gallo et al., 2016). Adjusting the Cmax of THC and 11-OH-THC after inhalation or oral administration of cannabis by the fup (Table 1), the THC and 11-OH-THC unbound Cmax can reach 8 and 1 nM, and 2 and 0.2 nM for inhalation and oral administration, respectively (Hunault et al., 2008; Lile et al., 2013). This suggests that 11-OH-THC formation may be saturated during smoking but not oral administration because the THC unbound plasma concentration is larger than CYP2C9 Km,u of 3 nM after smoking, but not oral administration of THC. However, the observed data on the PK of THC are contradictory. THC and 11-OH-THC Cmax and AUC0–8h did not increase with dose when cannabis cigarettes containing 9.8%, 16.4%, and 23.1% (weight/weight) THC were smoked (Hunault et al., 2008). But, in a similar study design completed by the same group, the THC Cmax values increased in proportion with dose (Hunault et al., 2014). After i.v. or smoking of THC, the plasma concentration of THC declined extremely rapidly with a half-life of 2.8 minutes (Hunt and Jones, 1980). Thus, for an unbound THC Cmax of 8 nM, it would take less than 6 minutes for the unbound THC plasma concentration to drop to <3 nM, the Km,u for the formation of 11-OH-THC. Thus, it is not surprising that it would be difficult to observe nonlinear PK of THC in vivo.
The PK parameters generated to date (fm, CLint, Vmax, Km, fup) can be used to predict THC and 11-OH-THC exposure in healthy and special populations via PBPK modeling and simulation. In healthy populations, a THC/11-OH-THC PBPK model can be used to predict DDIs or impact of genetic polymorphism. For example, a case report observed a THC–warfarin (CYP2C9 substrate) interaction that is likely due to CYP2C9 DDI (Yamreudeewong et al., 2009). By adjusting for physiologic changes, extrapolations can be made to special populations. For example, the expression of relevant DMEs to THC and 11-OH-THC disposition decreases in cancer patients (Morgan et al., 2008) and patients with renal and hepatic impairment (Elbekai et al., 2004; Dreisbach and Lertora, 2008), but increases during pregnancy (Anderson, 2005).
In summary, we report the in vitro enzyme kinetics of THC and 11-OH-THC (Fig. 5; Table 3). THC is mainly metabolized to 11-OH-THC by CYP2C9 with Km,u that can be lower than unbound plasma concentrations after inhalation but not oral administration of cannabis. Although this may lead to saturation of CYP2C9 metabolism in vivo, at the doses currently used, the fast decline in plasma concentrations due to rapid distribution and clearance will likely result in minimal or no observable THC PK nonlinearity in vivo. CYP2C9 and CYP3A both will likely contribute to the clearance of 11-OH-THC in vivo. The mechanistic information provided in this work will ultimately be used to build a PBPK model in healthy and special populations.
Authorship Contributions
Participated in research design: Patilea-Vrana, Unadkat.
Conducted experiments: Patilea-Vrana.
Contributed new reagents or analytic tools: Patilea-Vrana.
Performed data analysis: Patilea-Vrana.
Wrote or contributed to the writing of the manuscript: Patilea-Vrana, Unadkat.
Footnotes
- Received January 20, 2019.
- Accepted April 22, 2019.
This work was supported by National Institutes of Health National Institute on Drug Abuse [Grant P01DA032507 (to G.I.P.-V. and J.D.U.)] and Rene Levy Fellowship (to G.I.P.-V.). This manuscript constituted part of G.I.P.-V.’s dissertation.
↵
 This article has supplemental material available at dmd.aspetjournals.org.

Abbreviations
- 11-OH-THC
- 11-hydroxy-THC
- AUC
- area under the curve
- BSA
- bovine serum albumin
- CLint
- intrinsic clearance
- COOH-THC
- 11-nor-∆9-carboxy-tetrahydrocannabinol
- DDI
- drug–drug interaction
- DME
- drug-metabolizing enzyme
- fm
- fraction metabolized
- fuinc
- fraction unbound in HLM incubation
- fup
- fraction unbound in plasma
- HLM
- human liver microsome
- IS
- internal standard
- LB
- low-binding
- LC-MS/MS
- liquid chromatography with tandem mass spectrometry
- PBPK M&S
- physiologically based PK modeling and simulation
- PK
- pharmacokinetics
- THC
- (-)-∆9-tetrahydrocannabinol
- UGT
- UDP-glucuronosyltransferase
- Vmax
- maximal formation rate
- Copyright © 2019 by The American Society for Pharmacology and Experimental Therapeutics


