


Abstract
The low volume of distribution associated with acidic molecules means that clearance (CL) must also be very low to achieve an effective half-life commensurate with once or twice daily dosing. Plasma protein binding (PPB) should not usually be considered a parameter for optimization, but in the particular case of acidic molecules, raising the PPB above a certain level can result in distribution volume becoming a constant low value equal to the distribution volume of albumin while acting to reduce CL through restricting hepatic and renal access of unbound drug. Thus effective half-life can be increased. Here we detail the approaches and lessons learned at AstraZeneca during the optimization of acidic CXC chemokine receptor 2 (CXCR2) antagonists for the oral drug treatment of inflammatory diseases, resulting in discovery and clinical testing of N-[2-[(2,3-difluorophenyl)methylsulfanyl]-6-[(2R,3S)-3,4-dihydroxybutan-2-yl]oxypyrimidin-4-yl]azetidine-1-sulfonamide (AZD5069) and AZD4721, orally bioavailable acidic molecules with PPB of <1%, human hepatocyte intrinsic clearance values <5 µl/min per 106 cells and predicted human volume of distribution at steady state (Vss) <0.3 l/kg, resulting in effective half-lives in humans of 4 and 17 hours, respectively.
Significance Statement Provided that the pharmacologic potency is high enough, modulation of plasma protein binding can form part of a viable strategy in drug discovery to optimize the effective half-life of drug candidates in humans.
Introduction
The delivery of compounds into clinical drug development with optimal pharmacokinetics (PK) is important to overall clinical success (Schuster et al., 2005; Cook et al., 2014); consequently, the ability to accurately predict human PK before clinical investment is of high importance (Di et al., 2013). Understanding relationships between pharmacological potency, drug property space, and PK, and being able to manipulate these through medicinal chemistry design, lies at the heart of modern drug discovery. This is itself reliant on detailed scrutiny of in vitro and in vivo drug metabolism and pharmacokinetic data and an awareness of associated caveats (Lavé et al., 2009; Di et al., 2013; Houston, 2013).
For acidic compounds the optimization of PK required for once or twice daily clinical dosing is particularly challenging. The majority of acidic drugs have low steady-state distribution volumes (Vss) in the range of 0.1–0.3 l/kg (Grime et al., 2013) due to a combination of high plasma protein binding (PPB) and low tissue distribution (Smith et al., 2010) unless active hepatic uptake is a determining factor (Grover and Benet, 2009; Gardiner and Paine, 2011). Drug clearance must therefore also be very low to achieve a suitable effective half-life (Smith et al., 2010; Bonn et al., 2016). Although PPB should generally not be a parameter for optimization in drug discovery projects (Smith et al., 2010), in the particular case of acidic molecules this can be an acceptable strategy. Raising the PPB can result in Vss reaching the lower limiting value of approximately 0.1 l/kg, the distribution volume of albumin (Rowland and Tozer, 1989); therefore, further PPB increases cannot result in lowering of Vss below this value but can reduce clearance (CL) through restricting access of unbound drug to the hepatocytes. Through impacting CL but not Vss, half-life is increased and Cmax (and therefore dose) is reduced if the aim is to maintain free drug concentrations above a fixed minimum effective drug concentration. This strategy for optimizing acidic drugs can work if there is excellent pharmacological potency allowing efficacious free blood levels to be maintained at target receptors (Grime and Riley, 2006). With these concepts in mind it is interesting to note that in an earlier review of the relevant literature we found that, of the nine examples of marketed oral acidic drugs with half-lives of more than 8 hours, seven of these have plasma protein binding of ≥99% (naproxen, piroxicam, atovaquone, diflunisal, cetirizine, warfarin, and oxaprozin; Grime et al., 2013).
The CXC chemokine receptor 2 (CXCR2) is expressed on the surface of neutrophils and is involved in the recruitment of these phagocytic white blood cells to sites of inflammation through CXCL8 (interleukin-8, IL-8) signaling (Mukaida, 2003). Accordingly, antagonism of CXCR2 has been proposed as a strategy for the treatment of inflammatory diseases such as arthritis, chronic obstructive pulmonary disease, and cancer (Holmes et al., 1991; Murphy and Tiffany, 1991; Beeh et al., 2003; Jamieson et al., 2012; Highfill et al., 2014; Steele et al., 2016).
In the AstraZeneca CXCR2 drug discovery program, the acidity of the molecules was shown to be an important parameter for increasing both CXCR2 receptor binding and PPB (Austin et al., 2015). We outline the approaches taken and lessons learned from early CXCR2 clinical drug candidates and describe the preclinical data analysis that led to a strategy for achieving PK half-lives commensurate with once and twice daily dosing, ultimately resulting in the improved clinical drug candidates N-(2-[(2,3-difluorobenzyl)sulfanyl]-6-{[(2R,3S)-3,4-dihydroxy-2-butanyl]oxy}-4-pyrimidinyl)-1-azetidinesulfonamide (AZD5069) and AZD4721.
Materials and Methods
Chemicals
All chemicals and reagents used were of the highest available grade. The AstraZeneca compounds including AZD5069 and AZD4721 were synthesized in-house by AstraZeneca (Austin et al., 2000; Willis et al., 2001; Bonnert, 2004; Ebden et al., 2004; Brough and McInally, 2005; Cheshire et al., 2006; Connolly et al., 2013). All other chemicals were purchased from Sigma-Aldrich (Poole, Dorset, United Kingdom). Hepatocyte suspension buffer was prepared from powder-equivalent Dulbecco’s modified Eagle’s medium (Sigma, Gillingham, United Kingdom) containing sodium HEPES (2.34 g) and d-fructose (0.4 g) in 1 liter of Milli-Q water. The pH was adjusted to be 7.4 with HCl (1 M) at 37°C. The hepatocyte suspension buffer contained bovine serum albumin (BSA, 2 g) to wash cells after the hepatic isolation procedure, but intrinsic clearance incubation buffer was prepared without BSA.
Hepatocyte Preparations
Rat hepatocytes were isolated from male Sprague-Dawley rats using the two-step in situ collagenase perfusion method of Seglen (1976), as described elsewhere (Soars et al., 2007). Dog hepatocytes were isolated in house from male beagle dogs of approximately 1 year old. The isolation procedure was based on the two-step in situ collagenase perfusion method described in more detail elsewhere (McGinnity et al., 2004). Rat and dog hepatocytes were resuspended for assay use in suspension buffer without BSA, and their viability was assessed using the trypan blue exclusion method. Only cells with a viability >80% were used. Cryopreserved isolated human hepatocytes were obtained from CellzDirect (Durham, NC) and thawed according to the supplier’s instructions.
Equilibrium Dialysis Measurement of Plasma Protein Binding
Equilibrium dialysis measurement of PPB was performed as described elsewhere (Fessey et al., 2006). In brief, to one compartment of each of the dialysis cells were added 1 ml of plasma and 10 μl of a solution of compound at a concentration of 2 mM in DMSO. The second section of each dialysis cell was filled with 1 ml of phosphate buffer (pH 7.4, 0.1 M). The cells were then sealed, attached to the Dianorm unit, and rotated in a water bath at 37°C for 18 hours. Plasma (100 μl) from the dialysis cell was added to phosphate buffer (500 μl), and 500 μl of the buffer solution from the dialysis cell was pipetted in to blank plasma (100 μl).
The samples were analyzed using high-pressure liquid chromatography (HPLC) with MS detection. Due to the frequent nonlinear response of the mass spectrometry detectors, a calibration curve was obtained from dilutions of the stock solutions with 6-fold diluted plasma. The concentrations of the four standards were 0.05, 0.15, 0.5, and 2.5 μM, and they injected in this order followed by the buffer samples and then the plasma samples.
The extent of PPB was calculated as described by Fessey et al. (2006). The chromatogram peak areas were processed automatically to use the calibration curve for each compound to calculate the concentration of unknowns. These “concentrations” were corrected for differences in injection volumes and the dilution of the plasma. The percentage bound value was calculated using the following equation: The factor of 1.2 in the numerator accounts for the small dilution of the aqueous samples with plasma. The factor of 6 in the denominator serves to correct for the 6-fold dilution of the plasma samples with buffer.
Each compound was measured in duplicate in the same experiment. The precision of the assay was assessed over many duplicate measurements performed across structurally diverse compounds. Table 1 contains the ratio of the percent free for duplicate pairs of measurements from the same batch of plasma for 1681 compounds measured in the protein binding assay. The distribution of duplicate pair-ratios was almost normally distributed; applying the assumption of normality, it can then be calculated that 95% of duplicate ratios are less than 2.14. Any duplicate ratio larger than 2.14 is thus a rare occurrence and can be termed an outlier, and the assay would be repeated for this compound.
Mean, S.D., and 95% limit for pairs of mean percent free data in human, rat, and dog plasma binding data in the same batch of plasma
Table 2 contains mean free percent ratios when the same compound was measured on different days—that is, with a different batch of plasma. The mean percent free on 1 day (mean of two data points) was then compared with the mean percent free on another day for each compound.
Mean, S.D., and 95% limit for pairs of mean percent free data in human, rat, and dog plasma binding data in different batches of plasma
The data in Table 2 show that the average ratio of the mean percent free determined 1 day to the mean percent free determined on another day is about 1.5, with a S.D. of about 0.5. The standard deviations in Table 2 are not directly comparable with the standard deviations in Table 1 because the standard deviations in Table 2 are the average S.D. of the ratio of two means (each a mean of two data points), whereas the standard deviations in Table 1 are the average standard deviation of the ratio of two single measurements of the percent free.
The 95% limit for duplicate ratios in Table 2 indicates that if a compound is measured on two different days and the mean percent free differs by a factor of greater than about 2.6, then the data must be viewed as suspect (even if each of the two duplicates has a satisfactory duplicate ratio), and more experiments should be performed. Hence, during the discovery phase when comparing the percent free of different compounds, the assay performance analysis indicated that for compounds measured once (in duplicate), a difference between compounds ≥2.6 in the fraction unbound (fu) was required to be judged a significantly different percent free value at the 95% level. In general, compounds were tested on two separate occasions and key compounds such as AZD5069 and AZD4721 on five or more occasions.
Determination of Blood–Plasma Ratio
Stock concentrations of test compounds were 100-fold above final incubation concentrations, and these were pipetted into fresh blood and plasma (0.5 ml). After 15 minutes of incubation (37°C) and centrifugation (9000g, 4 minutes) using an MSE MicroCentaur centrifuge (Fisher Scientific, Loughborough, United Kingdom), aliquots from both the blood and plasma incubations were pipetted into methanol and stored at −20°C for 1 hour. Samples were centrifuged (2000g, 20 minutes), and the supernatant was analyzed by liquid chromatography with tandem mass spectrometry (LC-MS/MS). The blood–plasma ratio was calculated from the ratio of the analyte concentration in directly spiked plasma to that in plasma isolated from spiked blood. Key compounds such as AZD5069 and AZD4721 were tested across species.
Measurement of logD7.4, pKa, and Solubility
For logD7.4 determination, separation of compounds between 1-octanol and phosphate buffer (0.02 M, pH 7.4 at 20°C) was determined using a shake flask method. Octanol and aqueous tiers were analyzed by LC-MS/MS as described here. The pKa was measured using a Sirius GLpKa instrument with DPAS (Dip Probe Absorption Spectroscopy) attachment (Sirius Analytical Instruments Ltd, Forest Row, United Kingdom). Samples of test compounds were placed in vials in a movable autosampler tray for titration. Assays were set up using the GlpKaControl software, and the results were analyzed using the pKaLOGP and pKaUV software, which allows determination of multiple pKa values using complex curve fitting analyses.
Solubility was measured as described elsewhere (Wenlock et al., 2011b). In brief, compounds (1 mg) were placed into separate 2-ml glass tubes, and phosphate buffer (pH 7.4, 0.1 M, 1 ml) was added. The vials were shaken for a minimum of 18 hours. After shaking, the saturated solutions were transferred to 2-ml centrifuge tubes and were centrifuged at 13,000g for 15 minutes. The supernatants were then removed, placed into new centrifuge tubes, and centrifuged again at 13,000g for 15 minutes.
Aliquots of the supernatants from the second centrifugation were analyzed by LC-MS/MS along with standard concentration stock solutions, prepared by adding DMSO (800 μl) to compound (1 mg) and sonicating (15 minutes). Single measures were generally regarded as sufficient except for key compounds such as AZD5069 and AZD4721.
Determination of Intrinsic Clearance
Test compound stock solutions were prepared in DMSO at 100-fold incubation concentration (100 μM). Stock solution (10 μl) was added to the hepatocyte suspension buffer (490 μl). This solution and separately the hepatocytes (2 million viable cells/ml) were preincubated for 5 minutes in a shaking (80 oscillations/min) waterbath at 37°C. Reactions were initiated by adding hepatocyte suspension (500 μl) to test compound solution giving a final substrate concentration of 1 μM and 1% (v/v) DMSO. Aliquots (40 μl) were removed at 0, 2, 6, 15, 30, 45, 60, and 90 minutes, and the reactions were quenched in 120 μl of ice-cold methanol. Samples were subsequently frozen for 1 hour at −20°C and then centrifuged at 2000g for 20 minutes at 4°C.
The supernatants were removed for LCMS/MS analysis. Analytical LC-MS/MS peak areas of samples were loge-transformed, and elimination rate constants k (min−1) were derived from the slopes of the loge[substrate]-time plots. Intrinsic clearance was calculated from CLint = k × V, where V represents the incubation volume (ml/mg protein or ml/million cells). Key compounds such as AZD5069 and AZD4721 were incubated on at least three separate occasions in rat, dog, and human hepatocytes.
Methods for Prediction of Hepatic Metabolic CL
Clearance predictions were made using a “regression line approach,” whereby an existing in vitro–in vivo unbound CLint data set (for which in vivo CLint values represent metabolic clearance only) is used as a framework for predicting the in vivo clearance for novel compounds (Sohlenius-Sternbeck et al., 2012). However, determination of whether the clearance of a compound is well predicted from the in vitro data comes from the assessment of CLint,u,in vivo/CLint,u,in vitro, which should be between 0.5 and 2.0 (Grime et al., 2013). See Table 3 for AZD5069 and AZD4721 predictions.
Preclinical data summary and predicted human PK for AZD5069 and AZD4721
Preclinical In Vivo Studies
All in vivo work was subject to internal ethical review and conducted in accordance with UK Home Office requirements under the Animals Scientific Procedures Act (1986). Healthy virus-antibody-free male Sprague-Dawley rats were obtained from Charles River (Margate, United Kingdom). They were housed in a light-controlled room (19 ± 2°C and 55% ± 10% humidity). A Teklad 2021 diet (Harlan) was used with drinking water ad libitum. In-house bred male beagles (housed in pairs, temperature of 18 ± 2°C, and humidity 55% ± 10%) were fed with a SDS D3 (E) Dog Maintenance diet with water ad libitum.
Intravenous and Oral Pharmacokinetic Studies
Rat.
AZD5069 and AZD4721 were dosed at 1 mg/kg as a bolus to the tail vein in DMA:H2O (1:9 v/v) to conscious male rats (n = 3 or 4). Doses by mouth (PO) were given via oral gavage in a Tween (0.1%) hydroxypropyl methylcellulose (HPMC) (1%) suspension (n = 3). Serial blood samples (200–300 μl) were taken, and the plasma was recovered after centrifugation.
Dog.
AZD5069 and AZD4721 were dissolved in bicarbonate buffer (pH 10.0) including 10% ethanol to a concentration of 1 mg/ml. The dose was given via infusion (30 minutes) to the cephalic vein. PO doses were given via oral gavage in a Tween (0.1%) HPMC (1%) suspension (n = 2). Serial blood samples (2.5 ml) were taken and centrifuged to obtain plasma.
Intravenous Bile Duct Cannulation Studies (AZD5069 and AZD4721)
Rat.
After at least 1 week of acclimatization, rats (250–350 g) were surgically prepared under isoflurane anesthesia. The bile duct was cannulated with a bile-pancreatic catheter (constructed by polyethylene catheter Physiocath and P90; Data Sciences International, St. Paul, MN). An opening was made in the duodenum, and the catheter was inserted for bile recirculation. A small cut in the skin (around the area of the scapula) facilitated subcutaneous routing of the catheter. After 3 days’ recovery, the animals were connected to a swivel system (Instech Laboratories, Plymouth Meeting, PA) that allowed freedom of movement during the experiment. Cannulae were inserted into the jugular and carotid blood vessels for dosing and blood sampling respectively.
A bile sample was taken over the first hour after dosing and then every half-hour until 7 hours. Blood samples (200–300 μl) were taken at the midpoint of the bile collections, and the plasma was prepared as stated earlier. Urine was also collected, and all samples were stored at −20°C.
Dog.
After at least 4 weeks of acclimatization, a bile duct cannulation (BDC) operation was performed on two dogs following the technique described by Kissinger et al. (1998). A 1-month recovery period followed before the study. AZD5069 and AZD4721 were dissolved in bicarbonate buffer (pH 10.0) including 10% ethanol to a concentration of 1 mg/ml. The dose was given via infusion (30 minutes) to the cephalic vein. Jugular vein sampling of blood (2.5 ml) was made into EDTA-containing tubes at 0, 15, 30, 60, 120, 180, 300, 420, 720, and 1440 minutes after the start of the infusion before centrifugation (1110g, 10 minutes) for plasma collection. Bile and urine collection continued for 24 hours. All samples were stored at −20°C before analysis.
Sample Preparation.
Before analysis, samples from the in vivo studies were prepared as follows: Aliquots (50 µl) of plasma were added to methanol (150 µl). Water was added to the bile and urine before analysis. Standard curves and quality control (QC samples) were made up in matrix blanks.
Sample Analysis
Samples were analyzed by LC-MS/MS (HP1100 HPLC system supplied by Hewlett Packard, Quattro Ultima mass spectrometer supplied by Micromass; Waters, Milford, MA). Electrospray ionization mode was used. For HPLC, a Waters Symmetry C8 3.5 µm (2.1 × 30 mm) column was used, injecting 10 μl of each sample. The mobile phase was water plus 0.1% formic acid and methanol plus 0.1% formic acid.
Pharmacokinetics
Parameters (clearance, Vss, and terminal half-life) were derived from the concentration–time profile by noncompartmental analysis using WinNonlin Professional Version 5.2 (Pharsight Corporation, Mountain View, CA). Clearance estimated as dose divided by AUC, where AUC is the area under the concentration–time curve from time zero extrapolated to infinity. AUC is estimated by AUC(0–last) + Clast/λz, where Clast is the last observed quantifiable concentration. Vss was estimated by dividing the mean residence time by the clearance. Terminal half-life was estimated as (ln2)/λz, where λz is the terminal rate constant, estimated by log-linear least squares regression of the terminal part of the concentration–time curve.
Prediction of Human Vss and Effective Half-Life
The average of rat and dog Vss,u (Vss adjusted for PPB) was used to predict human Vss,u, which was then multiplied by human PPB to predict human Vss. Human effective half-life was predicted from 0.693 × Predicted Vss/Predicted CL.
Metabolite Identification Studies
In vitro incubations were performed with isolated rat, dog, and human hepatocytes (2 million cells/ml). AZD5069 and AZD4721 (10 µM) were incubated for 1 hour at 37°C. The incubations were quenched with two volumes of methanol, vortexed, and stored at −20°C. Samples were prepared just before MS analysis by centrifugation at 9000g for 30 minutes and by transferring the supernatant to sample vials. In vivo samples were prepared as follows: urine and bile samples were diluted one part bile or urine to one part methanol, vortexed, and frozen. Plasma samples were quenched with three volumes of methanol and frozen. Samples were defrosted, vortexed, and centrifuged (9000g for 30 minutes) just before analysis, and the supernatant was taken and diluted 1:1 with water.
Samples were analyzed in positive ion mode. The MS method used consisted of two MS channels, a normal MS scan and a source induced decomposition (SID) channel to provide structural data on parent compound and metabolites. Where necessary, MS/MS was also performed. All MS data were acquired with a mass accuracy of 5 ppm. After the analysis, the data were processed manually to identify the major metabolites based on MS response. Minor metabolites were defined as representing ≤1% of the total response.
Clinical PK
Both the AZD5069 and AZD4721 studies were approved by an independent ethics committee before initiation and were performed in accordance with the ethical principles that have their origin in the Declaration of Helsinki and are consistent with International Conference on Harmonization/Good Clinical Practice, applicable regulatory requirements, and the AstraZeneca Policy on Bioethics. Informed consent was obtained from all volunteers before initiation of the studies. AZD5069 human pharmacokinetic data were generated in a phase 1, blinded, randomized, placebo-controlled, single-center study (NCT00953888 and Cullberg et al., 2018) to investigate the safety, tolerability, pharmacokinetics, and pharmacodynamics of oral AZD5069 after single ascending doses in Caucasian male and female healthy volunteers with body mass indices between 18 and 30 kg/m2 (inclusive) and weights between 50 and 100 kg (inclusive). The study was performed at AstraZeneca Clinical Pharmacology Unit, Queens Medical Centre (Nottingham, United Kingdom).
Serial blood samples were taken up to 96 hours after the dose administration, and plasma samples were analyzed using validated bioanalytical methods at AstraZeneca R&D Charnwood. The PK parameters were derived using standard noncompartmental methods.
AZD4721 human pharmacokinetic data were generated in a separate phase 1, blinded, randomized, placebo-controlled, single-center study (NCT01889160) to investigate the safety, tolerability, pharmacokinetics, and pharmacodynamics of oral AZD4721 after single ascending doses in Caucasian male healthy volunteers with body mass indices between 18 and 30 kg/m2 (inclusive) and weights between 50 and 100 kg (inclusive). The study was performed at Quintiles Drug Research Unit at Guy’s Hospital London, England.
Serial blood samples were taken up to 216 hours after the dose administration, and plasma samples were analyzed using validated bioanalytical methods. The pharmacokinetic parameters were derived using noncompartmental methods with WinNonlin Professional Version 5.2, or higher (Pharsight).
Data Analysis
Impact of PPB on Rat Pharmacokinetics.
In vivo rat CL was plotted against rat PPB data and separately rat Vss for the thiazolone and sulfamide chemical series investigated in the CXCR2 program.
Simulating the Impact of PPB on Human Half-Life.
The CL prediction method (using the regression line approach and unbound in vivo and in vitro CLint; see Materials and Methods) was used to calculate CL at various values of PPB when human hepatocyte CLint was of 1 µl/min per million hepatocytes. Changes in half-life were calculated as 0.693 × Vss/CL when Vss was constant at 0.2 l/kg (unaffected by plasma protein binding).
Results
Analysis of the Impact of PPB on Rat Pharmacokinetics
Plasma protein binding was shown to relate to rat clearance for two chemical series of compounds, thiazolones and sulfamides (Figs. 1 and 2A). Vss was found to be low, as expected for acidic molecules, with 70% of the molecules having Vss less than 0.4 l/kg (Fig. 2B). The data indicates the lack of a relationship between plasma protein binding and distribution volume.

Chemical development of CXCR2 antagonists from an early clinical candidate AZD8309, to AZD5069 and AZD4721 with twice-daily and once-daily dosing in humans, respectively.

The relationship between (A) plasma protein binding and rat plasma clearance and (B) rat steady-state volume of distribution (Vss) for AstraZeneca CXCR2 antagonists from the sulfamide (▲) and thiazolone (■) chemical series with correlation statistics. Individual compound data, chemical series, and structure references are provided in the Supplemental Information (see Supplemental Table 1).
Simulating the Impact of PPB on Human Half-Life
Based on the observations in Fig. 2, a simple simulation was performed assuming Vss to be typically low for an acidic molecule and constant at 0.2 l/kg. Assuming that it is possible to keep hepatic intrinsic clearance of unbound drug constant while increasing PPB, the prediction demonstrates that PPB influences half-life through reducing clearance and indicates that PPB in excess of 99.2% could achieve a half-life in excess of 15 hours (Fig. 3).
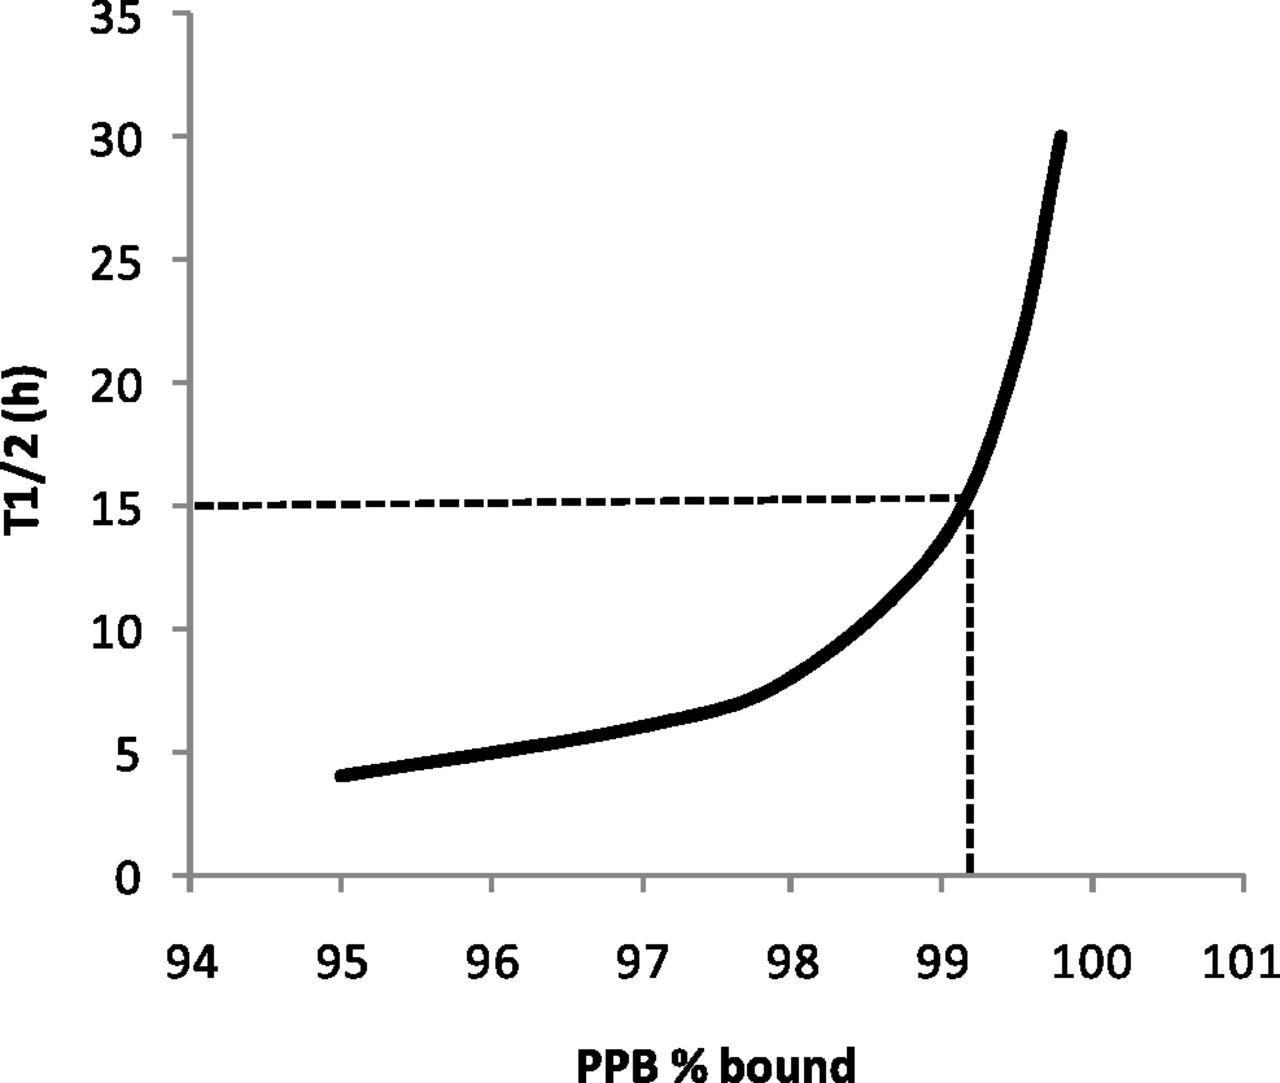
Simulation highlighting the predicted effect of drug binding to plasma proteins on half-life (0.693 × Vss/CL). CL was predicted using the regression line approach (Materials and Methods), with human hepatocyte CLint set to be 1 µl/min per million hepatocytes and Vss kept constant at 0.2 l/kg (unaffected by plasma protein binding). Dotted line indicates PPB of 99.2% at t1/2 of 15 hours.
Preclinical Data and Human PK Predictions
A summary of key preclinical in vitro and in vivo data for AZD5069 and AZD4721 is shown in Table 3.
AZD5069.
Analysis of rat PK data showed that bile duct cannulation had no discernible effect on the PK profile (Fig. 4). Subsequent to the readout of the clinical PK data for AZD5069, a BDC study revealed the dog PK profile to have a lower exposure and shorter observed terminal phase than from the noncannulated intravenous PK experiment, even though biliary clearance of parent AZD5069 was measured as 0.1 ml/min per kilogram (1.4% of total CL).
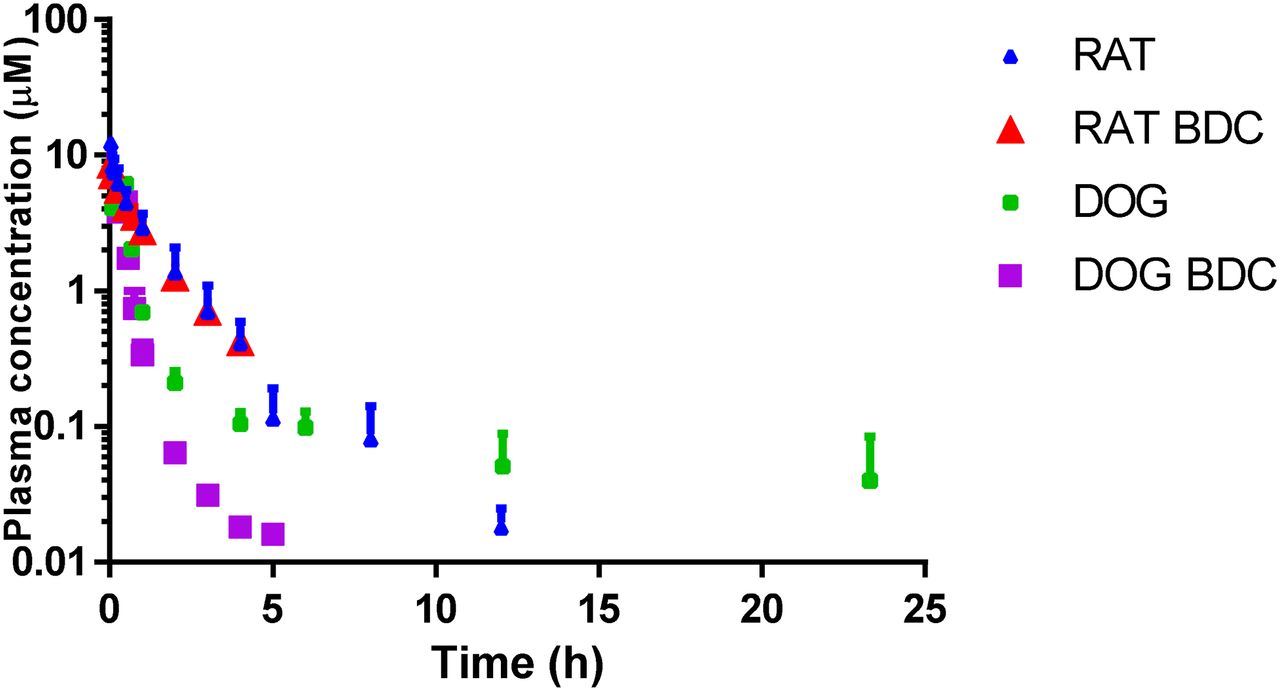
AZD5069 plasma concentration–time profile after intravenous dosing (1 mg/kg) to bile duct cannulated (red triangles) and noncannulated (blue triangles) rats and bile duct cannulated (purple squares) and noncannulated (green squares) dogs.
AZD4721.
As with AZD5069, human CL was predicted to be driven entirely by hepatic metabolism. With lower human hepatocyte CLint and higher human PPB, the effective human half-life was predicted to be considerably longer than that predicted for AZD5069. Unlike AZD5069, dog intravenous and BDC PK profiles for AZD4721 were very similar in shape and absolute concentration throughout the sampled interval (Fig. 5).

AZD4721 plasma concentration–time profile after intravenous dosing (1 mg/kg) to bile duct cannulated (red triangles) and noncannulated (blue triangles) rats and bile duct cannulated (purple squares) and noncannulated (green squares) dogs.
Biotransformation Data
AZD5069.
AZD5069 metabolism was complex, with multiple pathways observed in rats, dogs, and humans. However, the major pathways identified were direct glucuronide conjugation at the diol group, S-debenzylation (loss of the methylene-difluorophenyl moiety) and oxidations on the azetidine ring (Fig. 6). Qualitatively, the metabolites were generally similar in each of the species but there were quantitative differences, partly as a result of different metabolic turnover rates.

Major metabolites of (A) AZD5069 and (B) AZD4721 after hepatocyte incubations in rats, dogs, and humans and in vivo from rats and dogs (see Materials and Methods).
The most substantial difference was observed in dogs, with the O-glucuronide of AZD5069 being by far the most prominent metabolic route and representing 99% of MS response. Absolute configuration as an O-glucuronide on the 4-hydroxy position of the 3,4-dihydroxy-2-yloxy side chain of AZD5069 was later determined by NMR (data not shown).
AZD4721.
A similar metabolism pattern to AZD5069 was observed for AZD4721. However, azetidine oxidation products were more minor than for AZD5069, possibly due the addition of the methyl at the azetidine three-position as well as lower turnover rates in hepatocytes. As with AZD5069, the O-glucuronide was the major metabolite observed in dogs in vitro and in vivo; however, rather than representing 99% of the drug-related MS response observed for AZD5069, this was reduced to 56%.
From incubations with human hepatocytes, formation of a carboxylic acid metabolite represented 4% of drug-related MS response. This was more major than in the either of the other two species or for that observed with AZD5069 (Fig. 6).
Clinical PK
AZD5069.
Exposure of AZD5069 (AUC and Cmax) was found to be approximately dose proportional after dosing of 0.1–200 mg with an effective half-life of 4 hours. The 24-hour plasma profile for the 120 mg dose is shown in Fig. 7.

Human plasma concentration (mean ± S.D.) 24-hour time-profile after oral administration of 120 mg of AZD5069 (●), n = 6; or 150 mg of AZD4721 (♦), n = 5.
AZD4721.
The geometric mean effective half-life of AZD4721 ranged from 14 to 19 hours across the dose range studied (19–730 mg). AUC and Cmax increased in proportion to the dose. The 24-hour plasma profile for the 150-mg dose is shown in Fig. 7.
Discussion
The modulation of physicochemical properties to manipulate PK parameters lies at the heart of effective drug discovery (Riley et al., 2002; Davis and Riley, 2004; Di et al., 2013; Lombardo et al., 2014). Indeed, optimizing molecular properties such as size, lipophilicity, and polarity has been directly linked to greater success in clinical drug development (Waring et al., 2015).
Early CXCR2 antagonists in the AstraZeneca program had bicyclic thiazolone cores and were relatively lipophilic weak acids with poor solubility (Walters et al., 2008) but nonetheless their properties were sufficiently promising for the lead compound AZD8309 5-[(2,3-difluorobenzyl)sulfanyl]-7-{[(2R)-1-hydroxy-2-propanyl]amino}[1,3]thiazolo[4,5-d]pyrimidin-2(3H)-one; (Fig. 1) to be taken into the clinic. Although AZD8309 proved a valuable tool compound to investigate the role of CXCR2 antagonists in inflammatory lung disease (Virtala et al., 2012; Leaker et al., 2013) its PK properties, exemplified by variable human bioavailability and a short half-life, were regarded as unsuitable for further clinical development. In the main these molecules had high PPB, high in vitro metabolic instability and low incubational binding, which gave poor predictions of in vivo rat and dog CL when using a simplified version of the well-stirred model, ignoring drug-binding terms. These observations and those of others (Houston and Carlile, 1997; Iwatsubo et al., 1997; Carlile et al., 1999; Ito and Houston, 2005) gave us a greater appreciation of the impact of drug binding on CL predictions, and revised CL prediction models resulting from our experiences were subsequently published (Grime and Riley, 2006).
To design a CXCR2 antagonist with improved human PK properties, we needed to both improve the bioavailability of AZD8309 and increase the effective half-life. The former was achieved by designing a monocyclic series of sulfamides with increased solubility (Austin et al., 2015). The latter was tackled by examining the data presented in Fig. 2A, with the striking observation that a compound could have high metabolic instability and yet low CL in vivo if the PPB was high enough. Since PPB appeared to have little relationship to distribution volume (Fig. 2B), this indicated that half-life could possibly be extended by raising PPB.
Theoretically, increasing binding to blood components should reduce distribution of a drug into body tissues (Smith et al., 2010), but this was not observed in the data presented in Fig. 2B, most likely due to a combination of poor distribution properties for these acidic molecules and lipophilicity playing a “canceling out” role through impacting both PPB and affinity for tissue. Given the observation that increasing acidity is related to increasing potency and PPB (Austin et al., 2015), the proposed strategy in the CXCR2 program was to increase acidity to increase both parameters while reducing logD7.4 to obtain better metabolic stability. Using a CL prediction method incorporating drug-binding terms and a regression line method (Grime and Riley, 2006; Sohlenius-Sternbeck et al., 2012), a simple simulation demonstrated the general PK strategy for the program (Fig. 3).
Eventually this approach led to the discovery of AZD5069 (Fig. 1), with the substitution of nitrogen-linked for oxygen-linked pyrimidine playing a major part in giving acceptable lipophilicity, increased acidity, and the desired combination of potency, PPB, solubility, and metabolic stability (Cheshire et al., 2010; Nicholls et al., 2015). The use of an azetidine proved valuable in minimizing metabolism on the left-hand side of the molecule, as others have found (Obach et al., 2016); the diol provided both reduced logD7.4 and reduced CLint compared with the equivalent mono-alcohols.
AZD5069 had a short half-life in rats and dogs but with CL apparently driven solely by metabolism (Table 3). However, with good in vitro–in vivo extrapolation (IVIVE) for unbound hepatic metabolic CLint (in vivo/in vitro unbound CLint ratios of between 0.76 and 1.1 for rats and dogs; Table 3), there was confidence in achieving the 7.5-hour predicted human effective half-life.
Consensus opinion has converged on a definition for accuracy of clinical PK parameter prediction being observed/predicted within 2-fold (Lavé et al., 2009). For AZD5069, the 2-fold overprediction of half-life may not technically be considered failure; however, in the context of a 7.5-hour predicted half-life being realized as a 4-hour half-life, it represented a complication to the program because once-daily dosing was a primary objective. The fact that the effective half-life of AZD5069 after intravenous dosing was only 1 hour in rat and dog PK studies and human half-life was predicted to be almost 8 times longer but was in fact only 4 times longer after PO dosing prompts useful reflection on the value of allometry-based predictions.
It has been noted previously that while standard allometric scaling approaches offer fairly poor predictivity of human CL (Caldwell et al., 2004; Ward and Smith, 2004), the work of Ward and Smith highlights that human effective half-life often approximates to 4 times rat half-life, offering a useful validation of IVIVE-based predictions that should be investigated thoroughly before clinical drug development (Grime et al., 2013). Considerations of the pros and cons of allometric approaches are discussed in detail elsewhere (Di et al., 2013), but discrepancies between allometric and IVIVE predictions can come from species differences in PPB, drug-metabolizing enzyme, or drug transporter kinetics. As with all candidate drugs at AstraZeneca, the checks used for AZD5069 included an assessment linearity of in vitro intrinsic clearance with respect to drug concentration, based on the work of Obach and Reed-Hagen (2002); for human hepatic microsomal and hepatocyte intrinsic clearance, the data gave consistent predictions of hepatic clearance.
In attempting to understand what may have caused the discrepancy between predicted and observed effective human PK half-life, attention was drawn to the larger Vss in dogs compared with rats and the longer terminal half-life in comparison with the effective half-life in the dog PK profile (Fig. 4). This PK profile feature is quite unusual for an acidic drug with inherently poor distribution properties. A BDC study in dogs revealed the PK profile to have a lower exposure and shorter observed terminal phase than from the noncannulated intravenous PK experiment, indicating possible enterohepatic recirculation. However, AZD5069 biliary clearance was measured as being similarly low (0.1 and 0.1 ml/min per kilogram, representing 1.5% and 2% of total CL) in rats and dogs, respectively. Metabolite identification data from in vitro (dog hepatocyte incubations) and in vivo samples (urine and bile analysis from the intravenous dosed dog BDC experiment) highlighted direct glucuronidation of the secondary alcohol as the major metabolite seen in dogs. In comparison, the glucuronide metabolite was less prominent in the rat in vivo, or rat and human in vitro samples for which oxidation (of the alcohols, at the S-benzyl position and on the azetidine ring) were also observed as principal metabolites (Fig. 6). Taken together, these data suggest that enterohepatic recirculation, involving biliary excretion of hepatically formed O-glucuronide metabolites followed by intestinal hydrolysis to the aglycone parent AZD5069 with subsequent reabsorption, may have extended the observable terminal PK phase in the standard intravenous dog PK experiment, leading to overestimation of predicted Vss and effective half-life, as has been observed by others (Ouellet and Pollack, 1995; Deng et al., 2012).
Despite AZD5069 being a very attractive drug for twice-daily dosing, we still had an ambition to design a once-daily drug. There was still belief in the strategy of raising human PPB to improve half-life. Thus, through subtle structural changes AZD4721 N-(6-{[(2R,3S)-3,4-dihydroxy-2-butanyl]oxy}-2-[(4-fluorobenzyl)sulfanyl]-4-pyrimidinyl)-3-methyl-1-azetidinesulfonamide; (Fig. 1) was designed. The changes that achieved these improvements were methylation of the azetidine and replacement of the 2,3-difluorobenzyl with a 4-fluorobenzyl group. In fact, an increase in PPB giving a decrease in blood free fraction of almost 6-fold was achieved for AZD4721 in comparison with AZD5069, despite almost identical logD7.4 and pKa values (Table 3). Metabolic stability was also slightly improved, with a mean human liver microsomes CLint value approaching 2-fold lower for AZD4721.
AZD4721 was also primarily metabolized by direct glucuronidation in dogs, with a qualitatively very similar metabolic map to that of AZD5069 in all species. However, with lower CLint and greater than 10-fold lower in vivo CL, enterohepatic recirculation was not observed in the AZD4721 dog PK profile in the sampled interval, so it had no impact on estimated Vss. Given the uncertainty around the predicted and observed human Vss for AZD5069, as discussed earlier, Vss for AZD4721 was set to the lower limiting value of 0.1 l/kg (Rowland and Tozer, 1989) in making the predictions of human PK.
Clinical data for AZD4721 confirmed that the strategy of increasing plasma protein binding for acidic drugs can be successful in reducing clearance to very low levels and therefore providing an effective half-life long enough for once-daily dosing with minimal Cmax/Cmin, despite very low distribution volume (Fig. 7). An alternative or complimentary approach can be to increase the blood–plasma ratio through drug binding to erythrocyte components. One example of this is to use the affinity of primary sulfonamides for the carbonic anhydrase enzyme (Boddy et al., 1989). Of course, for such a molecule to be an effective therapeutic drug requires at least that the pharmacologic potency is high enough at a deliverable dosage to overcome the issue of low free fraction in blood. The in vitro potency properties and sustained clinical profile of AZD4721 indicated that this should not be an issue in this case. Even though the observed half-life was 1.6-fold less than predicted, the fact that the predicted half-life approximated to the required dose interval minimized the relevance of this.
In summary, this work details the optimization strategy of acidic CXCR2 antagonists, resulting in two molecules, AZD5069 and AZD4721, suitable for twice-daily and once-daily oral dosing, respectively. This shows that under certain circumstances optimization of binding to plasma proteins can be a viable strategy to optimize effective half-life in humans.
Acknowledgments
The authors thank: Steve Connolly, Alison Wilby, Rob Riley, Jane Kenny, Anthony Atkinson, Premji Meghani, Jeffrey Stonehouse, Roger Bonnert, David Cheshire, Iain Walters, Mark Ebden, Alasdair Gaw, Andy Davis, Rupert Austin, Marie Cullberg, Bengt Larsson, Heather Wray, and Anna Malmgren.
Authorship Contributions
Participated in research design: Gardiner, Cox, Grime.
Conducted experiments: Gardiner, Cox, Grime.
Performed data analysis: Gardiner; Cox, Grime.
Wrote or contributed to the writing of the manuscript: Gardiner, Cox, Grime.
Footnotes
- Received March 20, 2019.
- Accepted May 17, 2019.
↵
 This article has supplemental material available at dmd.aspetjournals.org.

Abbreviations
- AUC
- area under the concentration–time curve
- AZD4721
- N-(6-{[(2R,3S)-3,4-dihydroxy-2-butanyl]oxy}-2-[(4-fluorobenzyl)sulfanyl]-4-pyrimidinyl)-3-methyl-1-azetidinesulfonamide
- AZD5069
- N-[2-[(2,3-difluorophenyl)methylsulfanyl]-6-[(2R,3S)-3,4-dihydroxybutan-2-yl]oxypyrimidin-4-yl]azetidine-1-sulfonamide
- AZD8309
- 5-[(2,3-difluorobenzyl)sulfanyl]-7-{[(2R)-1-hydroxy-2-propanyl]amino}[1,3]thiazolo[4,5-d]pyrimidin-2(3H)-one
- BDC
- bile duct cannulation
- BSA
- bovine serum albumin
- CL
- clearance
- CLint
- intrinsic clearance
- CLint,u
- unbound intrinsic clearance
- CXCR2
- CXC chemokine receptor 2
- fu,inc
- fraction unbound in the incubation
- HPLC
- high-pressure liquid chromatography
- HPMC
- hydroxypropyl methylcellulose
- IVIVE
- in vitro–in vivo extrapolation
- LC-MS/MS
- liquid chromatography with tandem mass spectrometry
- PO
- by mouth
- PPB
- plasma protein binding
- PK
- pharmacokinetics
- Vss
- volume of distribution at steady state
- Vss
- u volume of distribution at steady state corrected for plasma protein binding
- Copyright © 2019 The Author(s).
This is an open access article distributed under the CC BY Attribution 4.0 International license.


