


Article Figures & Data
Figures
- Fig. 1.
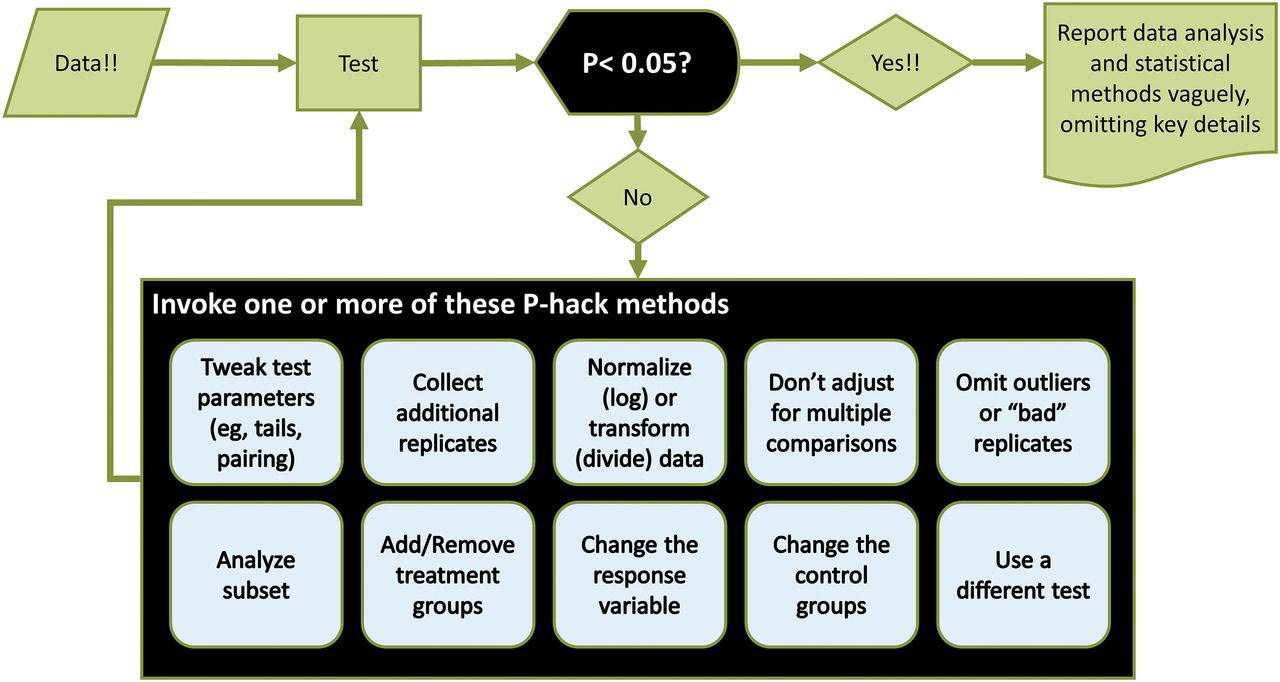
P-hacking refers to a series of analyses in which the goal is not to answer a specific scientific question but rather to find a hypothesis and data analysis method that results in a P value less than 0.05.
- Fig. 2.
Hypothetical data illustrating how data points may appear as outliers on a linear scale but not after log transformation. The five data tests are all randomly drawn from a lognormal distribution. The left panel uses a linear scale. Some of the points look like outliers. The right panel shows the same data on a logarithmic axis. The distribution is symmetrical, as expected for lognormal data. There are no outliers.
- Fig. 3.
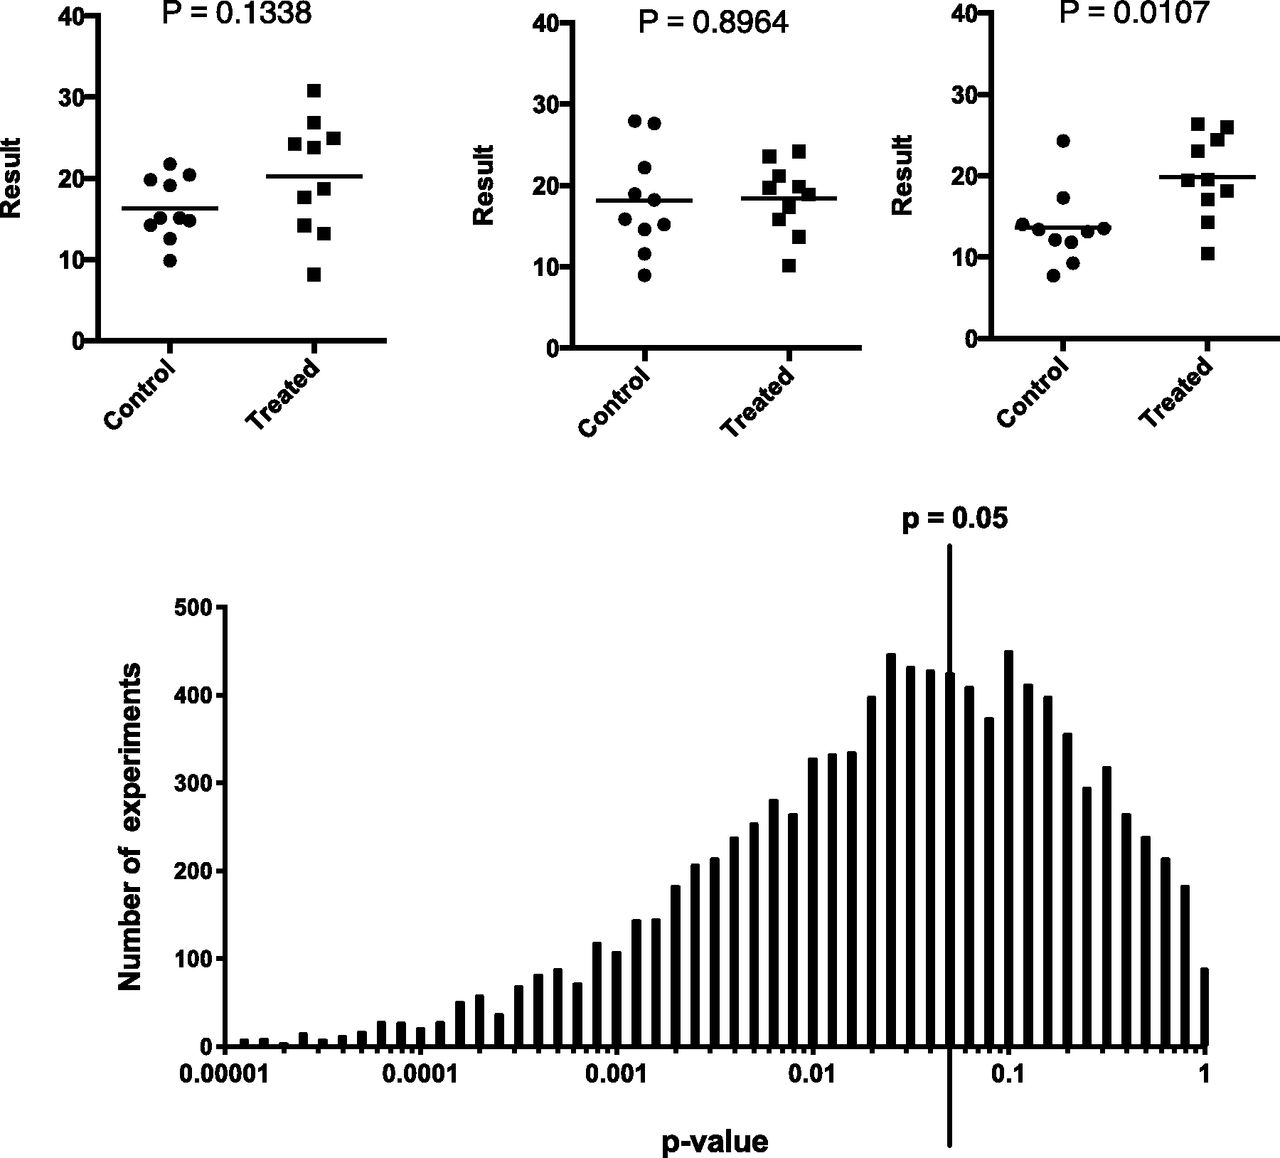
Variability of P values. If the null hypothesis is true, then the distribution of P values is uniform. Half the P values will be less than 0.50, 5% will be less than 0.05, etc. But what if the null hypothesis is false? The figure shows data randomly sampled from two Gaussian populations with the S.D. equal to 5.0 and populations means that differ by 5.0. Top: three simulated experiments. Bottom: the distribution of P values from 2500 such simulated experiments. Not counting the 2.5% highest and lowest P values, the middle 95% of the P values range from 0.00016 to 0.73, a range covering almost 3.5 orders of magnitude!
- Fig. 4.
Comparison of bar graph (mean and S.D.), box and whiskers, scatter plot, and violin plot for a large data set (n = 1335). Based on data showing number of micturitions in a group of patients seeking treatment (Amiri et al., 2018). Note that the scale of the y-axis is different for the bar graph than for the other graphs.
- Fig. 5.
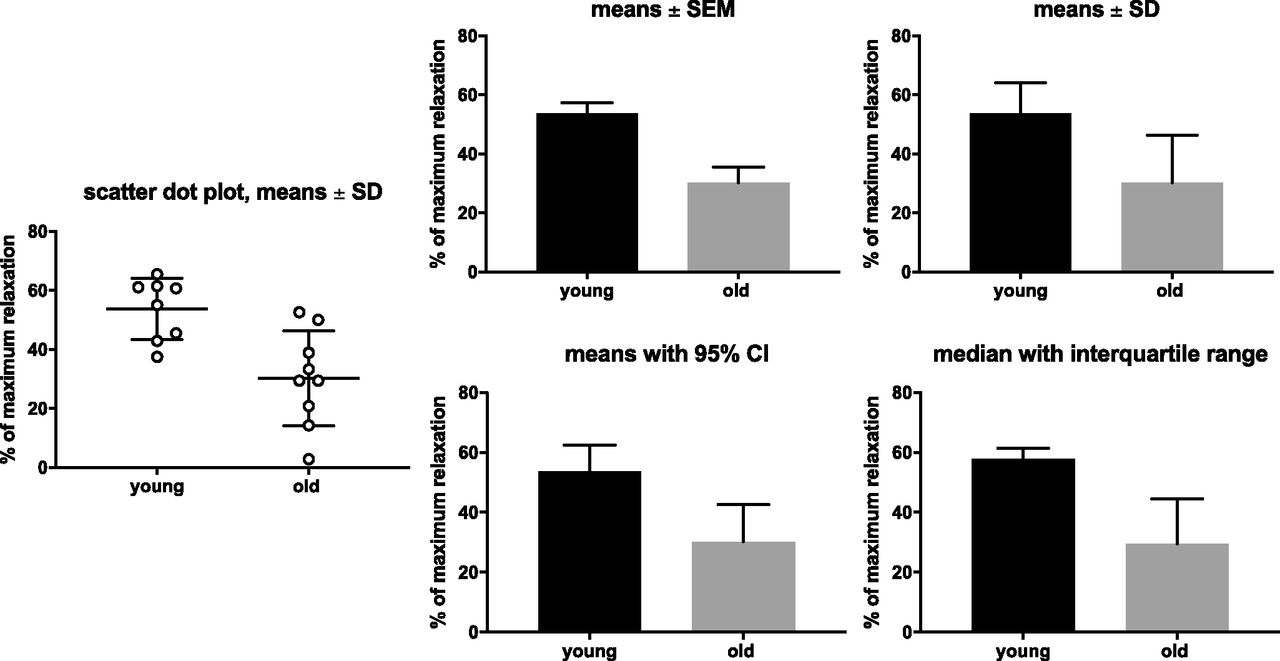
Comparison of error bars. Based on Frazier et al. (2006) showing maximum relaxation of rat urinary bladder by norepinephrine in young and old rats; the left panel shows the underlying raw data for comparison as scatter plot.
- Fig. 6.
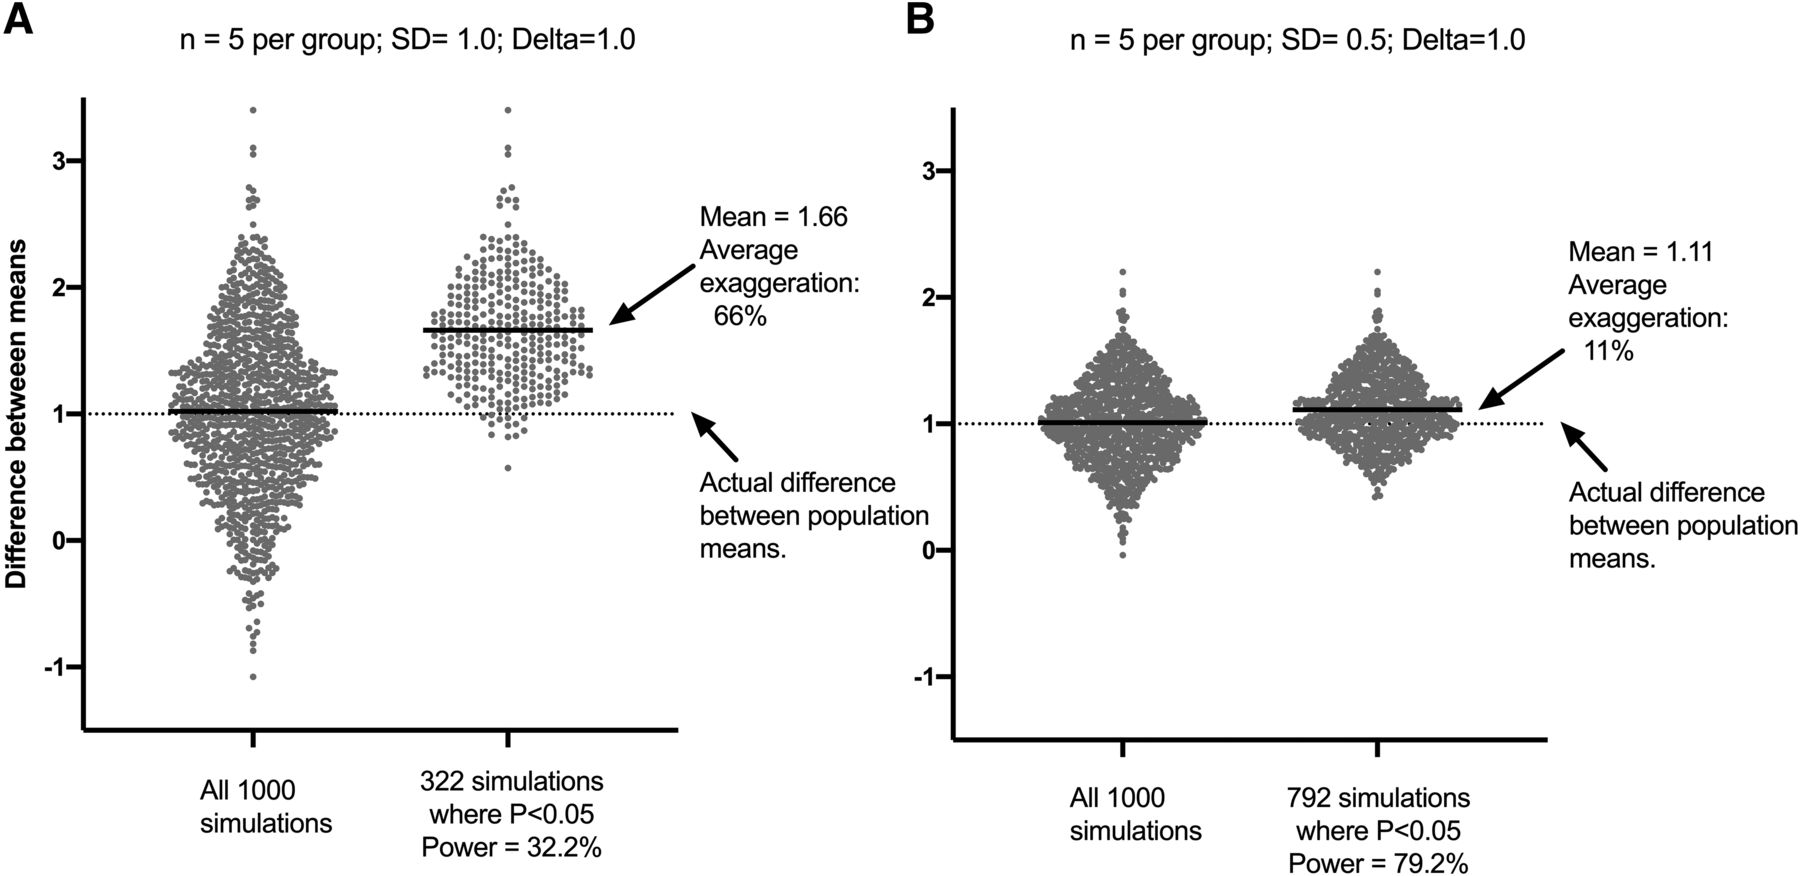
How P value selection from underpowered studies and publication bias conspire to overestimate effect size. The simulations draw random data from a Gaussian (normal) distribution. For controls, the theoretical mean is 4.0. For treated, the theoretical mean is 5.0. So, the true difference between population means is 1.0. The S.D. of both populations was set to 1.0 for the simulations in (A) and was set to 0.5 for those in (B). For each simulation, five replicates were randomly drawn for each population, an unpaired t test was run, and both the difference between means and the two-sided P value were tabulated. Each panel shows the results of 1000 simulated experiments. The left half of each panel shows the difference between means for all the simulated experiments. Half the simulated experiments have a difference greater than 1.0 (the simulated population difference), and half have a difference smaller than 1.0. There is more variation in (A) because the S.D. was higher. There are no surprises so far. The right half of each panel shows the differences between means only for the simulated experiments in which P < 0.05. In (A), this was 32% of the simulations. In other words, the power was 32%. In (B), there was less experimental scatter (lower S.D.), so the power was higher, and 79% of the simulated experiments had P < 0.05. Focus on (A). If the sample means were 4.0 and 5.0 and both sample S.D.s were 1.0 (in other words, if the sample means and S.D.s match the population exactly), the two-sided P value would be 0.1525. P will be less than 0.05 only when random sampling happens to put larger values in the treated group and smaller values in the control group (or random sampling leads to much smaller S.D.s). Therefore, when P < 0.05, almost all of the effect sizes (the symbols in the figure) are larger than the true (simulated) effect size (the dotted line at Y = 1.0). On average, the observed differences in (A) were 66% larger than the true population value. (B) shows that effect magnification also occurs, but to a lesser extent (11%), in an experimental design with higher power. If only experiments in which P < 0.05 (or any threshold) are tabulated or published, the observed effect is likely to be exaggerated, and this exaggeration is likely to be substantial when the power of the experimental design is low.
- Fig. 7.
Unpaired t test example.
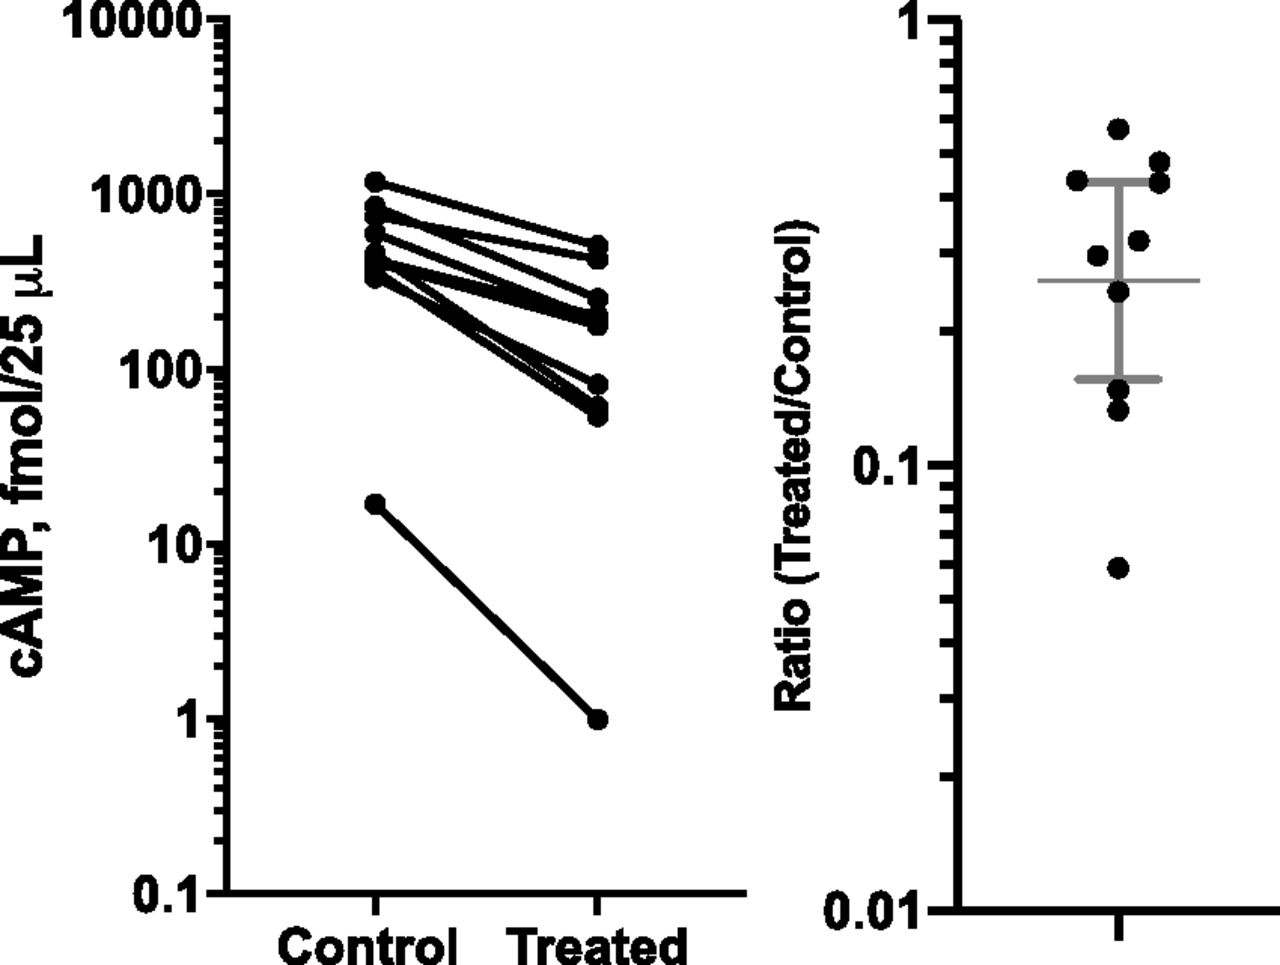
- Fig. 8.
Paired t test example.
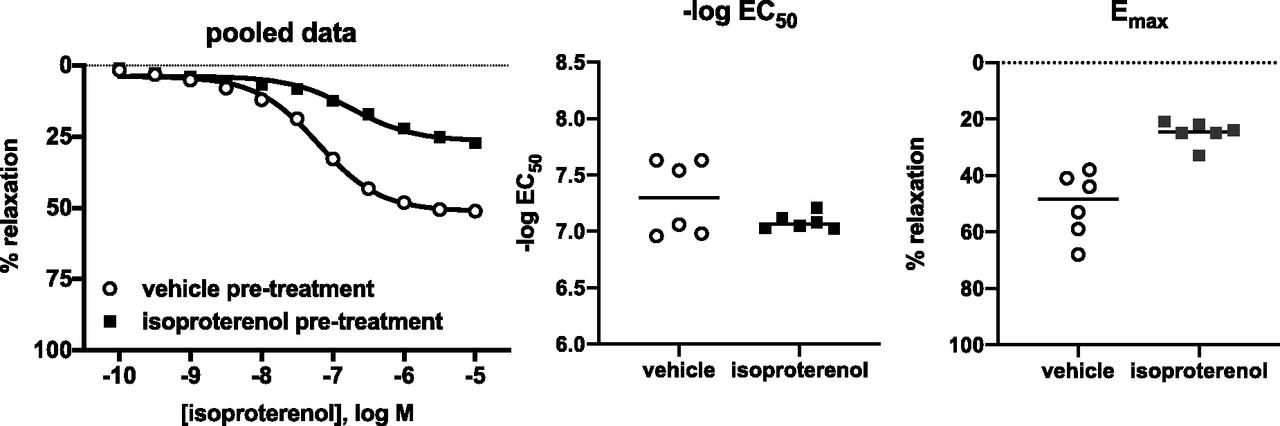
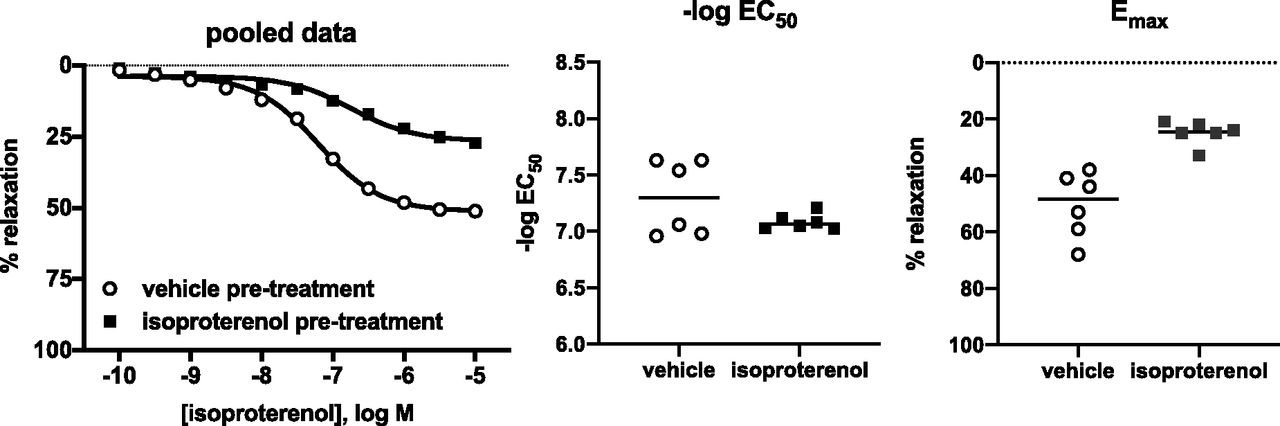
- Fig. 9.
Nonlinear regression example.
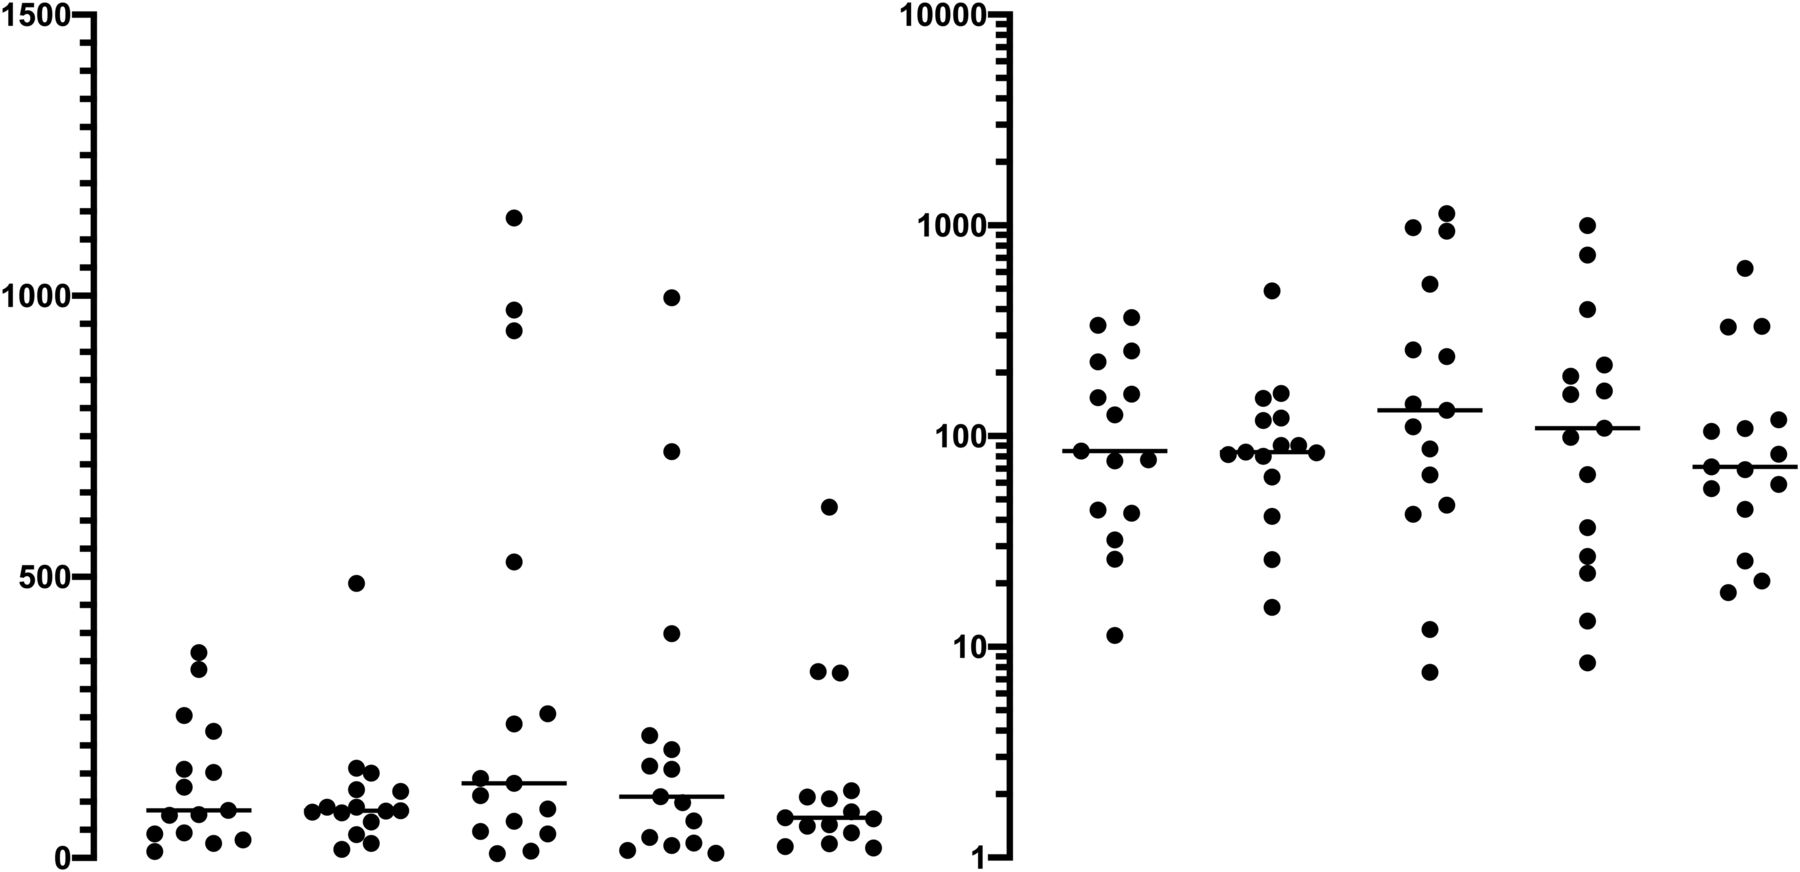
- Fig. 10.
Multiple comparisons example.


