


Article Figures & Data
Figures
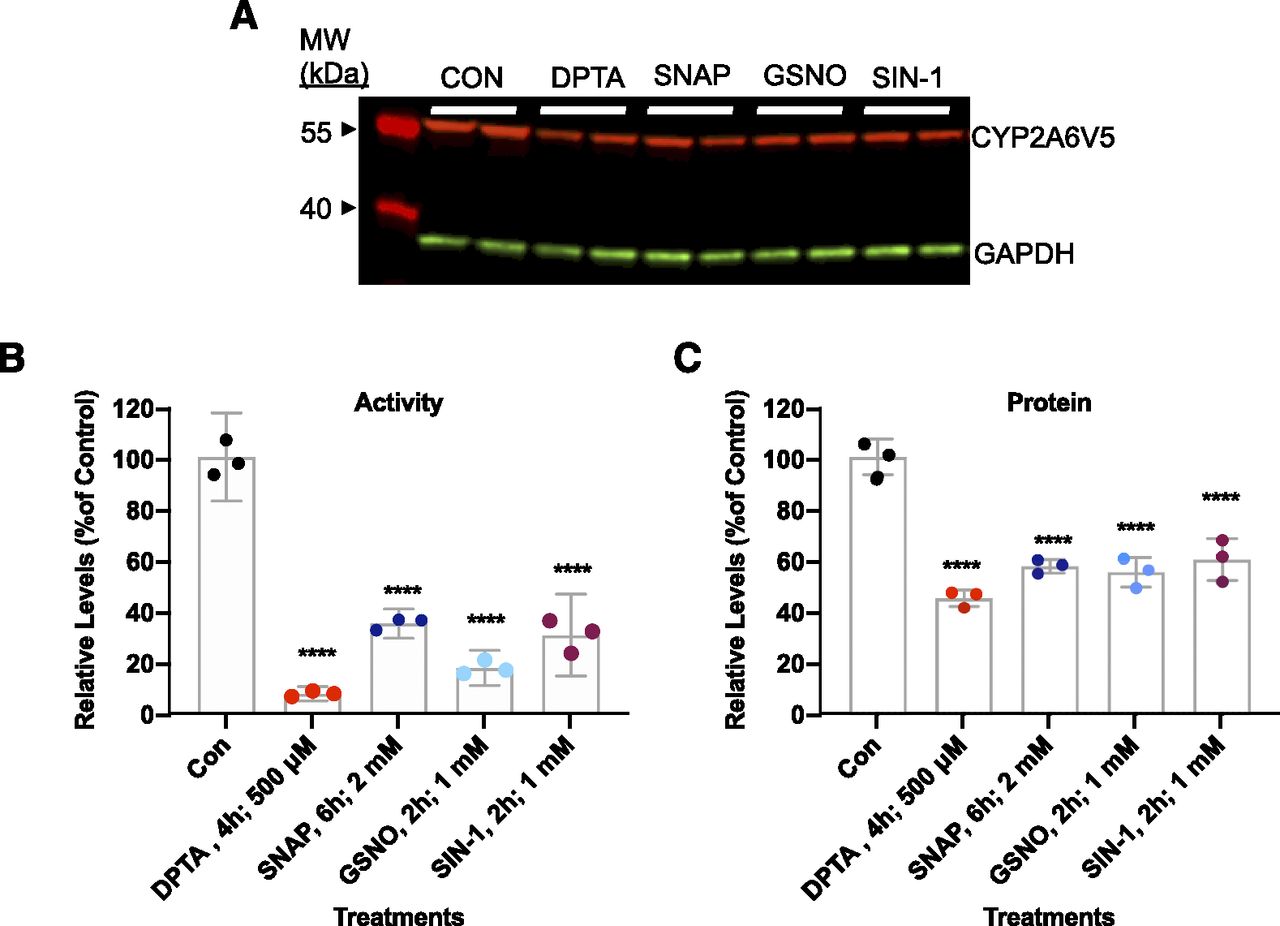
- Fig. 1.
Down-regulation of CYP2A6V5 by NO donors and endogenous NO in lentivirally transduced Huh7-CYP2A5V5 cells. Cells were exposed to DPTA, 500 µM for 4 hours; SNAP, 2 mM for 6 hours; GSNO, 1 mM for 2 hours; or SIN-1, 1 mM for 2 hours. After treatment, CYP2A6 activity was measured by 7-hydroxycoumarin formation; then total cell lysates were harvested and subjected to infrared fluorescence immunoblotting. (A) Representative Western blot of CYP2A6 protein. (B) Effect of NO donors on CYP2A6 activity. (C) Effect of NO donors on CYP2A6 protein. Individual data from three independent experiments are shown, as well as means and 95% confidence intervals for each group. Significance was measured relative to untreated control samples (CON) using a repeated measures one-way ANOVA (with treatment as a within-subjects factor) and Dunnett’s test. ****P < .0001. MW, molecular weight.
- Fig. 2.
Posttranslational down-regulation of CYP2A6 in Huh7-CYP2A6V5 cells. Huh7-CYP2A5V5 cells were treated with 500 µM DPTA in the presence or absence of 100 µg/ml cycloheximide (CHX) for 2- and 4-hour time periods. (A) Representative Western blot of CHX treatment of 2 and 4 hours. (B) CYP2A6 activity assay. (C) Protein levels were quantified by Western blot analysis. Significance was measured relative to untreated control samples (CON) for each respective time period of 2 or 4 hours. Individual data from three independent experiments are shown, as well as means and 95% confidence intervals for each group. Data were analyzed by repeated measures two-way ANOVA with time as a within-subjects factor and treatment as a between-subjects factor. P values (Tukey’s test) are shown for significant differences. ****P < 0.0001. MW, molecular weight.
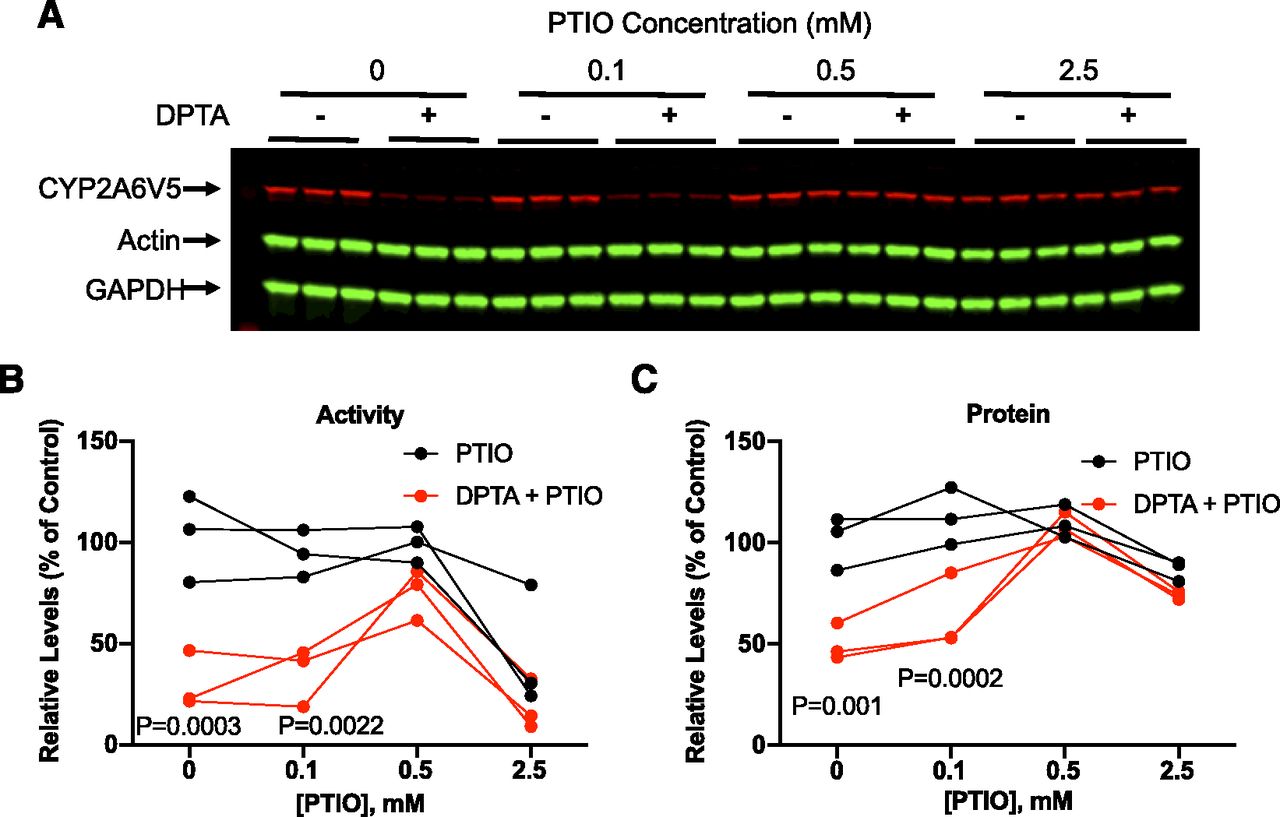
- Fig. 3.
Prevention of NO-induced down-regulation by PTIO. Huh7-2A6V5 cells were treated with PTIO or DPTA/PTIO for 4 hours. Enzyme activity of CYP2A6 was measured, and then total cell lysates were used for immunoblotting. (A) Western blot of CYP2A6 protein with increasing PTIO concentration (0, 0.1, 0.5, 2.5 mM) with and without DPTA (500 μM). GAPDH and actin control signal measurements are represented as the green signals. (B) CYP2A6 activity assay for PTIO and PTIO/DPTA treatments expressed as a percentage relative to PTIO samples. (C) Quantification of CYP2A6 protein level by Western blot analysis. Individual data from three independent experiments are shown. Data were analyzed by ordinary two-way ANOVA and Šídák’s test. P values for treatments found to be significantly different between PTIO without DPTA and PTIO with DPTA are shown.
- Fig. 4.
The effect of protease inhibitors on NO-induced down-regulation of CYP2A6V5. (A) Western blot of CYP2A6 protein exposed for 4 hours to various treatment conditions of 500 μM DPTA (D), 10 μM bortezomib (Bort), 20 μM MG132 (MG), 10 μM E64d (E), 10 mM 3MA, and 100 μM chloroquine (CQ). (B) Quantification of CYP2A6 activity. (C) Quantification of CYP2A6 protein. Protein level is expressed as a percentage relative to control protein levels (CON). Individual data from three independent experiments are shown, as well as means and 95% confidence intervals for each group. Repeated measures one-way ANOVA (with treatment as a within-subjects factor) and Šídák’s test were used to test for differences among treatment groups. a, significantly different from control cells; b, significantly different from cells treated with DPTA alone. P < 0.05. (D) Western blot detection of a high molecular mass signal by increasing the gain on the fluorescence intensity of (A). Results are the means ± S.D. of three independent experiments. MW, molecular weight.
- Fig. 5.
Enhancement of HMM species with proteasome inhibitors. Cells were treated with 500 μM DPTA (D), 10 μM bortezomib (Bort), 20 μM MG-132 (MG), or the indicated combinations for 2 hours. (A) Representative Western blot image of HMM species with respective treatments. (B) Quantification of CYP2A6 protein activity. (C) Quantification of CYP2A6 protein concentration data. (D) Quantification of HMM signal, with control levels arbitrarily set to 1. Individual data from three independent experiments are shown, as well as means and 95% confidence intervals for each group. Repeated measures one-way ANOVA (with treatment as a within-subjects factor) and Šídák’s test were used to test for differences among treatment groups. In (B and C), a = significantly different from control (CON), b = significantly different from DPTA alone; P < 0.05. In (D), a = significantly different from DPTA alone, b = significantly different from bortezomib alone (Bort), c = significantly different from MG132 alone (MG); P < 0.05. MW, molecular weight.
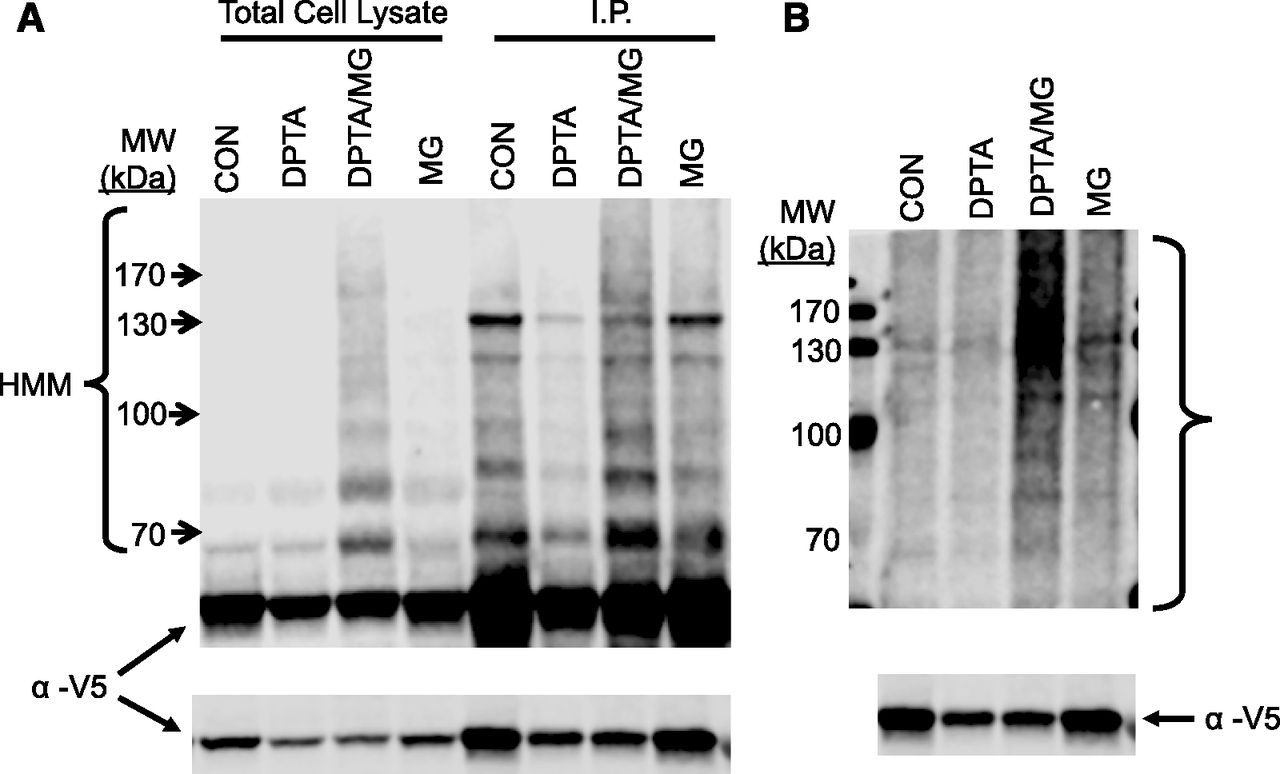
- Fig. 6.
Enhanced ubiquitination with cotreatment of DPTA and MG132. Cells were treated with either control medium (CON), DPTA (D; 500 μM), MG132 (MG; 20 μM), or DPTA + MG132 for 2 hours. Total cell lysates were prepared and subjected to immunoprecipitation with anti-V5 agarose beads (I.P.). (A) The cell lysates and immunoprecipitates were analyzed by Western blotting with anti-V5 antibodies to visualize CYP2A6V5 protein and its corresponding HMM species. (B) Western blot detection of polyubiquitinated CYP2A6. Immunoprecipitates were blotted and probed with anti-ubiquitin antibodies. Representative blots are shown, and the observations were conserved across three independent experiments. MW, molecular weight.
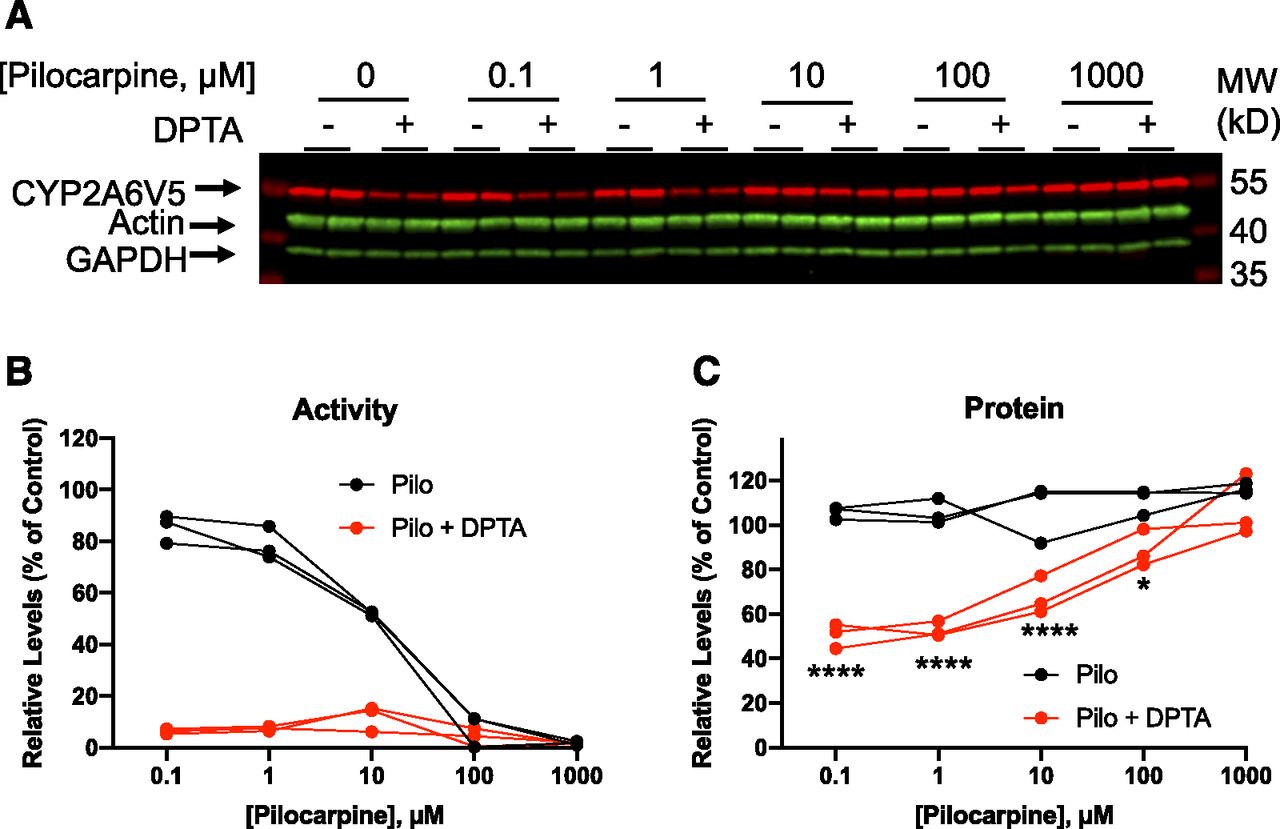
- Fig. 7.
Inhibition of CYP2A5 degradation by pilocarpine. Cells were treated with 500 μM DPTA with or without the indicated concentrations of pilocarpine (Pilo) for 4 hours. Enzyme activity of CYP2A6 was measured, and then total cell lysates were prepared for immunoblotting. (A) Western blot of CYP2A6 protein. (B) CYP2A6 activities expressed as a percentage relative to untreated samples. (C) Quantification of CYP2A6 protein level by Western blot analysis. Individual data from three independent experiments are shown. Data were analyzed by ordinary two-way ANOVA and Šídák’s test. *P = 0.0215; ****P < 0.0001 compared with pilocarpine alone. MW, molecular weight.
- Fig. 8.
Lack of inhibition of CYP2A6 degradation by methoxsalen. Cells were treated with the indicated concentrations of methoxsalen for 30 minutes. Media were replaced with fresh media containing methoxsalen with or without 500 μM DPTA, and the cells were incubated for another 4 hours. Enzyme activity of CYP2A6 was measured, and then total cell lysates were prepared for immunoblotting. (A) Western blot of CYP2A6 protein. (B) CYP2A6 activities expressed as a percentage relative to untreated samples. (C) Quantification of CYP2A6 protein level by Western blot analysis. Individual data from three independent experiments are shown. Protein data were analyzed by ordinary two-way ANOVA and Šídák’s test, and DPTA-treated cells were found to be significantly different (P < 0.0001) from DPTA + methoxsalen–treated cells at all methoxsalen concentrations. MW, molecular weight.


Additional Files
Data Supplement
- Supplemental Table -
Supplementary Table 1 - Statistical data and results.
- Supplemental Figure -
Supplementary Figure 1 - Huh7 cells expressing CYP2A6V5 were treated with 1µM methoxsalen for the indicated times.
- Supplemental Table -


