


Abstract
Isoniazid (INH), the mainstay therapeutic for tuberculosis infection, has been associated with rare but serious hepatotoxicity in the clinic. However, the mechanisms underlying inter-individual variability in the response to this drug have remained elusive. A genetically diverse mouse population model in combination with a systems biology approach was utilized to identify transcriptional changes, INH-responsive metabolites, and gene variants that contribute to the liver response in genetically sensitive individuals. Sensitive mouse strains developed severe microvesicular steatosis compared with corresponding vehicle control mice following 3 days of oral treatment with INH. Genes involved in mitochondrial dysfunction were enriched among liver transcripts altered with INH treatment. Those associated with INH treatment and susceptibility to INH-induced steatosis in the liver included apolipoprotein A-IV, lysosomal-associated membrane protein 1, and choline phosphotransferase 1. These alterations were accompanied by metabolomic changes including reduced levels of glutathione and the choline metabolites betaine and phosphocholine, suggesting that oxidative stress and reduced lipid export may additionally contribute to INH-induced steatosis. Finally, genome-wide association mapping revealed that polymorphisms in perilipin 2 were linked to increased triglyceride levels following INH treatment, implicating a role for inter-individual differences in lipid packaging in the susceptibility to INH-induced steatosis. Taken together, our data suggest that INH-induced steatosis is caused by not one, but multiple events involving lipid retention in the livers of genetically sensitive individuals. This work also highlights the value of using a mouse diversity panel to investigate drug-induced responses across a diverse population.
Tuberculosis (TB) is a life-threatening disease arising from Mycobacterium tuberculosis infection and the second leading cause of death worldwide (WHO, 2013). Although TB carries a high mortality rate, in part due to inaccessibility to therapeutics or noncompliance, the infection is curable with appropriate treatment. The mainstay therapeutic for treatment is isoniazid (INH), a potent bactericidal agent recognized as an effective therapy for TB since its introduction in 1952 (Jindani et al., 1980).
Clinical evidence has long demonstrated that INH can cause adverse side effects. These adverse responses reduce treatment efficacy by decreasing compliance, resulting in treatment failure, relapse, and/or drug resistance (Kopanoff et al., 1978). Hepatotoxicity is the predominant adverse side effect, with a high proportion of patients (approximately 10–20%) experiencing mild, transient elevations in aminotransferase levels. In rare instances, INH treatment has been associated with cases of acute liver failure with features of hepatitis and hepatic necrosis occurring at an incidence of 0.1–1% (Fountain et al., 2005; Kopanoff et al., 1978). There have also been case reports indicating that steatosis is present in livers of patients with hepatotoxicity arising from TB drug treatments that included INH (Pilheu et al., 1979; Pilheu et al., 1981). However, biopsies are not routinely taken for patients with liver injury and the incidence of INH-induced steatosis is not known.
The production of reactive metabolites from INH such as acetylhydrazine (Nelson et al., 1976) and hydrazine (Sarich et al., 1996) have been proposed to contribute to the toxicity. Changes in the liver metabolite profile with INH treatment may also occur due to INH-induced depletion of pyridoxal phosphate (PLP) (Sumner et al., 2010). However, the exact characteristics of idiosyncratic INH-induced hepatotoxicity have been challenging to reproduce in animal models. As result, the mechanisms associated with INH-induced liver injury are not well understood (Metushi et al., 2011).
Genetics is now recognized as a key factor in the toxicity and efficacy of pharmaceutical agents. Susceptibility to INH-induced hepatotoxicity has been linked with genetic factors such as the absence of HLA-DQA1*0102; the presence of HLA-DQB1*0201 alleles (Sharma et al., 2002); and polymorphisms in cytochrome P450 2E1 (CYP2E1), glutathione S-transferase mu 1 (GSTM1), and glutathione S-transferase theta 1 (GSTT1) (Tostmann et al., 2008). Slow acetylator variants of N-acetyltransferase 2 that reduce the metabolism of isoniazid to acetylisoniazid, and subsequently acetylhydrazine to the nontoxic metabolite diacetylhydrazine, may also contribute to INH toxicity (Huang et al., 2002). However, the predictive value and effect sizes of these markers in clinical practice have been low, indicating that additional factors must be required to influence susceptibility to INH-induced hepatotoxicity.
A mouse diversity panel (MDP) is a commercially available panel of well-characterized, inbred mouse strains (Bogue and Grubb, 2004; McClurg et al., 2007) with genetic diversity comparable with that observed in humans (Roberts et al., 2007). When strain-specific responses can be measured, an MDP can be utilized to elucidate the genetic basis for toxicity. An MDP has been used successfully to model drug-induced kidney injury resulting from treatment with DB289, a drug that caused renal toxicity in clinical trials that was not predicted in nonclinical safety studies (Harrill et al., 2012). An MDP was also utilized to identify a genetic variant associated with susceptibility to acetaminophen-induced liver injury in humans (Court et al., 2013; Harrill et al., 2009).
In the present study, a systems biology approach, integrating data obtained from multiple “omic” analyses, was employed to investigate genetic differences in INH-induced liver response using an MDP. Pharmacogenomic analysis of transcriptional changes and gene variants associated with the INH response, coupled with metabolomics analysis of liver tissue, were utilized to identify factors potentiating INH-induced microvesicular steatosis in the livers of genetically sensitive mouse strains.
MATERIALS AND METHODS
Animals
Female mice aged 6–8 weeks were purchased from the Jackson Laboratory (129S1/SvlmJ, A/J, AKR/J, BALB/cJ, BTBR T+tf/J, BUB/BnJ, C3H/HeJ, C57BL/6J, C57BLKS/J, C57BR/cdJ, C58/J, CBA/J, CE/J, DBA/2J, FVB/NJ, I/LnJ, KK/HIJ, LG/J, LP/J, MA/MyJ, MRL/MpJ, NOD/ShiLtJ, NON/ShiLtJ, NOR/LtJ, NZW/LacJ, P/J, PL/J, PWK/PhJ, RIIIS/J, SEA/GnJ, SJL/J, SM/J, SWR/J, WSB/EiJ) and housed in polycarbonate cages on a 12-h light-dark cycle in a specific-pathogen free facility. Mice were provided NIH-07 diet (Zeigler Brothers) ad libitum, with the exception of an 18-h fast preceding drug treatment (for liver glutathione depletion) and an additional 18-h fast immediately prior to euthanasia (for liver glycogen depletion). Care of mice followed institutional guidelines under a protocol approved by The Hamner Institutes’ Institutional Animal Care and Use Committee.
Experimental design
Mice were randomized by body weight into treatment groups (N = 4 per group per strain) and dosed intragastrically (ig) with 100 mg/kg INH (Fisher Scientific) or vehicle (sterile water) once daily for 3 days in a dosing volume of 10 ml/kg. The first day of dosing was designated as day 1. Dosing was performed at the same time of day throughout the study to avoid diurnal variability. On day 4, animals were weighed and administered an intraperitoneal (i.p.) injection of pentobarbital sodium (150 mg/kg) to induce deep anesthesia. Blood was collected via cardiac puncture. Livers were quickly excised and weighed. Sections of the left liver lobe were placed in 10% phosphate buffered formalin for histological analyses. The remaining tissue was snap-frozen in liquid nitrogen and stored at −80ºC.
Of the 272 animals included in the initial study, 13 INH-treated animals died prematurely; these animals were therefore excluded from data analysis. Animals (and total number) that were excluded came from the following strains: LP/J (one), PL/J (one), SM/J (two), NON/LtJ (one), LG/J (one), MA/MyJ (two), RIIIS/J (one), SEA/GnJ (two), A/J (two). The majority of INH-treated P/J and WSB/EiJ animals died prematurely in the study and therefore these strains were not included in subsequent analyses. The cause of death was not determined, but was not attributed to liver injury, and was not associated with preceding clinical symptoms.
Liver histopathology
Formalin-fixed liver tissue was paraffin-embedded, cut into 5-μm sections, and stained with hematoxylin and eosin (H&E). H&E stained slides were microscopically examined and scored by a certified veterinary pathologist blinded to treatment (Experimental Pathology Laboratories, Inc.). Significance was assessed between control and treated animals of the same strain. The following grading guidelines were applied to histopathologic findings in this project: Grade 0: none, Grade 1: minimal, Grade 2: slight/mild, Grade 3: moderate, Grade 4: moderately severe, Grade 5: severe/high.
Adipophilin immunohistochemistry
Five micron sections were cut from formalin-fixed, paraffin-embedded liver tissue and mounted on positively charged microscopic slides. Paraffin was removed and slides hydrated by passing through a series of xylenes and graded alcohols to distilled water. Sections were then pre-treated with a citrate buffer, pH 6.0 (Chemicon) using a vegetable steamer at 96°C for 20 min. Slides were removed and cooled on the lab bench for an additional 20 min. All immunohistochemical steps were performed on an automated Dako Autostainer. Endogenous peroxidase was blocked by incubation in 3.0% hydrogen peroxide (aq) for 10 min, whereas endogenous biotin was blocked utilizing Dako's Biotin Blocking System. Additional blocking steps included a 20-min incubation with Dako serum-free protein block. Guinea pig anti-adipohilin antibody (Progen) was applied at a dilution of 1:10,000 for 60 min at room temperature. Additional slides were processed using antibody diluent without the adipophilin antibody as a negative control. A biotinylated goat anti-guinea pig IgG antibody (Vector Laboratories) was applied at a dilution of 1:150 for 45 min followed by detection with Vector's Elite ABC kit for 30 min. Positive staining was visualized using Dako's Liquid DAB+ for 5 min. Slides were scanned on a Hamamatsu Nanozoomer whole slide digital scanner and images were evaluated by a certified veterinary pathologist who was blinded to treatment (Pfizer).
Liver triglyceride measurements
Liver triglyceride levels were quantified using approximately 50 mg of frozen tissue obtained from the left lobe of the liver homogenized in a solution of 5% NP-40. Twice homogenized tissue was heated to 80–100°C until NP-40 became cloudy and then cooled to room temperature. Following this cycle of heating and cooling, samples were centrifuged to remove debris and diluted (1:10) in dH2O. Diluted samples were assayed with the Triglyceride Quantification Kit (AbCam) using the manufacturer's recommendations.
Gene expression analysis
RNA was isolated from approximately 15 mg of liver tissue using an RNeasy total RNA isolation kit (Qiagen) according to manufacturer's instructions. RNA was quantified on a NanoDrop ND-1000 spectrophotometer (Thermo Scientific) and quality was verified with an Agilent 2100 Bioanalyzer (Agilent Technologies). RNA was determined to be of good quality for use in microarray hybridizations if the RNA integrity number was 8 or higher. The GeneChip 3′ IVT Express Kit (Affymetrix) was utilized to generate fragmented, biotin-labeled aRNA which was subsequently hybridized to the GeneChip Mouse Genome 430 2.0 Array using the GeneChip Hybridization, Wash, and Stain Kit (Affymetrix) according to manufacturer's instructions. Following hybridization, arrays were washed and stained using standard Affymetrix procedures before scanning on an Affymetrix GeneChip Scanner.
Due to the potential for single-nucleotide polymorphisms (SNPs) across the MDP to affect microarray probe binding and confound expression analysis (Alberts et al., 2007), individual probes overlapping SNPs in the inbred strains were removed from the dataset prior to analysis. Briefly, Affymetrix Mouse Genome 430 2.0 probe sequences were aligned to the NCBI Build 37 version of the mouse genome as part of the AceView annotation project (Thierry-Mieg and Theirry-Mieg, 2006), and genomic locations were downloaded from AceView (http://www.ncbi.nlm.nih.gov/IEB/Research/Acembly/; version from 24 April 2008). Probes overlapping SNPs in the MDP strains were identified using the SNPtools package (version 1.01) in R (http://cran.r-project.org) and removed from further analysis. Remaining intensity ratios were RMA (Robust Multi-array Analysis) transformed using the Affymetrix Power Tools (APT version 1.14.2) program, apt-probeset-summarize. Array data were then analyzed using Partek Genomics Suite (version 6.6). Pathways enriched among statistically significant (p < 0.05), differentially expressed genes in the data were identified using the Tox Analysis module in Ingenuity Pathway Analysis (Ingenuity Systems; Build version: 261899; Content version: 17199142). High-quality RNA could not be isolated from the liver of I/LnJ animals, therefore this strain was excluded from the microarray analysis. Gene expression data generated for this manuscript can be downloaded in its entirety from the Gene Expression Omnibus repository under the accession number GSE55489. All data are MIAME compliant.
Metabolomics
INH- and vehicle-treated animals from three drug-sensitive mouse strains with INH-induced steatosis severity scores of 2–5 (NOR/LtJ, DBA/J, and LG/J), and two strains with INH-induced steatosis severity scores of 0–1 (NON/ShiLtJ and C57BR/cdJ), were selected for analysis of metabolites in liver tissue. Sample preparation, data acquisition, and processing for metabolomic analysis were carried out as consistent with previous studies (Sumner et al., 2010). Data were acquired on a Bruker Avance III 700 MHz Nuclear Magnetic Resonance (NMR) spectrometer equipped with a cryoprobe, and a Bruker SampleJet autosampler. Briefly, 1H NMR spectra were acquired using the first increment of a NOESY sequence, with a 100 ms mixing time, 2 s relaxation delay, a spectral width of 16 ppm, 32,768 data points, and 32 transients. Raw NMR data were processed by applying a line broadening factor of 0.5 Hz to the free induction decay, zero filling to double the data points to approximately 64,000, and applying Fourier transformation after exponential multiplication. Processed NMR data were binned by steatosis severity score (low or high), and the integrals were normalized to the total intensity of each spectrum. Multivariate analysis of binned data was performed using orthogonal partial least squares discriminant analysis (OPLS-DA) using SIMCA 13.0 (Umetrics), and statistical significance was determined using a Student's t-test.
Liver and serum cholesterol measurements
Liver cholesterol and serum LDL/VLDL levels were measured in the same animals used for the metabolomics experiments. Liver cholesterol was measured with the Advia 2400 clinical chemistry analyzer utilizing the Cholesterol_2 Reagent (Siemens Healthcare Diagnostic Inc.) according to the manufacturer's recommendations. Serum LDL/VLDL was measured using the EnzyChrom AF HDL and LDL/VLDL Assay Kit (BioAssay Systems) according to manufacturer's instructions.
Quantitative Trait Locus mapping
Quantitative Trait Locus (QTL) mapping was performed using SNPster, which incorporates a haplotype mapping approach over inferred three-SNP haplotypes (McClurg et al., 2007). Triglyceride fold change was mapped using a 623,046 SNP dataset, and all data were log transformed prior to analysis. The association scores, –log(p) values, from the analysis were plotted across the mouse genome using the RGenetics package in Galaxy (http://main.g2.bx.psu.edu/, accessed 3 September 2013). Results were reported for putative QTLs above an arbitrarily defined threshold set at –log(p) > 3.5. For every putative QTL, corresponding locations (Mb) were calculated as previously described (McLachlan et al., 2011). Briefly, each putative QTL was expanded to the left and right for as long as the association score was >2 (or by at least 100 kb). If two putative QTLs overlapped or were <1 Mb apart they were considered to be one signal. Quantitative trait genes (QTGs) were identified with the UCSC Genome Browser (http://genome.ucsc.edu) using NCBI mouse genome build 37. SNPs within QTGs were identified using the Imputed Mouse SNP Resource (http://csbio.unc.edu/imputation/#tools, accessed 3 September 2013).
Statistical methods
Phenotypic values are expressed as the mean ± standard error (SE). Differences between treatment groups, steatosis groups, and genotypes were determined using a two-tailed Student's t-test or a Mann Whitney U-test using GraphPad Prism 5 (GraphPad Software). Statistical outcomes were considered significant when the p value was <0.05. Gene expression differences were determined using an analysis of variance (ANOVA) model or linear regression analysis in Partek Genomics Suite. Analysis of gene expression changes associated with susceptibility to INH-induced steatosis in the MDP included the fixed categorical factors of strains (resistant vs. susceptible to INH-induced steatosis) and treatment (vehicle vs. INH), as well as the random factor scan date, to control for batch effects. Statistical outcomes for mRNA expression data were considered significant when the Bonferroni corrected p value was <0.05.
RESULTS
INH-Induced Microvesicular Steatosis in Sensitive Inbred Mouse Strains
Histopathological analysis identified the presence of significantly augmented levels of hepatocytic cytoplasmic microvesiculation in 14/32 (44%) strains treated with INH compared with vehicle-treated controls (Fig. 1A). The variability in the INH-induced response suggested a genetic contribution to the phenotype, and pathological interpretation of these findings identified the vesiculation as reflective of effects on lipid transport or metabolism and indicative of steatosis. To confirm this interpretation, adipophilin immunohistochemistry was performed, identifying microvesicles containing neutral lipids, on the liver sections from all vehicle- and INH-treated animals in the study. In agreement with the original findings, adipophilin staining demonstrated a high degree of inter-strain variability (Supplementary Data). Furthermore, severity scores from the adipophilin-stained slides were significantly correlated with severity scores derived from the H&E stained slides (Spearman r = 0.4297, p < 0.0001; Supplementary Data), thus confirming the steatotic nature of the microvesicles.
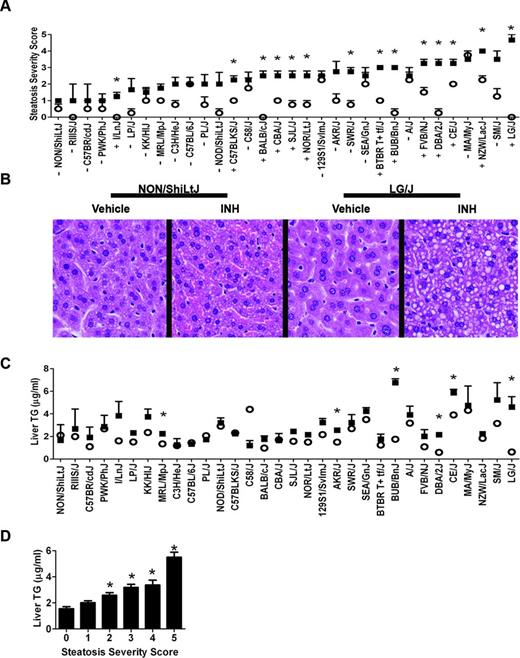
INH induces inter-strain variations in hepatocytic microvesicular steatosis and triglyceride accumulation. (A) Microvesicular steatosis severity scores for vehicle- (white circles) and INH-treated (black squares) animals. Data are represented as mean ± SE for N = 4 mice per treatment and strain, except for strains noted in the Materials and Methods section. Strains are ordered from left to right by increasing average severity score for the INH-treated animals. *p < 0.05 indicates the difference between vehicle- and INH-treated animals. +/- identifies strains sensitive and resistant to INH-induced steatosis as determined by significance following a Mann-Whitney U-test. (B) Representative photomicrographs (400X) of liver tissue from vehicle- and INH-treated animals in the NON/ShiLtJ and LG/J strains. (C) Liver triglyceride (TG) levels for vehicle- (white circles) and INH-treated (black squares) animals. Data are represented as mean ± SE for N = 4 mice per treatment and strain, except for strains noted in the Materials and Methods section. Strains are ordered from left to right by increasing average microvesicular steatosis severity scores for the INH-treated animals. *p < 0.05 indicates the difference between vehicle- and INH-treated animals. Significance was evaluated by a Student's t-test. (D) Triglyceride concentrations for vehicle- and INH-treated mice were binned according to microvesicular steatosis severity score. Values represent mean ± SE of liver triglyceride concentrations. Individual means across all strains for each bin were statistically significant (one-way ANOVA). Post hoc statistical significance was determined using a Tukey's multiple comparison test. *p < 0.001 indicates the difference relative to severity scores of 0.
Strains identified as genetically resistant (-) and genetically sensitive (+) to INH-induced microvesicular steatosis by statistical comparison of severity scores between vehicle- and INH-treated animals (p < 0.05) are indicated in Figure 1A. Representative light photomicrographs of the H&E stained liver tissue illustrating the difference in microvesicular accumulation between resistant (NON/ShiLtJ) and sensitive (LG/J) strains are shown in Figure 1B. Sensitivity to INH-induced elevations in liver triglyceride values also varied by strain (Fig. 1C) and the values were significantly correlated with the steatosis severity scores (Spearman r = 0.5143, p <0.0001; Fig. 1D).
As INH is known to inhibit the assay for alanine aminotransferase, the microRNA (miR) miR-122 was quantified as a surrogate marker for liver injury (Wang et al., 2009). Consistent with the microscopic findings, which did not indicate serious liver injury, miR-122 was not significantly elevated with INH treatment in this study (data not shown).
Determination of Gene Expression Changes Associated with Treatment and Steatosis
To elucidate the factors contributing to INH-induced steatosis, mRNA expression analysis was performed in liver tissue derived from all vehicle- and INH-treated animals in the study. An ANOVA model using the fixed categorical factors of strain (resistant vs. sensitive to INH-induced steatosis; − and + designated strains from Fig. 1A, respectively) and treatment (vehicle vs. INH) was then applied to the intensity data to determine which transcripts were significantly altered for each experimental factor individually or in concert (Fig. 2A). This approach allowed for the identification of genes that distinguish sensitive and resistant strains, independently of INH treatment, as the resulting gene signatures may play a role in genetic susceptibility to INH-induced steatosis.
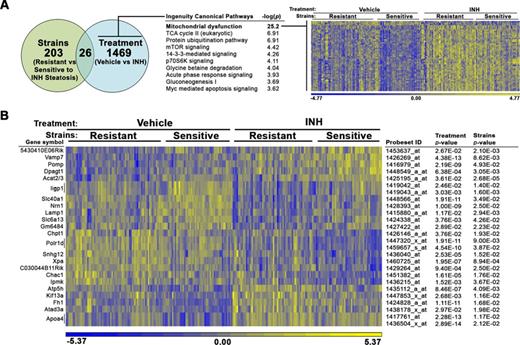
Gene expression analysis identifies mitochondrial transcript changes associated with INH treatment. mRNA expression analysis was performed in liver tissue derived from all vehicle- and INH-treated animals in the study. An ANOVA model using the fixed categorical factors strains (resistant vs sensitive to INH-induced microveiscular steatosis) and treatment (vehicle vs. INH) was then applied to the intensity data to determine which probesets were significantly altered by each experimental factor individually or in concert. (A) The number of probesets significantly altered by sensitivity to steatosis and treatment is depicted in a Venn diagram. Canonical pathways enriched among genes significantly associated with treatment (p < 0.05) but not strains (p > 0.05) were identified using the Tox Analysis feature in IPA. The top 10 pathways are represented. Relative gene expression changes in the top pathway, mitochondrial dysfunction (bold), are represented in a heat map. (B) A heat map representing relative gene expression changes the 26 probesets significantly altered by both factors: strains and treatment. The color scales for both heat maps represent the relative ratio of log2 (intensity).
A total of 203 probesets detected differences in mRNA expression between strains that were genetically resistant or sensitive to INH-induced steatosis (p < 0.05), but for which INH treatment itself (p > 0.05) did not affect expression, indicating that these genes differed in basal expression by genetic background. Canonical pathways enriched among significant genes in the dataset were identified using the Tox Analysis feature in IPA. The top enriched pathways are reported in Supplementary Data.
A total of 1469 probesets detected expression of mRNAs that were altered by INH treatment universally, regardless of strain sensitivity, indicating that these genes are responsive to treatment independent of genetic background. The mitochondrial dysfunction pathway was the top enriched pathway among these genes with a −log(p) value of 25.2 (Fig. 2A). A heat map was used to visualize the gene expression changes of transcripts in the mitochondrial dysfunction pathway across individual animals in the different treatment and strain sensitivity categories (Fig. 2A). The majority of the genes in this pathway (94%) were increased with treatment. Genes significantly altered by treatment included in the mitochondrial dysfunction pathway are described in Supplementary Data.
In order to determine which gene expression changes were critical for the development of INH-induced steatosis in sensitive strains, the 26 probesets detecting genes significantly altered by both factors—treatment and sensitivity to steatosis—were then interrogated (Fig. 2B). Due to the low number of significant genes, pathway analysis using IPA was unproductive, yielding several pathways that included only a single gene. Therefore, the list of probesets significantly associated with treatment and genetic susceptibility to steatosis was manually examined for biologically plausible candidates related to INH-induced steatosis. Genes involved in lipid metabolism and export, such as apolipoprotein A-IV (Apoa4), lysosomal-associated membrane protein 1 (Lamp1), and choline phosphotransferase 1 (Chpt1) are relevant to the steatosis finding. Relative to MDP strains resistant to INH-induced steatosis, sensitive strains had significantly elevated levels of Lamp1 and significantly reduced levels of Apoa4 and Chpt1.
Detection of Altered Metabolites Associated with INH-Induced Steatosis
In order to gain further mechanistic insight into the processes underlying INH-induced steatosis, hepatic metabolites were evaluated in a subset of mouse strains. Liver tissue from all animals in two drug-resistant strains (steatosis score in INH-treated animals of 0–1; NON/ShiLtJ, C57BR/cdJ) and three drug-sensitive strains (steatosis score in INH-treated animals of 2–5; NOR/LtJ, DBA/2J, and LG/J) was utilized for metabolomics analysis. Interpretation of these data was conducted using OPLS-DA supervised statistical modeling that separated vehicle-treated and low-scoring INH-treated animals from animals with high levels of INH-induced steatosis. Selected variable importance plots were used to identify metabolites that were significantly altered in animals with a high degree of INH-induced steatosis (Table 1). Metabolites involved in choline metabolism—betaine and phosphocholine—as well as the antioxidant glutathione were significantly decreased in the livers of mice that were genetically sensitive to INH-induced steatosis.
Metabolites Significant for Separation of Microvesicular Steatosis Severity Scores
| Metabolite | p value | Incr/Decr | Metabolite | p value | Incr/Decr |
|---|---|---|---|---|---|
| 2-Aminoadipate | <0.050 | Incr | Lactate | <0.100 | Decr |
| 3-Hydroxybutyrate | <0.100 | Decr | Leucine | <0.100 | Decr |
| Acetate | <0.100 | Decr | Lipoproteins | <0.100 | Incr |
| Adenine | <0.100 | Decr | O-Phosphocholine/O-acetylcholine/sn-glycerophosphocholine/carnitine | <0.005 | Decr |
| Alanine | <0.050 | Decr | Ornithine | <0.100 | Decr |
| Ascorbate | <0.010 | Decr | Phenylalanine | <0.005 | Decr |
| Betaine/TMAO | <0.050 | Decr | Serine | <0.100 | Decr |
| Cadaverine | <0.005 | Decr | Taurine | <0.100 | Decr |
| Fumarate | <0.001 | Decr | Tyrosine | <0.100 | Decr |
| Glucose | <0.010 | Decr | Unknown (0.79, 0.83 ppm) | NS | Incr |
| Glutamine | <0.100 | Incr | Unknown (3.16 ppm) | <0.005 | Incr |
| Glutathione | <0.100 | Decr | Unknown (3.28 ppm) | <0.100 | Incr |
| Glycylproline | <0.005 | Decr | Unsaturated lipids | <0.100 | Incr |
| Homoserine | <0.100 | Incr | Valine | <0.100 | Decr |
| Isoleucine | <0.050 | Decr |
Notes. Two drug-resistant strains (microvesicular steatosis severity score in INH-treated animals of 0–1; NON/ShiLtJ, C57BR/cdJ) and three drug-sensitive strains (microvesicular steatosis severity score in INH-treated animals of 2–5; NOR/LtJ, DBA/J, and LG/J) were selected for evaluation of metabolic profiling of liver tissue. All animals were binned according to low (0–1) or high (2–5) severity score and OPLS-DA analysis was performed to identify the metabolites most necessary to facilitate separation between the groups. The metabolite increase (Incr) or decrease (Decr) is listed for high microvesicular steatosis severity score animals in comparison to low microvesicular steatosis severity score animals. Significance was calculated using Student's t-test. NS: not significant at threshold of p < 0.1.
| Metabolite | p value | Incr/Decr | Metabolite | p value | Incr/Decr |
|---|---|---|---|---|---|
| 2-Aminoadipate | <0.050 | Incr | Lactate | <0.100 | Decr |
| 3-Hydroxybutyrate | <0.100 | Decr | Leucine | <0.100 | Decr |
| Acetate | <0.100 | Decr | Lipoproteins | <0.100 | Incr |
| Adenine | <0.100 | Decr | O-Phosphocholine/O-acetylcholine/sn-glycerophosphocholine/carnitine | <0.005 | Decr |
| Alanine | <0.050 | Decr | Ornithine | <0.100 | Decr |
| Ascorbate | <0.010 | Decr | Phenylalanine | <0.005 | Decr |
| Betaine/TMAO | <0.050 | Decr | Serine | <0.100 | Decr |
| Cadaverine | <0.005 | Decr | Taurine | <0.100 | Decr |
| Fumarate | <0.001 | Decr | Tyrosine | <0.100 | Decr |
| Glucose | <0.010 | Decr | Unknown (0.79, 0.83 ppm) | NS | Incr |
| Glutamine | <0.100 | Incr | Unknown (3.16 ppm) | <0.005 | Incr |
| Glutathione | <0.100 | Decr | Unknown (3.28 ppm) | <0.100 | Incr |
| Glycylproline | <0.005 | Decr | Unsaturated lipids | <0.100 | Incr |
| Homoserine | <0.100 | Incr | Valine | <0.100 | Decr |
| Isoleucine | <0.050 | Decr |
Notes. Two drug-resistant strains (microvesicular steatosis severity score in INH-treated animals of 0–1; NON/ShiLtJ, C57BR/cdJ) and three drug-sensitive strains (microvesicular steatosis severity score in INH-treated animals of 2–5; NOR/LtJ, DBA/J, and LG/J) were selected for evaluation of metabolic profiling of liver tissue. All animals were binned according to low (0–1) or high (2–5) severity score and OPLS-DA analysis was performed to identify the metabolites most necessary to facilitate separation between the groups. The metabolite increase (Incr) or decrease (Decr) is listed for high microvesicular steatosis severity score animals in comparison to low microvesicular steatosis severity score animals. Significance was calculated using Student's t-test. NS: not significant at threshold of p < 0.1.
Increased Liver Cholesterol and Reduced Serum VLDL/LDL Indicate that Choline Reduction May Contribute to Steatosis
Choline metabolism in the liver is essential for the packaging and export of triglycerides in VLDL (Corbin and Zeisel, 2012). As a result, decreased choline levels can increase liver cholesterol while decreasing serum LDL/VLDL (Yao and Vance, 1990). To investigate whether steatosis observed with INH treatment was related to alterations in choline metabolism, liver cholesterol and serum LDL/VLDL levels were measured in INH- and vehicle-treated animals from the three mouse strains genetically sensitive to INH-induced steatosis (NOR/LtJ, DBA/2J, and LG/J) and the two strains resistant to INH-induced steatosis (NON/ShiLtJ, C57BR/cdJ) previously analyzed in the metabolomics experiment. All animals were binned based on pathology severity scores (low steatosis: 0–1 or high steatosis: 2–5). Animals with a high steatosis severity score had significantly increased liver cholesterol (Fig. 3A) and decreased serum LDL/VLDL (Fig. 3B) relative to animals with low steatosis severity scores.
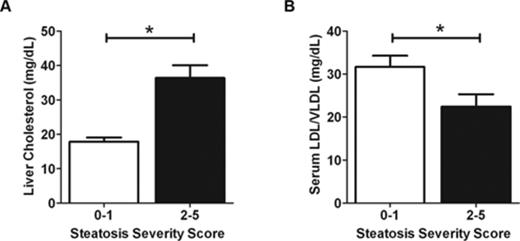
Liver cholesterol and serum LDL/VLDL concentrations in select strains binned by microvesicular steatosis severity scores. (A) Liver cholesterol and (B) serum LDL/VLDL evaluated from two drug-resistant strains (steatosis severity score in INH-treated animals of 0–1; NON/ShiLtJ, C57BR/cdJ) and three drug-sensitive strains (microvesicular steatosis severity score in INH-treated animals of 2–5; NOR/LtJ, DBA/J, and LG/J). All animals were binned according to low (0–1) or high (2–5) severity scores as done for analysis of metabolomics data. Data are represented as mean ± SE. *p < 0.05 indicates the difference between groups as assessed by a Student's t-test.
Identification of Genetic Variants Associated with INH-Induced Steatosis
Finally, QTL mapping was performed in order to determine genomic variants that are associated with the steatosis observed in susceptible strains following treatment with INH. Because steatosis severity score is an ordinal and qualitative variable, mapping was performed using the fold change of the significantly correlated variable, liver triglyceride levels (Fig. 1C). Four significantly associated QTLs were identified (Fig. 4A), and genomic regions were interrogated for biologically relevant QTGs (Fig. 4B). A candidate gene, Perilipin 2 (Plin2), was identified within a significant QTL region on chromosome 4. Plin2, also known as adipophilin, is a protein that coats lipid droplets, protecting triglycerides from hydrolysis by lipases (Heid et al., 1998).
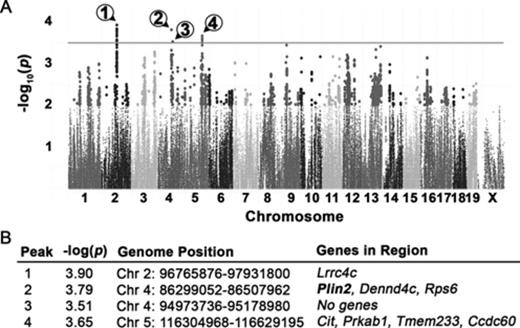
GWA mapping using average fold change in liver triglyceride identifies QTLs associated with sensitivity to INH-induced microvesicular steatosis. (A) Manhattan plot of haplotype associations. Black line indicates the threshold for significance, −log10(p) = 3.5. Circled numbers identify the QTL peaks. (B) QTL regions identified by GWA mapping. Plin2 (bold) was selected for further analysis.
SNPs in Plin2 are Associated with INH-Induced Steatosis
SNPs within Plin2 were identified using the Imputed Mouse SNP Resource (http://csbio.unc.edu/imputation/#tools) (Wang et al., 2012). For two Plin2 SNPs in linkage with one another, rs220668384 and rs232770786, INH-induced triglyceride fold change was significantly lower in strains that are homozygous for the minor allele (p < 0.05) (Fig. 5A). Plin2 transcript levels were then examined using the microarray data collected for transcriptomics analysis. Strains homozygous for the minor allele of these SNPs also had significantly lower INH-induced fold change in Plin2 mRNA expression levels (p < 0.05) (Fig. 5B). Finally, adipophilin (which is another name for the protein product of Plin2) immunohistochemistry severity scores were examined by allele call. Interestingly, strains containing the major allele had significantly increased severity scores for adipophilin staining in INH-treated animals relative to vehicle-treated controls (p < 0.05) (Fig. 5C).
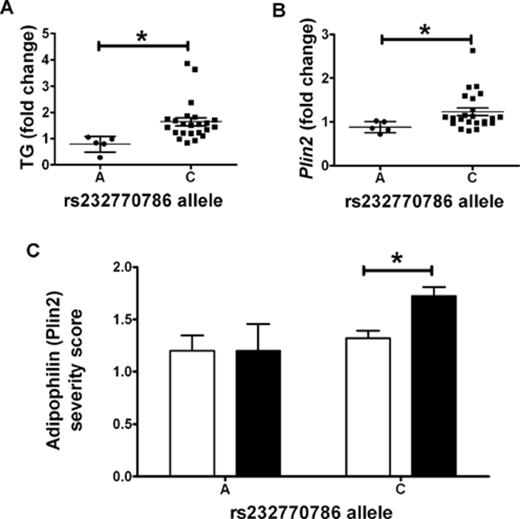
Polymorphisms in Plin2 are associated with INH-induced lipid accumulation in the liver. (A) Average INH-induced liver triglyceride (TG) fold change and (B) average INH-induced Plin2 gene expression fold change for each strain are plotted by genotype. (C) Severity scores for adipophilin (Plin2) staining evaluated in liver tissue for vehicle-treated (white bars) and INH-treated (black bars) mice are plotted by genotype. Data are represented as mean ± SE. *p < 0.05 indicates the difference between groups as assessed by a Student's t-test.
DISCUSSION
In this study, genetic variation was shown to play a role in the development of hepatic microvesicular steatosis caused by INH. The finding of steatosis in the MDP was not unexpected, given that rodents have been shown previously to develop steatosis following administration of INH (Sumner et al., 2010).
Fatty liver changes are often an early sign of liver complications and can progress to hepatitis and liver necrosis when left untreated, although subsequent propagating events are typically required (Day and James, 1998). The possibility exists that patients receiving INH do initially experience steatosis but have progressed to overt liver damage by the time a problem is identified in the clinic. The second “hit” in this case may be the result of toxic INH metabolites which have been studied and reviewed elsewhere (Metushi et al., 2011). Of note, starvation is a known transcriptional activator of CYP2E1, an enzyme involved in the metabolism of INH intermediates (Hong et al., 1987; Tostmann et al., 2008). Given that all animals in this study, regardless of treatment, were fasted prior to initial compound administration, and again prior to necropsy, the contribution that CYP2E1 induction may have had on the observed phenotype cannot be determined. Interestingly, previously reported human variants, like those identified in CYP2E1, were not found to be associated with susceptibility to steatosis in this mouse model. This may be the result of weak associations of these factors with INH toxicity in humans or differences in the mapped phenotypes between the studies (i.e., serum aminotransferase levels or clinical outcome vs. steatosis).
Transcriptomics analysis was performed to better understand mechanisms underlying the INH-induced steatosis observed in this study. An interesting finding was the enrichment of the mitochondrial dysfunction pathway among genes that were significantly altered by INH treatment but that were not different between strains sensitive and resistant to INH-induced steatosis. Previous studies have demonstrated that INH and its hydrazine metabolite interfere with mitochondrial function (Boelsterli and Lee, 2014; Lee et al., 2013). Furthermore, there is in vitro evidence to suggest that hydrazine specifically inhibits electron transport chain complex II activity, but that a second hit (i.e., complex I inhibition) would be required to cause hepatocellular damage (Lee et al., 2013). Whereas some caution is warranted in extrapolating in vitro findings to whole organisms, our in vivo study indicates that all strains, regardless of liver response, exhibited INH-induced transcriptional changes in mitochondrial genes. Of note is that the majority (94%) of genes in the mitochondrial dysfunction pathway were upregulated in our model. Increased levels of mitochondrial genes could be due to mitochondrial biogenesis which is both an indication of cell stress and a mechanism by which cells counteract the effects of mitochondrial damage (Degli Esposti et al., 2012).
Although it should be noted that only a single dose and duration of INH exposure was evaluated, statistical analysis was performed to identify gene expression changes that were not only different with treatment, but that also differentiated susceptible and resistant strains independent of treatment. Gene expression changes that exist under basal conditions that are then further altered with treatment may provide a basis for initiation and propagation of INH-induced steatosis. Of the significantly altered genes displaying overlap between categorical factors (sensitivity to INH-induced steatosis and INH treatment itself), interesting candidates relevant to the phenotype were Apoa4, Lamp1, and Chpt1. Apoa4 is a glycoprotein present on lipoparticles that is involved in lipid packaging, export, and metabolism (VerHague et al., 2013). Increased levels of Apoa4 in mouse liver enhances triglyceride secretion and reduces hepatic lipid content (VerHague et al., 2013). Whereas INH treatment universally increased Apoa4 levels, this transcript was significantly lower in strains with INH-induced steatosis relative to those without this response. Lower Apoa4 levels could limit triglyceride secretion in these sensitive strains and lead to retention of neutral lipid.
Conversely, although Lamp1 was decreased with treatment, its levels were higher in strains genetically sensitive to INH-induced steatosis. Greater transcript abundance of the Lamp1 gene among strains with this response may be particularly interesting given that Lamp1 is an integral membrane glycoprotein that mediates LDL uptake in the liver (Hamer et al., 2012). Lamp1 has also been shown to be upregulated in liver biopsies of patients with cholesterol ester storage disease (Hulkova and Elleder, 2012). Additionally, Lamp1 has been shown to regulate autophagy via its role in fusing autophagosomes with endosomes and lysosomes to facilitate degradation (Corcelle et al., 2009). The upregulation of mitochondrial genes could be indicative of increased mitochondrial turnover, of which Lamp1 would be a key mediator. Whereas direct evidence of mitochondrial autophagy is lacking in the present analysis, warranting further study, several studies have implicated mitochondrial stress as a contributing pathway in INH-induced liver injury (reviewed in Boelsterli and Lee, 2014).
Chpt1 catalyzes phosphatidylcholine biosynthesis from CDP-choline. Phosphatidylcholine is an essential component of VLDL, required for transport of fatty acids out of the liver (Corbin and Zeisel, 2012). The secretion of VLDL is impaired when phosphatidylcholine production is restricted, and this effect has been demonstrated to cause steatosis (Corbin and Zeisel, 2012). INH is known to deplete vitamin B6 (PLP) activity, and vitamin B6 deficiency has been shown to reduce phosphatidylcholine levels in the liver (She et al., 1995). Chpt1 was decreased in strains sensitive to INH-induced steatosis that may further decrease phosphatidylcholine levels and promote triglyceride accumulation.
Further evidence for the involvement of perturbations in choline metabolism in INH-induced steatosis comes from metabolomic analysis. Both betaine and phosphocholine, metabolites that contribute to the production of phosphatidylcholine from choline, were decreased in the livers of strains exhibiting high steatosis severity scores. Genetic variation contributes to individual differences in the dietary requirement for choline (Corbin and Zeisel, 2012). It is plausible that genetic differences in sensitivity to perturbations in choline metabolism could contribute to INH-induced steatosis in genetically sensitive individuals. Severe choline deficiency is linked to the progression of nonalcoholic fatty liver disease through the perturbation of mitochondrial bioenergetics and fatty acid beta-oxidation (Corbin and Zeisel, 2012). This alteration in mitochondrial metabolism can lead to mitochondrial dysfunction and oxidative damage (Corbin and Zeisel, 2012). Although the metabolite differences observed in the current study may provide an indication of precursor events in INH-induced injury, it should be noted that severe liver injury (i.e., necrosis) was not observed in this study, and further investigation is needed to identify key downstream events leading to INH-induced hepatocellular death.
Betaine can also support synthesis of methionine and homocysteine, which in turn support synthesis of cysteine and glutathione levels (Mosharov et al., 2000). Therefore, the reduced levels of glutathione (GSH) observed in mice with a greater degree of steatosis may be due to aberrations in the homocysteine-dependent transsulfation pathway that contributes to the intracellular GSH pool (Mosharov et al., 2000). Supporting this hypothesis, GSH levels were decreased in the livers of strains with high steatosis severity scores, and GSH depletion with INH treatment has been previously reported (Hussain and Frazier, 2002). Ascorbate, which is a complementary antioxidant to GSH, was also decreased in the livers of mouse strains with INH-induced steatosis, potentially providing indirect evidence of intracellular oxidative stress. Transcriptomic analysis indicated that genes in the D-glucuronate degradation pathway were upregulated in sensitive strains, independently of treatment. Elevations in L-gluconate 3-dehydrogenase, for instance, may drive D-glucoronic acid metabolism toward the pentose phosphate pathway instead of toward ascorbate production, thus reducing the basal capacity to buffer against INH-induced oxidative stress in the sensitive strains.
A recent publication examined alterations in the metabolic profile following the development of INH-induced steatosis in Sprague Dawley rats (Sumner et al., 2010). Differences in ascorbate metabolism were identified between rats treated with INH for 1 day compared with rats treated for 8 days. However, differences in metabolites downstream of choline metabolism were not identified (Sumner et al., 2010). This observation may be explained by species and strain differences between the two studies. The observation that rats exhibited steatosis, without reduction in betaine and phosphocholine, suggests that multiple pathways may contribute to lipid accumulation in the liver following treatment with INH. However, it should be noted that the extent of INH metabolism and covalent binding with cellular proteins is more similar between mice and humans than it is between rats and humans, suggesting that the mouse may be a more appropriate rodent model to study mechanisms of INH-induced liver injury (Metushi et al., 2012).
In this study, genetic variations in Plin2 contributing to increased Plin2 expression were also associated with increased severity of the steatosis outcome following INH treatment. Plin2 is a protein that coats lipid droplets in multiple cell types, including hepatocytes, and is important for the regulation lipid storage and metabolism (Heid et al., 1998). In mice, ablation of Plin2 results in reduced hepatic triglyceride content, resistance to the development of fatty liver disease, and enhanced VLDL secretion (McManaman et al., 2013). Conversely, elevated expression of Plin2 has been measured in the livers of rodents on a high fat diet and in patients with fatty liver disease in the clinic (Motomura et al., 2006). More importantly, polymorphisms in Plin2 have been found to affect lipid accumulation, metabolism, and obesity in humans (Magné et al., 2013). It is possible that SNPs within Plin2 contribute to elevated Plin2 expression and enhanced lipid droplet formation with INH treatment. Additional work is necessary to confirm this hypothesis.
In conclusion, this study demonstrated that in genetically diverse mice, INH causes microvesicular steatosis in some but not all mouse strains, suggesting that genetic variation plays a role in the liver response to this drug. Taken together, a mechanism is proposed in which INH-induced steatosis is caused by not one, but multiple events involving inhibition of lipid export by INH (Fig. 6). These events may contribute to the microvesicular lipid accumulation that occurs in the liver due to INH exposure in genetically sensitive individuals.
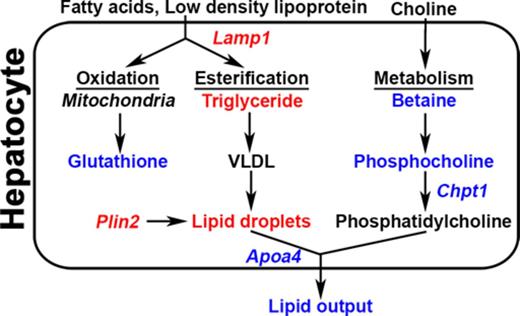
Schematic for INH-induced lipid accumulation in genetically sensitive mouse strains. Transcriptomic analysis identified that transcriptional changes in Apoa4 and Lamp1 are associated with INH-induced microvesicular steatosis in sensitive strains. As a result, triglyceride levels are increased due to increased lipoprotein uptake and decreased lipid export. Triglycerides and sterols are then directed toward packaging in lipoproteins and lipid droplets. Transcriptomic and metabolomic analysis indicated decreased phosphatidylcholine biosynthesis due to lower levels of Chpt1, reducing the capacity for lipoprotein packing and favoring lipid droplet formation. QTL analysis identified polymorphisms in Plin2 that may inhibit lipid droplet hydrolysis resulting in lipid droplet accumulation and steatosis. Points at which INH may affect these processes by increasing (red) or decreasing (blue) key metabolites and transcripts are highlighted.
FUNDING
Pfizer, Inc.; AstraZeneca. miRNA assessments were supported by Janssen. Affymetrix microarrays were donated by Pfizer, AstraZeneca, and Lilly via a collaborative effort through the International Life Sciences Institute Health and Environmental Sciences Institute (ILSI HESI) Technical Committee for the Application of Genomics to Mechanism-Based Risk Assessment.
The authors wish to acknowledge Yvonne Dragan of AstraZeneca, David Threadgill of North Carolina University, and James Stevens of Lilly for helpful discussions and their support of these studies; Thomas Urban and Nanye Long of Duke University for data analysis regarding the association of SNP variants; Rebecca Helm of the University of Arkansas for Medical Sciences for editorial assistance with manuscript preparation, and the ILSI HESI membership for technical guidance as well as their critical reviews and helpful comments toward preparing this manuscript.
These authors contributed equally to this study as first authors.
These authors contributed equally to this study as senior authors.
REFERENCES

Comments