


Abstract
High doses of sodium phenobarbital (NaPB), a constitutive androstane receptor (CAR) activator, have been shown to produce hepatocellular tumors in rodents by a mitogenic mode of action (MOA) involving CAR activation. The effect of 1-week dietary treatment with NaPB on liver weight and histopathology, hepatic CYP2B enzyme activity and CYP2B/3A mRNA expression, replicative DNA synthesis and selected genes related to cell proliferation, and functional transcriptomic and metabolomic analyses was studied in male CD-1 mice, Wistar Hannover (WH) rats, and chimeric mice with human hepatocytes. The treatment of chimeric mice with 1000–1500-ppm NaPB resulted in plasma levels around 3–5-fold higher than those observed in human subjects given therapeutic doses of NaPB. NaPB produced dose-dependent increases in hepatic CYP2B activity and CYP2B/3A mRNA levels in all animal models. Integrated functional metabolomic and transcriptomic analyses demonstrated that the responses to NaPB in the human liver were clearly different from those in rodents. Although NaPB produced a dose-dependent increase in hepatocyte replicative DNA synthesis in CD-1 mice and WH rats, no increase in replicative DNA synthesis was observed in human hepatocyte-originated areas of chimeric mice. In addition, treatment with NaPB had no effect on Ki-67, PCNA, GADD45β, and MDM2 mRNA expression in chimeric mice, whereas significant increases were observed in CD-1 mice and/or WH rats. However, increases in hepatocyte replicative DNA synthesis were observed in chimeric mice both in vivo and in vitro after treatment epidermal growth factor. Thus, although NaPB could activate CAR in both rodent and human hepatocytes, NaPB did not increase replicative DNA synthesis in human hepatocytes of chimeric mice, whereas it was mitogenic to rat and mouse hepatocytes. As human hepatocytes are refractory to the mitogenic effects of NaPB, the MOA for NaPB-induced rodent liver tumor formation is thus not relevant for humans.
Many studies have shown that phenobarbital (PB) and/or its sodium salt (sodium phenobarbital; NaPB) can produce liver tumors in rats and mice (IARC, 2001; Whysner et al., 1996). In recent years, an evolving framework for analyzing the modes of action (MOAs) by which chemicals produce tumors in rodents and the relevance of such tumor data for human risk assessment have been developed through the International Life Sciences Institute (ILSI) (Cohen et al., 2004; Meek et al., 2003) and the International Programme on Chemical Safety (IPCS) (Boobis et al., 2006; Sonich-Mullin et al., 2001). An MOA has been defined as a “biologically plausible sequence of key events leading to an observed effect supported by robust experimental observations and mechanistic data”(Boobis et al., 2006).
PB is not a genotoxic agent (IARC, 2001; Whysner et al., 1996). The MOA for rodent liver tumor formation by PB and related compounds is considered to involve activation of the constitutive androstane receptor (CAR), which results in a pleiotropic response (Cohen, 2010; Elcombe et al., 2014; Holsapple et al., 2006; Lake, 2009). In a recent evaluation of the MOA for PB-induced rodent liver tumor formation, the key events in the MOA were considered to be CAR activation, altered gene expression specific to CAR activation, increased cell proliferation, and the development of altered hepatic foci leading to liver tumor formation (Elcombe et al., 2014). In addition, associative events including the induction of cytochrome P450 (CYP) enzymes (in particular the CYP2B subfamily enzymes), liver hypertrophy (increased liver weight and hepatocellular hypertrophy), and inhibition of apoptosis were also identified (Elcombe et al., 2014). A key event is an empirically observable causal precursor step to the adverse outcome that is itself a necessary element of the MOA (Boobis et al., 2006; Elcombe et al., 2014; Meek et al., 2003; Sonich-Mullin et al., 2001). Key events are required events for the MOA, but often are not sufficient to induce the adverse outcome in the absence of other key events; whereas associative events are biological processes that are themselves not causal necessary key events for the MOA, but are reliable indicators or markers for key events. Associative events can often be used as surrogate markers for a key event in an MOA evaluation or as indicators of exposure to a xenobiotic that has stimulated the molecular initiating event or a key event.
CAR is the molecular target of PB and activation of this receptor is an essential requirement for liver tumor development (Elcombe et al., 2014; Huang et al., 2005; Wei et al., 2000; Yamamoto et al., 2004). A number of studies have shown that the CAR is present in the human liver and that the receptor can be activated by various drugs and chemicals, including PB (Elcombe et al., 2014; Molnar et al., 2013; Moore et al., 2003). In terms of the human relevance of the MOA for PB-induced rodent liver tumor formation, the key species difference is that although PB stimulates replicative DNA synthesis in rodent hepatocytes, such effects are not observed in cultured human hepatocytes (Elcombe et al., 2014; Hirose et al., 2009; Lake, 2009; Parzefall et al., 1991). Based on these data, evaluation utilizing the ILSI/IPCS framework (Boobis et al., 2006) demonstrates that the MOA for PB-induced liver carcinogenicity is not relevant for humans (Cohen, 2010; Elcombe et al., 2014; Holsapple et al., 2006; Lake, 2009).
In addition to the use of hepatocyte culture systems, if the key species difference in PB-stimulated hepatocyte replicative DNA synthesis could be evaluated in an in vivo experiment, the results obtained would provide important data for the human risk assessment of CAR activators like PB. One possible in vivo system for such a study is the use of humanized mice (Foster et al., 2014; Kitamura and Sugihara, 2014). Recently, mice with human hepatocyte chimeric livers have been produced by transplanting human hepatocytes into albumin enhancer/promoter-driven urokinase-type plasminogen activator-transgenic severe combined immunodeficient (uPA/SCID) mice with liver disease (Tateno et al., 2004, 2013). The host mouse hepatocytes are replaced with human hepatocytes in the livers of the chimeric mice to the degree indicated by the replacement index, which is the occupancy ratio of the human hepatocyte area to the total (human and mouse) area on histological sections. In some cases, the replacement index in these mice can be as high as 96%. The transplanted human hepatocytes express mRNA for a variety of human drug-metabolizing enzymes and transporters, in a manner similar to that of the donor liver (Tateno et al., 2004, 2013). Chimeric mouse livers constructed with human hepatocytes contain a small percentage of mouse hepatocytes and mouse hepatic sinusoidal cells (mainly Kupffer cells, endothelial cells, and stellate cells). Human hepatocytes have been shown to cooperate with mouse hepatic sinusoidal cells in liver functions such as enzyme induction (Tateno et al., 2004) and viral infection (Mercer et al., 2001). Interestingly, human hepatocytes in the livers of chimeric mice are also susceptible to growth-enhancing activities. The treatment of chimeric mice with human growth hormone (GH) increases the repopulation speed and the replacement index of transplanted human hepatocytes, as determined by increased replicative DNA synthesis and the upregulation of GH-related signaling molecules (Masumoto et al., 2007). Furthermore, partial hepatectomy also enhances hepatocellular proliferation in chimeric mice (Tateno, personal communication). These findings thus suggest that transplanted human hepatocytes in chimeric mice are responsive to hepatocyte mitogens.
The objective of the present study was to examine whether studies with chimeric mice with humanized liver could provide further support for previous evaluations of the MOA for PB-induced rodent liver tumor formation which have concluded that this mitogenic MOA is not relevant for humans (Cohen, 2010; Elcombe et al., 2014; Holsapple et al., 2006; Lake, 2009). The effects of NaPB treatment on key and associative events observed at the early phase of treatment were compared in CD-1 mice, Wistar Hannover (WH) rats, and in chimeric mice with humanized liver. In addition, integrated functional metabolomic and transcriptomic analyses were also conducted in order to evaluate species differences between mouse, rat, and human hepatocytes in response to NaPB treatment. Finally, in order to determine whether transplanted human hepatocytes in chimeric mice are responsive to a hepatocyte mitogen, we examined the effect of human epidermal growth factor (hEGF) in both in vivo and in vitro studies.
MATERIALS AND METHODS
Test Chemical
NaPB (Lot No. TLQ4248; purity, 98.0%; storage condition, room temperature) was purchased from Wako Pure Chemical Industries, Ltd (Osaka, Japan).
Animals and Husbandry
All experiments were performed in accordance with The Guide for Animal Care and Use of Sumitomo Chemical Co., Ltd, The Guide for Biosafety of Sumitomo Chemical Co., Ltd; or with the ethical approval of the PhoenixBio Ethics Board.
Experiments in CD-1 mouse and WH rat
Male Crlj:CD1(ICR) mice aged 9 weeks and male HarlanRCCHanTM:WIST rats (WH rats) aged 9 weeks were purchased from Charles River Japan, Inc., Hino Breeding Center (Shiga, Japan) and Japan Laboratory Animals, Inc., Hanno Breeding Center (Saitama, Japan), respectively. The animals were acclimatized to laboratory conditions for 7 days prior to dosing, and treatment was commenced at the age of 10 weeks. The animals were housed in a barrier-maintained animal room. During the course of the study, the environmental conditions in the animal room were set to maintain a temperature range of 22–26°C and a relative humidity range of 40–70%, with frequent ventilation (more than 10 times per hour) and a 12-h light (8:00–20:00)/12-h dark (20:00–8:00) illumination cycle. A commercially available pulverized diet (CRF-1; Oriental Yeast Co., Ltd, Tokyo) and filtered tap water were provided ad libitum throughout the study. The animals were not fasted overnight prior to sacrifice.
Experiment in the chimeric mouse with humanized liver
The in-life phase of the experiment using chimeric mice and SCID mice was performed at PhoenixBio Co., Ltd (Higashihiroshima, Japan). Chimeric mice with human hepatocytes (PXB mouse®, PhoenixBio Co., Ltd) were produced as previously described (Tateno et al., 2004, 2013). Briefly, human hepatocytes were transferred to homozygotic uPA/SCID mice aged 20–30 days as donor cells for the chimeric mice. Cryopreserved human hepatocytes from a healthy 2-year-old Hispanic girl (cause of death, motor vehicle accident; non-smoker; serologically negative for HIV1 and 2, HTVL 1 and 2, HBV, and HCV), purchased from BD Biosciences, San Jose, CA, were selected for transplantation, because cells from young subjects are more responsive to stimulation of hepatocellular proliferation (Masumoto et al., 2007). For transplantation, vials of cryopreserved human hepatocytes (5–15 × 106 cells/vial) were thawed and transplanted into 20–60 uPA/SCID mice (2.5 × 10⁵ viable cells/mouse). Because the human albumin (hAlb) concentration in mouse blood correlates well with the replacement index (Tateno et al., 2004), the hAlb concentration in the blood samples was measured to predict the replacement index of human hepatocytes in mouse livers. The range of replacement indices in chimeric mice used in the present study was 73–90%, and the group mean values were not different between groups, being 80%, 82%, 82%, and 76% for mice receiving 0, 500, 1000, and 1500-ppm NaPB, respectively. Chimeric mice have previously been shown to have almost confluent human hepatocytes at 64 days and 81 days after transplantation (Tateno et al., 2004). To reduce possible variation of background levels of replicative DNA synthesis, treatment with NaPB was commenced approximately 70 days after transplantation (animal age 14 weeks). Human hepatocytes in chimeric mice are considered to be deficient in GH because the human GH receptor is unresponsive to mouse GH (Souza et al., 1995). Due to a lack of human GH in chimeric mice, the chimeric mouse liver spontaneously becomes fatty in the human hepatocyte regions about 70 days after transplantation (Tateno et al., 2011). Therefore, to mimic the normal in vivo condition and to decrease steatosis, Alzet minipumps (Model 1002, Alzet Corporation, Palo Alto, CA) containing recombinant human GH (Wako Pure Chemical Industries Ltd.), with a release rate of 2.05 μg/h, were implanted in the subcutaneous tissue of mice under isoflurane anesthesia on the day prior to 7 days before the commencement of NaPB treatment. As shown below, because hEGF increased 5-bromo-2'-deoxy-uridine (BrdU) labeling in chimeric mice under the similar study conditions, human GH administration is unlikely to be a confounding factor in this model. Because uPA/SCID mice are not able to be examined due to hepatocyte injury, SCID mice were examined concomitantly with chimeric mice in this study. The animals were housed in a clean room with air filtered by high-efficiency particulate air filter. During the course of the study, the environmental conditions in the animal room were set to maintain a temperature range of 18–28°C and a relative humidity range of 30–80%, with frequent ventilation and a 12-h light (8:00–20:00)/12-h dark (20:00–8:00) illumination cycle. A commercially available pulverized diet (CRF-1; Oriental Yeast Co., Ltd) containing vitamin C (300-mg/100-g diet) and filtered tap water were provided ad libitum throughout the study. The animals were not fasted overnight prior to sacrifice.
Study Design
In the hEGF study, the effects of hEGF treatment (150 μg/kg, four times per day, i.p., for 2 days) on liver weight, human hepatocyte replicative DNA synthesis, and human hepatic Ki-67 mRNA expression levels were determined in chimeric mice (five animals/dose).
The design of the NaPB study is summarized in Table 1. Male CD-1 mice and WH rats (eight animals/dose) were fed diets containing 0 (control), 500, 1000, 1500, or 2500-ppm NaPB for 7 days. In previous bioassays, liver tumors were increased in a number of mouse strains at a NaPB dietary level of 500 ppm (IARC, 2001; Whysner et al., 1996) and at a dietary level of 1000 ppm in male mice of the low spontaneous tumor incidence C57BL/10J mouse strain (Jones et al., 2009). Therefore, dietary levels of 500 and 1000 ppm were selected for this study. In addition, in order to evaluate the effects of higher doses of NaPB, dietary levels of 1500 and 2500 ppm were also investigated. In the dose setting study where chimeric mice (three mice/dose) with less than a 70% replacement index were given NaPB at dose levels of 0, 1500, 2000, and 2500 ppm, one of the three animals died at each of the 2000 and 2500-ppm doses. Diets containing 0 (control) or 1500 ppm were fed to chimeric mice (five mice/dose) with more than a 70% replacement index for 7 days in the main study. However, three of the five chimeric mice given 1500-ppm NaPB also died. Replicative DNA synthesis and other data were thus only obtained from two animals at 1500 ppm. Therefore, additional chimeric mice fed diets containing 0 (control), 500, and 1000 ppm were investigated and the combined data from these two experiments were evaluated to obtain dose-response effects of NaPB in chimeric mice. SCID mice were treated with 0 (control) and 1500 ppm for comparison with the highest dose group in the chimeric mouse study. As significant increases in hepatocyte replicative DNA synthesis, determined as the hepatocyte labeling index, are observed transiently at the early phase of treatment with NaPB in rodents (Cohen and Arnold, 2011; Elcombe et al., 2014; Lake, 2009), a 7-day treatment period was selected for the present study.
Summary of Study Design of NaPB Study
| Animals | CD-1 mice | WH rats | Chimeric micea | SCID mice |
|---|---|---|---|---|
| Sex | Male | |||
| Age (weeks) | 10 | 10 | 14 | 10–14 |
| Number of animals per dose | 8 | 8 | 5b | 5 |
| NaPB dose levels (ppm) | 0, 500, 1000, 1500, 2500 | 0, 500, 1000, 1500, 2500 | 0, 500, 1000, 1500c | 0, 1500 |
| Human GH treatmentd | No | No | Yes | No |
| Administration route | In diet | |||
| Administration period (days) | 7 | |||
| Measurementse | Body weight, food consumption, plasma concentration of PB, hepatic CYP2B activity (7-pentoxyresorufin O-depentylase (PROD) activity), hepatocyte replicative DNA synthesis (BrdU labeling index), liver histopathology (light and electron microscopy), functional transcriptomic and metabolomic analyses, and selected gene expression determined by quantitative real-time polymerase chain reaction | |||
aThe range of replacement index with human hepatocytes in chimeric mice used in the present study was 73–90%.
bControl (0 ppm) group of chimeric mice consisted of nine animals because data from two experiments were combined.
cChimeric mice were not examined at 2500 ppm due to death in preliminary dose setting study. Data at 1500 ppm in chimeric mice are from two surviving animals.
dDue to a lack of human growth hormone (GH) in chimeric mice, the chimeric mouse liver spontaneously becomes fatty in the human hepatocyte regions about 70 days after transplantation (Tateno et al., 2011). Therefore, to mimic the normal in vivo condition and to decrease steatosis, Alzet minipumps containing recombinant human GH were implanted in the subcutaneous tissue of mice on the day prior to 7 days before the commencement of NaPB treatment.
eElectron microscopy was only examined in chimeric mice, and functional transcriptomic and metabolomic analyses were not examined in SCID mice.
| Animals | CD-1 mice | WH rats | Chimeric micea | SCID mice |
|---|---|---|---|---|
| Sex | Male | |||
| Age (weeks) | 10 | 10 | 14 | 10–14 |
| Number of animals per dose | 8 | 8 | 5b | 5 |
| NaPB dose levels (ppm) | 0, 500, 1000, 1500, 2500 | 0, 500, 1000, 1500, 2500 | 0, 500, 1000, 1500c | 0, 1500 |
| Human GH treatmentd | No | No | Yes | No |
| Administration route | In diet | |||
| Administration period (days) | 7 | |||
| Measurementse | Body weight, food consumption, plasma concentration of PB, hepatic CYP2B activity (7-pentoxyresorufin O-depentylase (PROD) activity), hepatocyte replicative DNA synthesis (BrdU labeling index), liver histopathology (light and electron microscopy), functional transcriptomic and metabolomic analyses, and selected gene expression determined by quantitative real-time polymerase chain reaction | |||
aThe range of replacement index with human hepatocytes in chimeric mice used in the present study was 73–90%.
bControl (0 ppm) group of chimeric mice consisted of nine animals because data from two experiments were combined.
cChimeric mice were not examined at 2500 ppm due to death in preliminary dose setting study. Data at 1500 ppm in chimeric mice are from two surviving animals.
dDue to a lack of human growth hormone (GH) in chimeric mice, the chimeric mouse liver spontaneously becomes fatty in the human hepatocyte regions about 70 days after transplantation (Tateno et al., 2011). Therefore, to mimic the normal in vivo condition and to decrease steatosis, Alzet minipumps containing recombinant human GH were implanted in the subcutaneous tissue of mice on the day prior to 7 days before the commencement of NaPB treatment.
eElectron microscopy was only examined in chimeric mice, and functional transcriptomic and metabolomic analyses were not examined in SCID mice.
Mortality, body weight, and food consumption were monitored throughout the study. Alzet minipumps (Model 2001 in CD-1 and chimeric mice, Model 2ML1 in rats; Alzet Corporation) containing BrdU (Sigma Company, St Louis, MO), with a release rate of 40 and 200 μg/h, respectively, were implanted in the subcutaneous tissue of mice and rats, under anesthesia with diethyl ether or isoflurane on the day prior to 7 days (2 days for the hEGF study) before the scheduled euthanasia. After the 7-day treatment period, blood was collected at euthanasia from all surviving animals from the abdominal aorta under diethyl ether anesthesia (CD-1 mice and WH rats) and from the heart under isoflurane anesthesia (chimeric mice and SCID mice). The livers were quickly excised and weighed. Some liver tissue was stored in RNA stabilization solution (Ambion, Austin, TX; or RNAlater, Life Technologies Corporation, Carlsbad, CA) under −20°C until analyzed for gene expression, whereas the rest of the liver tissue was processed for hepatic microsomal CYP enzyme activity, histopathology, and replicative DNA synthesis measurements. The blood samples were immediately centrifuged at 2150 × g for 15 min at 4°C and the plasma samples obtained were immediately extracted with a 3-fold volume of acetonitrile. The supernatants were stored at −80°C until examined by liquid chromatography/mass spectrometry (LC/MS) analysis.
Plasma Concentration of PB
Chromatographic separation was performed by a CapcellPak C18 MG II column (35 × 3 mm, 3 μm, Shiseido). The mobile phase was A; 0.1% formic acid in water and B; acetonitrile delivered at a flow rate of 0.5 ml/min, and the gradient condition was %B = 5% (0 min) − 100% (5 min). MS data acquisition was accomplished in selected reaction monitoring mode for PB (negative, m/z = 231/188) with an atmospheric pressure chemical ionization interface using a TSQ VantageTM (Thermo Fisher Scientific Inc.). Standard curves were obtained using NaPB.
Hepatic Microsomal Cytochrome P450 (CYP) Enzyme Expression Analysis
Liver S9 fractions were prepared as described previously (Lake, 1987). A portion of the liver (approximately 0.5 g) was homogenized in four volumes of 154-mM KCl containing 50-mM Tris/HCl buffer pH7.4 using a Potter-type Teflon-glass homogenizer. Whole liver homogenates were centrifuged at 9000 × g for 20 min at 4°C to separate S9 fractions. The protein content of the S9 fractions was determined using the DC protein assay kit (Bio-Rad, CA) employing bovine serum albumin as standard (Bradford, 1976). CYP2B activity was determined as 7-pentoxyresorufin O-depentylase (PROD) activity because PROD is a marker for CYP2B induction in rodents. The reaction mixture (200 μl) consisted of 3-μM 7-pentoxyresorufin, 10-μM dicoumarol, 1-mM NADPH, 1-μl S9 fraction in 100-mM Tris/HCl buffer pH7.4 in 96-well microplates. After incubation for 10 min at 37ºC, the reaction was stopped by addition of 100-μl acetonitrile. PROD activity was determined by fluorometric analysis. The fluorescence of the sample was measured with a microplate reader (Saffire II, Tecan) with an excitation wavelength of 550 nm and an emission wavelength of 589 nm. Enzyme activity was calculated from the fluorescence of a standard curve of the resorufin product.
Liver Histopathology
Livers from all surviving animals were fixed in buffered formalin, dehydrated, embedded in paraffin, sectioned, stained with hematoxylin and eosin, and examined by light microscopy. In addition, for chimeric mice, the right lateral lobe in the control and NaPB 1500-ppm groups was prefixed by perfusing 2.5% glutaraldehyde in 0.2-M phosphate buffer (pH 7.4) using a syringe for two animals/group. Human hepatocyte-originated areas of these liver samples were cut into 1-mm3 blocks with a razor blade in 2.5% glutaraldehyde in 0.2-M phosphate buffer (pH 7.4). The sample blocks were post-fixed in 2% osmium tetroxide, dehydrated, and embedded in epoxy resin. Ultra-thin sections were prepared, stained with uranyl acetate and lead citrate, and examined by transmission electron microscopy.
Hepatocyte Replicative DNA Synthesis
Hepatocyte replicative DNA synthesis was determined in the livers from all surviving animals by an immunocytochemical method using BrdU monoclonal antibody (Deguchi et al., 2009). BrdU labeling was analyzed microscopically in a blinded manner with more than 2000 hepatocytes per animal being evaluated in CD-1 mice and WH rats. An image analysis system was used to evaluate the BrdU labeling indices of human hepatocytes in chimeric mice and mouse hepatocytes in SCID mice. Glass slides were scanned at ×20 magnification using Olympus VS120 virtual slide scanning system (Olympus, Tokyo, Japan) and Definiens Tissue Studio software (Definiens, Munich, Germany). Areas consisting of human hepatocytes (without inflammation or necrosis) were selected manually with at least one area from each of the four lobes (lateral left lobe, lateral right lobe, medial right lobe, and medial left lobe) and custom-made image analysis algorithms were applied to the digital slides to automatically detect and quantify the number of positively and negatively stained hepatocytes. The total number of evaluated human hepatocytes was more than 10,000 per chimeric or SCID mouse. Sections of duodenum were also prepared and stained immunohistochemically as a positive control on the same glass slide as the liver using BrdU monoclonal antibody to confirm appropriate administration of BrdU.
Metabolomic Analysis of Plasma and Liver
Sample preparation for GC/MS analysis
Metabolomic analysis was determined in the liver and plasma samples from four to eight animals in each of the control groups and in one NaPB group of each model except for SCID mice. The NaPB groups selected were 2500 ppm for CD-1 mice, 2500 ppm for rats, and 1000 ppm for chimeric mice, because these groups had similar plasma concentrations of NaPB (around 70 μg/ml), as shown below.
Liver samples (ca. 10 mg) were weighed and homogenized in a 50-fold volume solution of methanol/water/chloroform (2.5:1:1, v/v/v) using a pestle on ice and incubated for 30 min at 37°C, followed by centrifugation at 20,400 × g for 5 min at 4°C. Three hundred microliters of each supernatant were collected into clean tubes. Four microliters of 2.5-mM 2-hydroxyundecanoic acid (Sigma-Aldrich, MO) dissolved in pyridine (used as an internal standard) and 133 μl of water were added to the supernatants before being centrifuged at 20,400 × g for 5 min at 4°C. Two hundred microliters of the resultant supernatants were collected into a clean tube and dried under reduced pressure before oximation and silylation. For oximation, 30 μl of 20-mg/ml methoxyamine hydrochloride (Sigma-Aldrich) dissolved in pyridine was mixed with each dried sample before being incubated for 90 min at 30°C. Next, 30 μl of N-methyl-N-trimethylsilyl-trifluoroacetamide (GL Science, Tokyo, Japan) was added for silylation and the mixture was incubated for 30 min at 40°C. The mixtures were subjected to GC/MS measurement.
Plasma samples (50 μl) were deproteinized by addition of 450 μl of methanol/water (8:1, v/v) after addition of 4 μl of 2.5-mM 2-hydroxyundecanoic acid (Sigma-Aldrich) dissolved in pyridine. After the mixtures were centrifuged at 20,400 × g for 5 min at 4°C, 200 μl of the resultant supernatants were collected into clean tubes and dried under reduced pressure. The two subsequent steps of derivatization were performed according to the procedure for liver samples as described above.
GC/MS analysis
All analyses were carried out with a Bruker Daltonics 1200 GC/MS/MS system (Bruker Daltonics, MA) using a FactorFour capillary column VF5-ms (length, 30 m + 10-m EZ-Guard; internal diameter, 0.25 mm; film thickness, 0.25 μm) (Agilent Technologies, Inc., CA). The injection temperature was 230°C and the helium gas flow rate through the column was 1.3 ml/min. The column oven temperature was 60°C for 1 min and rose at 10°C /min to 325°C and then remained at 325°C for 5 min. A sample of 1.0 μl was injected using a split mode (split ratio 1:30). Ions were generated at an electron impact energy of 70 kV and were recorded over the mass range from m/z 70 to 800.
Data processing
The chromatogram acquisition, detection of mass spectral peaks, and their waveform processing were performed using Bruker MS Workstation software Version 6.9.2 (Bruker Daltonics). The identification of metabolites was performed employing an in-house mass spectral library based on the results of standard analysis and an NIST Mass Spectral Library (NIST 05) search. To perform semi-quantitative assessment, the peak intensity of each quantified ion was calculated using the peak intensity of 2-hydroxyundecanoic acid as an internal standard. The ratio of each individual treatment group against the control group average was calculated and used for multiple classification and hierarchical cluster analysis.
Multiple classification analysis
The data set for the multiple classification analysis was compiled from the metabolic profiling results and principal component analysis (PCA) was performed using commercially available SIMCA-P+ ver.12.0 software (Umetrics, Umeå, Sweden). In chemometric analysis, pareto scaling was applied to the data processing.
Sample Preparation for Global Gene Expression Profiling Analysis and Quantitative Real-Time Polymerase Chain Reaction of Selected Genes of Liver
Total RNA from liver tissue was extracted using Isogen solution (Nippon Gene) and RNeasy Mini Kits (Qiagen) with on-column DNase treatment to avoid genomic DNA contamination. Total RNA was quantified by UV analysis at 260 nm and 280 nm using a Ultraviolet spectrometer (NanoDrop 2000, Thermo Fisher Scientific). The total RNA solution was stored at –80ºC until required for complementary DNA (cDNA) generation. cDNA was prepared from total RNA by reverse transcription using the High Capacity cDNA Reverse Transcription Kit for reverse transcription polymerase chain reaction (RT-PCR) (Applied Biosystems) according to the manufacturer's instructions. The reaction mixture (20 μl) comprised 10x RT Buffer containing total RNA (10–100 ng) (2 μl), 25 x dNTP mix (0.8 μl), 10x RT Random Primers (2 μl), 1-U/μl RNase Inhibitor (1 μl), and 2.5-U/μl MultiScribe Reverse Transcriptase (1 μl) in diethyl pyrocarbonate-treated water and was incubated at 25ºC for 10 min, 37ºC for 120 min, and 85ºC for 5 min. The cDNA solution was stored at −80ºC until needed for real-time PCR assays.
Global Gene Expression Profiling Analysis of Liver
Global gene expression profiling was determined in livers from four or five animals in each of the control groups and in one NaPB group of each model except for SCID mice. The NaPB groups selected were 2500 ppm for CD-1 mice, 2500 ppm for WH rats, and 1000 ppm for chimeric mice, because these groups had similar plasma concentrations of NaPB (around 70 μg/ml), as shown below. Gene expression analysis was conducted on each total RNA sample using either a SurePrint G3 Rat GE 8×60K Microarray, a SurePrint G3 Mouse GE 8×60K Microarray, or a SurePrint G3 Human GE v2 8×60K Microarray, together with a Low Input Quick Amp Labeling Kit, a Gene Expression Hybridization Kit, and a Gene Expression Wash Pack (Agilent Technologies). The procedure was basically conducted following the manufacturer's protocol (version 6.5), and a Feature Extraction (version 10.7.3.1) was used to generate tab-delimited files containing data regarding the relative level of expression of a transcript (gProcessedSignal = Signal) and whether a transcript is reliably detected or not (gIsWellAboveBG = Detection Call; present(1), absent(0)) from the image files. The gene expression microarray data can be downloaded from the National Center for Biotechnology Information Gene Expression Omnibus (accession no. GSE57058, GSE57055, GSE57056, GSE57057 for all models, CD-1 mouse, chimeric mouse, and WH rat, respectively; http://www.ncbi.nlm.nih.gov/geo/info/linking.html.).
Quantitative Real-Time PCR
mRNA expression levels of selected genes were determined in livers of all surviving animals from each model. Quantitative real-time PCR assays for the mRNAs listed in Supplementary Data were performed following the instruction manual of the PCR system (7500 Fast Real-Time PCR System, Applied Biosystems). In addition, levels of mouse, rat, and human glyceraldehyde-3-phosphate dehydrogenase (GAPDH) mRNA were determined as internal controls and the mRNA levels of each gene were normalized to those of GAPDH mRNA. The primer sets are listed in Supplementary Data. Quantitation of microsomal CYP2B and CYP3A enzymes, a marker of proliferation (Ki-67), proliferating cell nuclear antigen (PCNA), growth arrest and DNA-damage-inducible, beta (GADD45β), MDM2 oncogene, E3 ubiquitin protein ligase (MDM2), GAPDH and 18s mRNAs was performed in reaction mixtures (25 μl) containing 2x TaqMan Universal Master Mix (Applied Biosystems) (12.5 μl), each primer (Forward and Reverse, 0.2μM each), probe (0.2μM), and cDNA (2 μl of 1/4 diluted solution). After incubation at 50ºC for 2 min and 95ºC for 10 min, the PCR reaction was performed for 40 cycles: denaturation at 95ºC for 15 s, anneal and extension at 60ºC for 1 min. For the quantification of CYP2B mRNA in CD-1 mice and WH rats, and CAR mRNA in CD-1 mice, WH rats, and chimeric mice, the reaction mixture (25 μl) contained 2x Power SYBR Green PCR Master Mix (Applied Biosystems) (12.5 μl), each primer (forward and reverse, 0.4μM each), and cDNA (2 μl of 1/4 diluted solution). After incubation at 95ºC for 10 min, the PCR reaction was performed for 40 cycles: denaturation at 95ºC for 30 s, anneal at 55ºC for 30 s, and extension at 72ºC for 45 s. Each primer set did not form primer dimer or by-products and showed a single sharp peak under these conditions. To avoid possible contamination with the mouse genome in chimeric mouse liver, each primer set for human mRNA was shown not to work with mouse mRNA. CAR and 18s mRNA expression levels were determined using primer and probe set commonly active in genomes of human, mouse, and rat. The measurements were conducted by Sumika Technoservice Corporation (Hyogo, Japan).
Hierarchical Clustering Analysis
The gene expression and metabolomics data obtained were subjected to hierarchical clustering analysis with GeneSpring GX 7.3.1 software (Agilent Technologies). Pearson correlation was used for the similarity measurement of genes/metabolites and samples in the analysis. For analysis of cell proliferation-related genes (which were selected based on the Gene Ontology list of Agilent Technologies), 256 genes altered significantly in any model treated with NaPB were used for hierarchical clustering. For metabolomics data, 95 and 86 metabolites present in liver and plasma, respectively, which were determined in any group, were used.
Culture of Hepatocytes from Chimeric Mice
For the in vitro study, chimeric mice were obtained from PhoenixBio Co., Ltd. Two hepatocyte preparations from different chimeric mice containing human hepatocytes from the same donor as the in vivo study were used. The hepatocytes were treated with 100-ng/ml hEGF for 48 h and replicative DNA synthesis determined by BrdU incorporation over the last 24 h of culture as described previously (Hirose et al., 2009) with minor modifications.
Statistical Analysis
For comparison among multiple groups, if the variables exhibited a normal distribution by the Bartlett-test, the Dunnett-test was applied for a comparison of the treated groups with the control group. The Steel-test was applied instead of the Dunnett-test when the data did not exhibit a normal distribution. For comparison between two groups, the F-test was applied to compare treated groups with the control group. If the variance was homogeneous, Student's t-test was used. If the variance was heterogeneous, the Aspin-Welch-test was used. Two-tailed tests were employed for evaluation with p ≤ 0.05 and 0.01 as the levels of significance. For metabonomics analysis, statistical significance was analyzed using the Student's t-test, and a level of probability of 0.05 was used as the criterion of significance. For global gene expression profiling, the 75th percentile normalization was used for per sample normalization before comparative analysis to examine gene expression differences between treatment and control samples. From the resulting tab-delimited files, signal averages of each group, the ratio of treatment to control, and the p-value in statistical significance testing (Welch's t-test, two-sided) were obtained. All those showing greater than 1 for the ratio and less than 0.05 for the p-value and “1 (present)” for Detection Call in experimental (treatment) arrays were regarded as upregulated probe sets. Those showing less than 1 for the ratio and less than 0.05 for the p-value and “1 (present)” for Detection Call in the baseline (control) arrays were regarded as downregulated.
RESULTS
hEGF Study
The treatment of chimeric mice with hEGF (150 μg/kg four times a day, i.p., for 2 days) produced small but not statistically significant (p values are 0.15 and 0.09, respectively) increases in absolute and relative liver weights (Figs. 1A and B). However, treatment with hEGF significantly increased replicative DNA synthesis (Fig. 1C) and Ki-67 mRNA levels (Fig. 1D) in human hepatocytes of chimeric mice. In two separate experiments the treatment of cultured human hepatocytes from chimeric mice with 100-ng/ml hEGF resulted in significant increases in replicative DNA synthesis in (Fig. 1E).
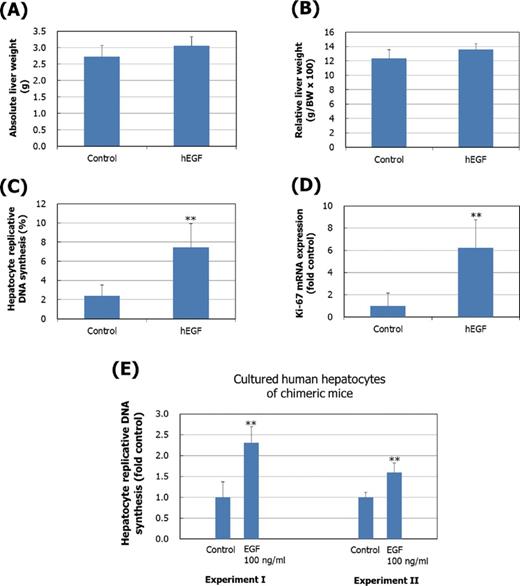
Effect of human EGF (hEGF) treatment in vivo and in vitro on hepatocellular proliferation in chimeric mice. In the in vivo study, the effect of hEGF treatment (150 μg/kg x 4 times/day, i.p., 2 days) on absolute liver weight (A), relative liver weight (liver weight per 100 g body weight) (B), hepatocyte replicative DNA synthesis (C), and hepatic Ki-67 mRNA expression levels (D) was determined in chimeric mice. Results are presented as the mean ± SD values of five animals. (E) For the in vitro study, hepatocytes obtained from chimeric mice (PCB cells®) were treated with hEGF (100 ng/ml) for 48 h and BrdU incorporation for last 24 h was determined. Two replicate experiments (I and II) were conducted using human hepatocyte preparations from different animals. Results are presented as mean ± SD of fold control from eight replicate wells per treatment. Values significantly different from control (0 ppm) are: **p < 0.01.
NaPB Study
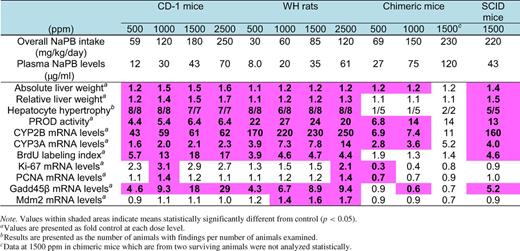
Table 2 summarizes the effect of NaPB treatment on some selected endpoints in CD-1 mice, WH rats, chimeric mice, and SCID mice. Generally, CD-1 mice, WH rats, and SCID mice showed greater responses than chimeric mice for most endpoints examined. In contrast to CD-1 mice, WH rats, and SCID mice, no increase in hepatocellular proliferation was observed in chimeric mice even at high plasma PB levels. The data are presented below.
Summary of the Effect of NaPB Treatment on Some Selected Endpoints in CD-1 Mice, WH Rats, Chimeric Mice, and SCID Mice
Mortality and Body Weight
In contrast to one CD-1 mouse and no WH rats given 2500-ppm NaPB, three chimeric mice given 1500-ppm NaPB died during treatment (Supplementary Data), suggesting that the maximum tolerated dose of NaPB in chimeric mice is lower than that in both CD-1 mice and WH rats. A statistically significant suppression of final body weight with concomitant lower food consumption was observed in WH rats treated with NaPB 2500 ppm (Supplementary Data). The body weights of the two surviving chimeric mice given 1500 ppm NaPB were similar to those of control chimeric mice.
NaPB Intake and Plasma Levels
NaPB intakes, calculated from food consumption and NaPB concentration in diet data (Fig. 2A), and plasma PB levels (Fig. 2B) were increased in a dose-dependent manner in CD-1 mice, WH rats, and chimeric mice. Although mean plasma PB levels were similar in CD-1 mice and WH rats, chimeric mice had the highest plasma PB levels at each NaPB dietary level. The ranges of PB plasma levels in chimeric mice given 500-, 1000-, and 1500-ppm NaPB were 17.3–35.9 μg/ml, 40.1–149.4 μg/ml, and 86.3–146.1 μg/ml, respectively. In this paper, most data are expressed on a plasma PB-μg/ml basis, rather than on a ppm dietary dose level basis, in order to permit a clearer evaluation of species differences in the effects of NaPB treatment.
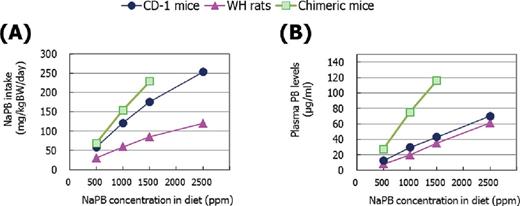
(A) NaPB intake and (B) plasma PB concentrations in CD-1 mice, WH rats, and chimeric mice. Results are presented as the mean of five to eight animals except for data at 1500 ppm in chimeric mice which are from two surviving animals. Actual mean values of NaPB intake and actual mean ± SD values of plasma PB concentrations are shown in Supplementary Data.
Liver Weight and Morphology
Statistically significant, dose-dependent increases in absolute liver weight were observed in CD-1 mice, WH rats, and chimeric mice (Fig. 3A). In the highest NaPB dose group of chimeric mice, the increase was not statistically significant owing to the small number of animals that survived. Statistically significant, dose-dependent increases in relative liver weight were observed in CD-1 mice and WH rats, whereas NaPB only produced small increases in relative liver weight in chimeric mice (Fig. 3B). The chimeric mouse livers were characterized morphologically (Fig. 4A) and histologically (Fig. 4B) with respect to the extent of chimerism, in that they contained both white and red areas (Fig. 4A). The white areas consisted of human hepatocytes and were easily distinguishable from the areas of mouse hepatocytes. The red nodules that were distributed sporadically in the livers of chimeric mice represent colonies of transgene-deleted host hepatocytes, as reported previously (Sandgren et al., 1991). In the human hepatocytes of chimeric mice treated with 1500-ppm NaPB, cytosolic glycogen areas were decreased and the size of the cells was slightly increased in the centrilobular area (Figs. 4C and D). These hepatic changes suggest that human-originated hepatocytes exhibited slight hypertrophic changes after NaPB treatment, the effect being less marked than that observed in WH rats and CD-1 mice (Supplementary Data). Electron microscopic evaluation was only conducted in chimeric mice treated with 1500-ppm NaPB, which supported the light microscopic changes, because an increase of smooth endoplasmic reticulum was observed in the human-originated hepatocytes (Figs. 4E and F).
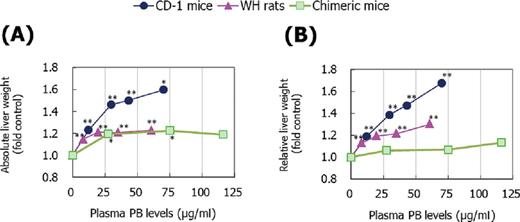
Effect of NaPB treatment on absolute (A) and relative liver weight (liver weight per body weight) (B) in CD-1 mice, WH rats, and chimeric mice. Mean values from five to nine animals except for data at 1500 ppm in chimeric mice which are from two surviving animals are presented as fold control at each dose level. Values significantly different from control (0 ppm) are: *p < 0.05 and **p < 0.01. Actual mean ± SD values are shown in Supplementary Data.
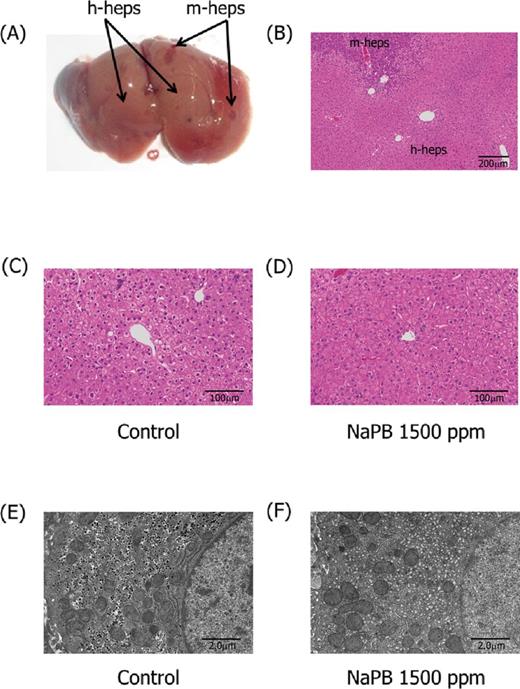
Liver gross pathology and histology in chimeric mice. Photographs present gross (A) and histological (B) appearance of livers of control chimeric mice, with h-heps and m-heps representing human hepatocytes and mouse hepatocytes, respectively. Histopathology (C, D) and ultrastructure (E, F) of human hepatocyte-originated areas of chimeric mice given 0 (C, E) and 1500 ppm (D, F) NaPB are also presented. Centrilobular hepatocellular hypertrophy (D) and proliferation of the smooth endoplasmic reticulum (F) was observed in NaPB-treated chimeric mice. Actual incidences of liver histopathology are shown in Supplementary Data.
Hepatic CYP2B Enzyme Activity
As shown in Figure 5, statistically significant increases in the activity of the rodent CYP2B induction marker PROD were observed in all models. In the highest NaPB dose group of chimeric mice, the increase was not statistically significant owing to the small number of animals that survived. For WH rats and CD-1 mice, maximal increases in enzyme activity were observed at NaPB dietary levels of 1000 and 1500 ppm, respectively. The fold increase in PROD activity was more marked in WH rats than in CD-mice, which was not consistent with the effect on relative liver weight, where the increase was greater in CD-1 mice than in WH rats (Fig. 3). In chimeric mice, PROD activity was increased in a dose-dependent manner up to 1000-ppm NaPB (mean plasma PB level 75.2 μg/ml). The maximum fold change of the PROD activity in chimeric mice (approximately 14-fold control) was between WH rats (approximately 20–27-fold control) and CD-1 mice (approximately 5–6-fold control) (Fig. 5).
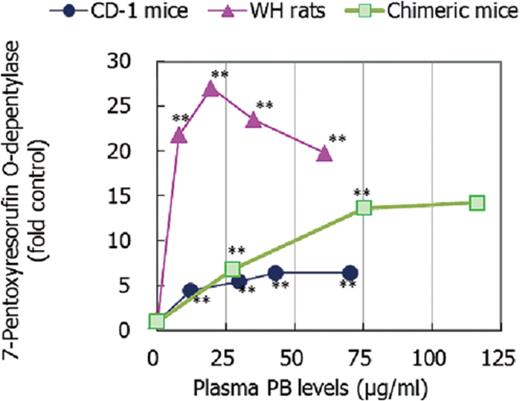
Effect of NaPB treatment on hepatic 7-pentoxyresorufin O-depentylase (CYP2B marker) activity in CD-1 mice, WH rats, and chimeric mice. Mean values from five to nine animals except for data at 1500 ppm in chimeric mice which are from two surviving animals are presented as fold control at each dose level. Values significantly different from control (0 ppm) are: **p < 0.01. Actual mean ± SD values are shown in Supplementary Data.
Metabolomic Analysis
Metabolomic analysis of liver and plasma samples was performed in CD-1 mice and WH rats given 2500-ppm NaPB and in chimeric mice given 1000-ppm NaPB, as these groups had similar PB plasma levels (around 70 μg/ml; Fig. 2B). Supplementary Data shows a list of metabolites detected in liver and plasma samples from these animals. Score plots produced by PCA of the liver tissue and plasma are shown in Figure 6A. The PCA algorithm generates a single point that represents the metabolites in a sample and their concentrations (each dot in the score plots shown in Figure 6A represents a single animal); close clustering of dots indicates that the samples have similar compositions. Although the plasma samples from CD-1 and chimeric mice clustered more closely into one group than those from WH rats, the liver samples from chimeric mice were clearly distinct from those of both CD-1 mice and WH rats (Fig. 6A), indicating that the profiles of the metabolites in the liver samples from the NaPB-treated chimeric mice differed from those derived from NaPB-treated CD-1 mice and WH rats. This observation is also supported by the results of clustering analysis of altered metabolites by NaPB treatment (Fig. 6B).
![Effects of NaPB treatment on the metabolite profile of liver and plasma of CD-1 mice treated with 2500-ppm NaPB, WH rats treated with 2500-ppm NaPB, and chimeric mice treated with 1000-ppm NaPB. (A) Score plots of principal component analysis using the altered metabolite data from four to eight individual animals in each model. The principal components PC1 (t[1]) and PC2 (t[2]) described 27 and 16% of the variation for liver tissue, respectively, and 29 and 15% of the variation for plasma, respectively. (B) Cluster analysis using the altered metabolite data from individual animals. Ninety-five and 86 metabolites present in the liver and plasma, respectively, were examined in all groups.](https://oup.silverchair-cdn.com/oup/backfile/Content_public/Journal/toxsci/142/1/10.1093_toxsci_kfu173/2/m_kfu173fig6.jpeg?Expires=1716341920&Signature=crBX4WSrrGMNoFBgDvo0re8bQWw1AsV-6bkUM0K6IYslPqwUXxhqKZAzIGtzZLZvbT9669FZjWkyaaszrJC2TgZURmZxEgmyJJO6k0O4YPx9z43fpRa~tDVUBloxsXY71reWWEB1wr93-dSl5cGu4QcUy1tVtIjWIqSHaq0ta3RVkjCZVgDW5os09xyuMxBcdP7K68VTkcqX-r6C9z7TbjpfCsEcycbu~HhHRAqT3W~Vb9CaldlqE0d8woPRIQdBxK0iINLAdR26dH10pVYU3IiUSgxM8RRLaFqf~z3BhTGWM8NiIms7Bj1MJ-szkG8RCutNv322gXlZOQ~zHGcskQ__&Key-Pair-Id=APKAIE5G5CRDK6RD3PGA)
Effects of NaPB treatment on the metabolite profile of liver and plasma of CD-1 mice treated with 2500-ppm NaPB, WH rats treated with 2500-ppm NaPB, and chimeric mice treated with 1000-ppm NaPB. (A) Score plots of principal component analysis using the altered metabolite data from four to eight individual animals in each model. The principal components PC1 (t[1]) and PC2 (t[2]) described 27 and 16% of the variation for liver tissue, respectively, and 29 and 15% of the variation for plasma, respectively. (B) Cluster analysis using the altered metabolite data from individual animals. Ninety-five and 86 metabolites present in the liver and plasma, respectively, were examined in all groups.
Global Gene Expression
Global gene expression profile analysis was performed in liver samples from control CD-1 mice, WH rats, and chimeric mice and in liver samples from CD-1 mice and WH rats given 2500-ppm NaPB and chimeric mice given 1000-ppm NaPB, as these groups had similar PB plasma levels (around 70 μg/ml; Fig. 2B). Supplementary Data shows a list of genes observed with significant alterations. The numbers of genes with a 2-fold alteration for upregulation and downregulation in the NaPB-treated groups were, respectively, 286 and 560 in CD-1 mice, 274 and 119 in WH rats, and 174 and 90 in chimeric mice (Fig. 7A). The total number of altered genes in chimeric mice was less than the numbers altered in CD-1 mice and WH rats. Because the number of genes examined was different among models, the ratio of altered genes was also evaluated. The genes up- and downregulated in chimeric mice were only 0.5 and 0.2%, respectively, of all genes examined (37,876 genes), which was the lowest of the three animal models examined in this study (Fig. 7B).
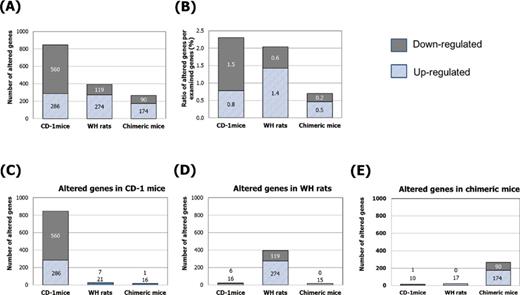
Effect of NaPB treatment on global gene expression profiles in livers of CD-1 mice treated with 0- and 2500-ppm NaPB, WH rats treated with 0- and 2500-ppm NaPB, and chimeric mice treated with 0- and 1000-ppm NaPB. The profiling was individually determined for the livers from four or five animals in each of the control and NaPB groups for each model. (A) The total number of significantly altered genes. (B) Ratio of significantly altered genes per total number of genes examined (36,765 for CD-1 mice, 19,287 for WH rats, and 37,876 for chimeric mice). (C, D, E) Similarity is presented as the number of significantly altered genes overlapping between the three models.
A very small number of altered genes by NaPB overlapped between CD-1 mice, WH rats, and chimeric mice (Figs. 7C–E). Most altered genes were related to metabolism. Of 846 genes altered in CD-1 mice treated with NaPB (Fig. 7C), only 16 upregulated genes (cytochrome P450, family 2, subfamily b, polypeptide 10, etc.) and one downregulated gene (collagen, type V, alpha 3) were also observed in chimeric mice treated with NaPB (Supplementary Data). Unexpectedly, most altered genes in CD-1 mice were not changed significantly in WH rats. Of 393 genes altered in WH rats treated with NaPB (Fig. 7D), only 15 upregulated genes (cytochrome P450, family 2, subfamily b, polypeptide 2, etc.) and none of the downregulated genes were observed in chimeric mice treated with NaPB. Of 263 genes altered in chimeric mice treated with NaPB (Fig. 7E), only 10 upregulated genes (cytochrome P450, family 2, subfamily A, polypeptide 13, etc.) were observed in CD-1 mice treated with NaPB. Seventeen upregulated genes (aldehyde oxidase 1, etc.) and none of the downregulated genes were observed in WH rats treated with NaPB.
Expression of cell proliferation-related genes was also analyzed. As for the global gene expression analysis, the number of altered genes related to cell proliferation by NaPB treatment was less in chimeric mice than CD-1 mice and WH rats (Fig. 8A). Furthermore, we focused on 641 cell proliferation-related genes that we were able to examine in all three animal models (Fig. 8B). For these genes, WH rats showed the highest number of up- and downregulated genes among the three models. Although similar numbers of genes were affected in CD-1 and chimeric mice (Fig. 8B), a Venn diagram of altered genes indicated no overlap between CD-1 mice and chimeric mice except for one gene (Fig. 8C). Although annexin A7 (Anxa7) was identified as a commonly significantly increased gene among the three models, the increases were marginal (Figs. 8C and D). Apart from Anxa7, nine upregulated and seven downregulated genes were significantly altered in both chimeric mice and WH rats. However, alterations of most of the genes in chimeric mice were also marginal (i.e., less than 2-fold for upregulation or more than 0.5-fold for downregulation compared with the controls) except for 24-dehydrocholesterol reductase (DHCR24) and arginine vasopressin receptor 1A (AVPR1A). Significantly and commonly altered genes in both WH rats and chimeric mice are also listed in Figure 8D. Clustering analysis was evaluated for cell proliferation-related genes altered by NaPB treatment. Supplementary Data shows a list of genes used in this analysis. The profile of these genes in NaPB-treated animals was similar between CD-1 mice and WH rats, but those in chimeric mice were different from those in rodents (Fig. 8E).
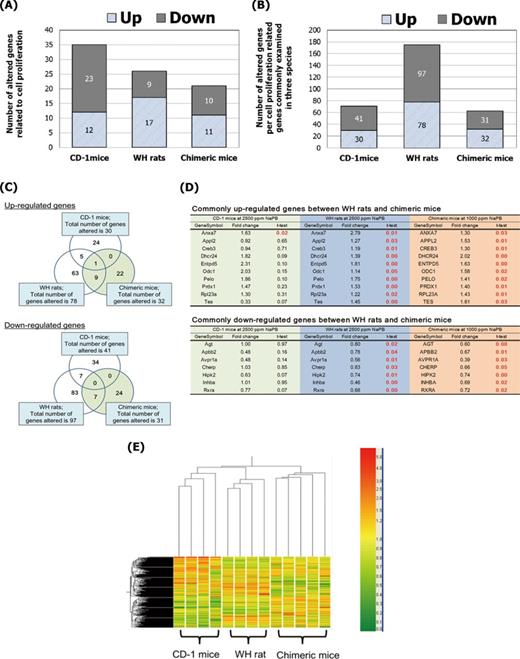
Effect of NaPB treatment on the expression profiles of cell proliferation-related genes in livers of CD-1 mice treated with 2500-ppm NaPB, WH rats treated with 2500-ppm NaPB, and chimeric mice treated with 1000-ppm NaPB. The cell proliferation-related genes were selected based on gene ontology by Agilent Technologies. (A) The total number of cell proliferation related-genes with significant alterations (p-value, less than 0.05) and with fold changes more than 2. The number of the target genes examined was 1560 for CD-1 mice, 2743 for WH rats, and 2167 for chimeric mice. (B) Ratio of significantly altered genes related to cell proliferation per total number of cell proliferation-related genes with significant alterations (p-value, less than 0.05) irrespective of fold change in commonly examined cell proliferation-related genes in three animal models (641 genes). (C) Venn diagram of significant up- and downalterations observed in expression of the cell proliferation-related genes. (D) Commonly altered genes in WH rats and chimeric mice, or CD-1 mice and WH rats, presented in (C). Value of t-test presents p-value and red value indicates statistical significant. (E) The profiling was individually determined for the livers from four or five animals in each of the control and NaPB groups in each model. Cluster analysis using the gene data from individual animals. Cell proliferation-related gene sets whose expression was up- and downregulated with NaPB in at least one model were analyzed. The total number of the genes analyzed was 256.
Replicative DNA Synthesis
To determine whether the altered cell-proliferation genes described above are able to contribute to increase hepatocellular proliferation, hepatocyte cell replicative DNA synthesis (determined as BrdU labeling indices) was examined. Replicative DNA synthesis was significantly increased by treatment with NaPB at all dose levels in CD-1 mice and WH rats (Figs. 9A and B). In CD-1 mice, the increased labeling was dose dependent up to 1500 ppm (mean plasma PB level 43 μg/ml) and the maximum response was 17.9-fold control. For WH rats, the stimulation of replicative DNA synthesis was similar at all four dose levels. The degree of increased labeling in WH rats was lower than that in CD mice (only 3.9–4.7-fold control). In contrast to CD-1 mice and WH rats, human hepatocytes in chimeric mice did not show any significant increase in replicative DNA synthesis at NaPB dose levels of 1000 and 1500 ppm, even though plasma PB levels (for 1000 ppm, 75 ± 46.9 μg/ml, n = 5; and for 1500 ppm, 116 (86 and 146) μg/ml, n = 2) were higher than those of the highest 2500-ppm CD-1 mouse group (70.2 ± 48.7 μg/ml, n = 7). Mean labeling index values in chimeric mice treated with 500-, 1000-, and 1500-ppm NaPB were 1.9-, 1.3-, and 1.4-fold control values, respectively. However, as shown in Figure 9C, all individual labeling index values in NaPB-treated chimeric mice were within the control range (2.4–10.7%) except for one outlier given 500-ppm NaPB (16.6%), suggesting that the marginally higher values in NaPB-treated chimeric mice are not biologically significant.
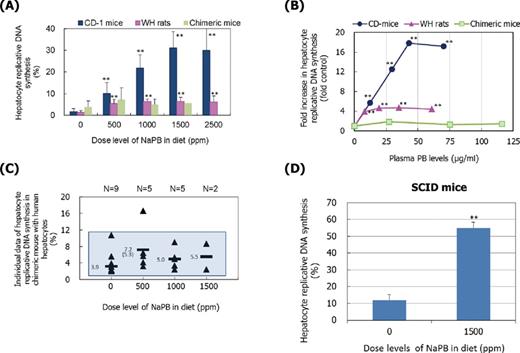
Effect of NaPB treatment on replicative DNA synthesis in CD-1 mice, WH rats, chimeric mice, and SCID mice. (A) Results are presented as mean ± SD of five to nine animals except for data at 1500 ppm in chimeric mice which are from two surviving animals. (B) Mean values are presented as fold control at each dose level. (C) Individual values (triangles) with mean value of the dose groups (bars) in chimeric mice. The shaded area represents the control range. Whereas at 500 ppm mean value of all animals examined is 7.2%, it is 5.3% when one outlier (16.6%) is excluded. (D) Replicative DNA synthesis in SCID mice given 0- and 1500-ppm NaPB. Mean values ± SD of five animals are presented. Values significantly different from control (0 ppm) are: **p < 0.01. In chimeric mice, no values were significantly different (p > 0.05) from control (0 ppm) irrespective of inclusion of one outlier. Actual mean ± SD values are shown in Supplementary Data.
To confirm the potential responsiveness of the SCID mice to NaPB, mice were given 0- and 1500-ppm NaPB for 1 week and hepatic replicative DNA synthesis was determined. Treatment with NaPB resulted in a significant 4.6-fold increase in the hepatocyte labeling index (Fig. 9D) and a 12.8-fold increase in hepatic PROD activity (Supplementary Data). Plasma PB levels in SCID mice given 1500-ppm NaPB were 42.7 ± 10.2 μg/ml and hence were lower than those observed in chimeric mice given both 1000- and 1500-ppm NaPB (mean values 75 and 116 μg/ml, respectively) (Supplementary Data).
Hepatic CYP and Cell Proliferation Gene mRNA Levels
Although treatment with NaPB showed a significant induction of CYP2B mRNA levels in three animal models, the increase was much less in chimeric mice than in CD-1 mice and WH rats, with the fold changes at 500, 1000, and 1500 ppm in chimeric mice being 6.9, 7.4, and 11.3, respectively (Fig. 10A). However, CYP2B mRNA levels in SCID mice treated with 1500-ppm NaPB showed a significant 161-fold increase (Supplementary Data). For CYP3A mRNA levels, the increase in chimeric mice was less than that in WH rats but similar to that in CD-1 mice (Fig. 10B). CYP3A mRNA levels in SCID mice treated with 1500-ppm NaPB showed a significant 4-fold increase, similar to that observed in chimeric mice (Supplementary Data). For selected genes related to cell proliferation, treatment with NaPB did not increase Ki-67, PCNA, GADD45β, and MDM2 mRNA levels in chimeric mice (Figs. 10C–F). In contrast, significant increases in these genes were observed at one or more dose levels in CD-1 mice and/or WH rats. SCID mice treated with 1500-ppm NaPB also showed a significant increase in GADD45β mRNA levels as observed in CD-1 mice and WH rats (Supplementary Data).
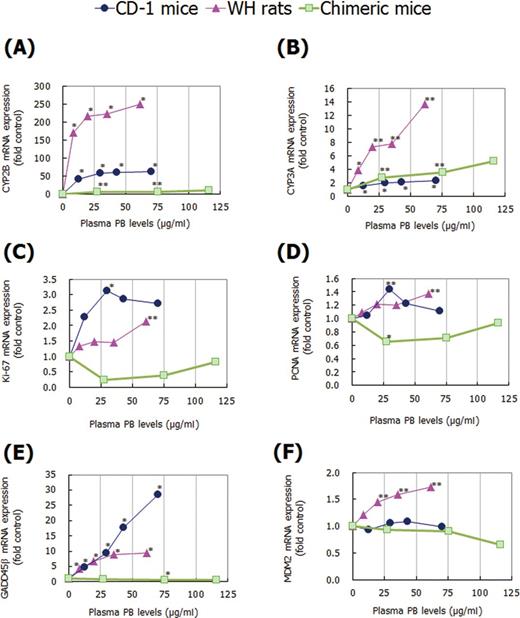
Effect of NaPB treatment on (A) CYP2B, (B) CYP3A, (C) Ki-67, (D) PCNA, (E) GADD45β, and (F) MDM2 mRNA expression in livers of CD-1 mice, WH rats, and chimeric mice. The mRNAs were determined by quantitative real-time PCR. Results are presented as mean of five to nine animals except for data at 1500 ppm in chimeric mice which are from two surviving animals expressed as fold control (0 ppm) levels. Values significantly different from control (0 ppm) are: *p < 0.05 and **p < 0.01. Actual mean ± SD values are shown in Supplementary Data.
Correlation Analysis Between Plasma PB Levels, Liver Weight, CYP, and Cell Proliferation Endpoints Examined
Pearson correlation coefficients are shown in Figure 11. In CD-1 mice and WH rats, most endpoints examined in this study correlated well with one another except for hepatic MDM2 mRNA in CD-1 mice. In contrast, in chimeric mice, although plasma PB levels correlated well with liver weight, PROD activity, and CYP2B/3A mRNA levels, no correlation was observed with BrdU labeling (r = 0.09, p = 0.71). Rather, negative correlations were observed between plasma PB or CYP2B mRNA levels and cell proliferation-related genes such as Ki-67, PCNA, or GADD45ß mRNA.
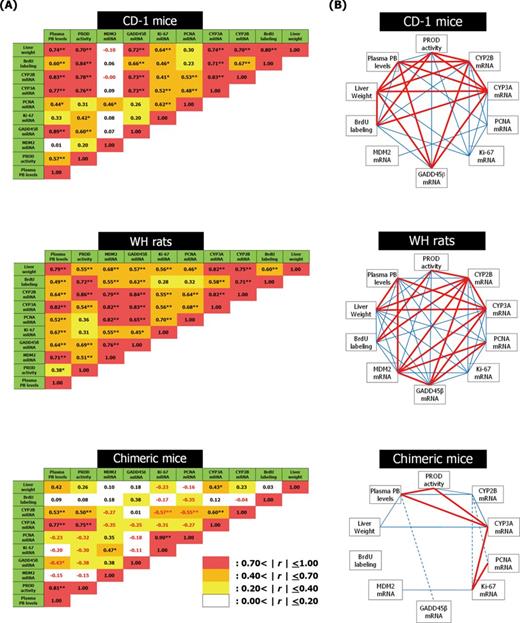
Correlation table (A) and schematic representation (B) of parameters examined in the present study. The analyzed data are for all dose levels of NaPB in each model except for SCID mice. (A) Values present Pearson correlation coefficients (r), with statistical significance from multivariate recurrence analysis being: *p < 0.05 and **p < 0.01. Values being lower and higher than zero are negative and positive correlations, respectively. (B) Heavy lines (0.7<|r|≤1.0) and fine lines (0.4<|r|≤0.7) indicate significant correlations. Solid and dashed lines present positive and negative correlation, respectively.
mRNA Levels of CAR and CAR Target Genes
Control levels of CAR mRNA expression in chimeric mice determined by real-time PCR were similar to those in human hepatocyte preparations (Fig. 12A). These levels in chimeric mice trended to be lower than those in CD-1 mice but higher than those in WH rats. No statistically significant differences in CAR mRNA levels were observed between WH rat and human hepatocyte preparations. Figure 12B shows the fold expression of CAR target genes determined in CD-1 mice, WH rats, and chimeric mice at similar plasma concentrations of PB (around 70 μg/ml). Although the increases in CYP2B6 and SULT2A1 mRNA levels after NaPB treatment in chimeric mice were much less than those of Sult2a1 and Cyp2b10 mRNA levels in CD-1 mice, for some other genes the response was either more marked in chimeric mice or similar between CD-1 mice and chimeric mice.
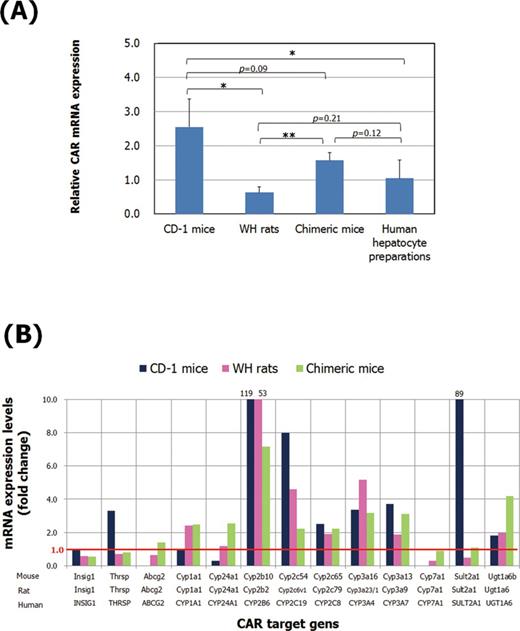
Comparison of CAR activation among models examined. (A) CAR mRNA expression levels in the liver of control CD-1 mice, WH rats, and chimeric mice and in human hepatocyte preparations. The mRNAs were determined by quantitative real-time PCR using primer and probe sets commonly active in mouse, rat, and human. Results are presented as mean of four CD-1 mice (males; 10-weeks old), five WH rats (males; 10–11-weeks old), four chimeric mice (males; 15-weeks old), and four human hepatocytes from different donors (ID no. IPH, female caucasian; 52-years old; ID no. Hu8127, female caucasian; 31-years old; ID no. Hu1552, female caucasian; 38-years old; ID no. Hu8164, male Caucasian; 23-years old) expressed as fold levels to 18s mRNA. Values significantly different are: *p < 0.05 and **p < 0.01. (B) Fold expression of CAR target genes determined by microarray analysis in CD-1 mice, WH rats, and chimeric mice at similar plasma concentrations of PB, namely, 70, 61, and 75 μg/ml, respectively (microarray data are presented in Supplementary Data).
DISCUSSION
The treatment of rats and mice with NaPB results in the activation of CAR leading to a pleiotropic response, which includes liver hypertrophy, induction of CYP2B and other xenobiotic metabolizing enzymes, increased hepatocyte proliferation, and ultimately in the development of altered hepatic foci and liver tumors. A number of evaluations have identified the key and associative events in the MOA for NaPB-induced rodent liver tumor formation (Cohen, 2010; Elcombe et al., 2014; Holsapple et al., 2006; Lake, 2009). The pivotal key event in this MOA is the stimulation of hepatocyte replicative DNA synthesis. Although NaPB produces cell proliferation in rat and mouse hepatocytes, other models are refractory to the mitogenic effects of this compound (Elcombe et al., 2014; Lake, 2009). Although NaPB induces replicative DNA synthesis in rodent hepatocytes both in vivo and in vitro, the absence of an increase in cultured human hepatocytes suggests that the MOA for NaPB-induced rodent liver tumor formation is qualitatively not plausible for humans (Elcombe et al., 2014).
Apart from in vitro studies with cultured human hepatocytes, another possible model for investigating the effects of NaPB and related compounds on human hepatocytes is to utilize immunocompromised mice with humanized livers. The uPA/SCID model used in this investigation (Tateno et al., 2004, 2013) has been used in a number of toxicity and metabolism studies to predict human response to drugs and other compounds (Foster et al., 2014; Kitamura and Sugihara, 2014). The data obtained in this study clearly demonstrate that transplanted human hepatocytes in chimeric mice are responsive to hEGF, a hepatocyte mitogen.
CAR is present in human liver and can be activated by drugs and other compounds, including NaPB (Elcombe et al., 2014; Molnar et al., 2013; Moore et al., 2003). In the present study, the treatment of chimeric mice with human hepatocytes with NaPB resulted in significant dose-dependent increases in mRNA levels of known CAR-target genes including CYP2B6. There was also a good correlation between plasma PB levels and CYP2B6 mRNA levels, confirming the functional viability of CAR signaling in the human hepatocytes of the chimeric mice. However, CAR signaling in human hepatocytes appears to be less compared with rodents in some but not all genes, as demonstrated by the smaller increases in CYP2B6 and SULT2A1 mRNA expressions in array analysis and liver hypertrophy (both liver weight and morphology). The higher induction of PROD activity in chimeric mice compared with CD-1 mice may be due in part to contamination by mouse hepatocytes, because unlike the mRNA studies, the method for the examination of PROD activity used in this study does not distinguish between human and mouse hepatocytes and PROD is not generally used as a marker of CYP2B6. The low correlation between liver weight increase and PROD activity in chimeric mice (Fig. 11) also supports this conclusion. The higher induction of CYP3A mRNA determined by real-time PCR in chimeric mice than in CD-1 and SCID mice suggests that the lower CYP2B mRNA induction in the chimeric mouse is not due to a lower cell viability of human hepatocytes in the chimeric mice. PB activates rodent CAR but not pregnane X receptor (PXR), but is an activator of both human CAR and human PXR (Tolson and Wang, 2010). Because CYP3A is more extensively induced in human hepatocytes by NaPB than in rodents, our data provide evidence that this chimeric mouse model is reliable. Furthermore, the findings of the integrated functional metabolomic and transcriptomic analyses revealed species differences in response to NaPB. The metabolomic analysis revealed differences in the effects of NaPB between rodent and human liver and the transciptomic analysis revealed that a lower number of genes were affected by NaPB in chimeric mice with human hepatocytes compared with CD-1 mice and WH rats. However, in WH rat which have a lower CAR mRNA expression than CD-1 mice (Fig. 12A), NaPB could increase hepatocellular proliferation. Although the lower responsiveness of chimeric mice to NaPB compared with CD-1 mice and WH rats may be partially attributable to lower expression of CAR mRNA, species differences in the signaling of CAR target genes are likely to contribute to differences in potency for each response, especially for hepatocellular proliferation.
In keeping with previous studies, the treatment of CD-1 mice and WH rats with NaPB resulted in significant increases in hepatocyte replicative DNA synthesis. Treatment with NaPB also increased replicative DNA synthesis in hepatocytes of SCID mice. The effect of NaPB treatment on the expression of a number of cell proliferation-related genes (Columbano et al., 2005; Huang et al., 2005; Iatropoulos and Williams, 1996; Scholzen and Gerdes, 2000; Yamamoto et al., 2010), namely Ki-67, PCNA, GADD45β, and MDM2, was also investigated. In CD-1 mice, NaPB produced increases in Ki-67, PCNA, and GADD45β mRNA levels, whereas in WH rats, NaPB produced increases in Ki-67, PCNA, GADD45β, and MDM2 mRNA levels. GADD45β is an anti-apoptotic factor that directly binds to MKK7 (dual specificity mitogen-activated protein kinase 7) and inhibits MKK7-dependent phosphorylation of JNK1/2 (c-jun N-terminal kinase 1/2) to repress apoptosis (Papa et al., 2004, 2007). GADD45β was strongly and rapidly induced by both surgical partial hepatectomy and treatment with a potent CAR agonist, 1,4-bis[2-(3,5-dichloropyridyloxy)]benzene (TCPOBOP) (Columbano et al., 2005; Tian et al., 2011). Furthermore, a possible role of GADD45β in hepatocyte proliferation and hepatocarcinogenesis has been suggested (Columbano et al., 2005; Papa et al., 2008; Pikarsky et al., 2004; Yamamoto et al., 2010). In the present study, the increases in hepatocyte replicative DNA synthesis and GADD45β mRNA expression were greater in CD-1 mice than in WH rats, which is consistent with the interspecies difference in susceptibility to liver tumor formation by NaPB (Elcombe et al., 2014). The increased GADD45β mRNA expression was also observed in SCID mice but not in chimeric mice. These findings suggest that increased GADD45β may be a possible key event for liver tumor formation in rodents via CAR activation.
In contrast to CD-1 mice, WH rats, and SCID mice, the treatment of chimeric mice with NaPB did not result in any increase in hepatocyte replicative DNA synthesis. Moreover, the lack of effect of NaPB on BrdU labeling in chimeric mice was also associated with a lack of effect of NaPB on Ki-67, PCNA, GADD45β, and MDM2 mRNA levels. Rather, the mRNA levels of these genes were slightly suppressed at some NaPB dose levels in chimeric mice. Apart from the genes described above, slight alterations of some other cell proliferation-related genes were observed in chimeric mice. However, the alterations in these genes in chimeric mice do not appear to be biologically important as there was no increase in hepatocyte replicative DNA synthesis. In contrast to chimeric mice, some genes altered in CD-1 mice or WH rats (especially commonly altered genes in both species; Anxa7, Bmp2, Col18a1, Egfr, Fgf1, Fgfr4, Igf1, Mad2l2, Mul1, Npm1, Nppa, Pbrm1, Ros1; Supplementary Data) are possibly involved in the increase in hepatocyte proliferation observed after treatment with NaPB.
The plasma levels of PB observed in chimeric mice with human hepatocytes after treatment with NaPB were higher than those obtained in both CD-1 mice and WH rats. In addition, the dose setting study established that NaPB dietary levels of >1500 ppm could not be administered to chimeric mice with human hepatocytes. It is therefore considered that the lack of effect of NaPB on replicative DNA synthesis in chimeric mice with human hepatocytes is an accurate finding, as higher dose levels of NaPB could not be examined in this study. Moreover, the plasma levels of PB observed in chimeric mice with human hepatocytes in this study following treatment with 1000- and 1500-ppm NaPB were around 3–5-fold higher than those reported in human subjects given therapeutic doses of 3–6 mg/kg, where plasma levels ranged from 10 to 25 μg/ml (Monro, 1993).
Previous studies have demonstrated that NaPB can activate CAR in human liver and induce CYP2B, CYP3A, and other xenobiotic metabolizing enzymes and that prolonged treatment with NaPB and other anticonvulsant drugs can increase liver size in humans (Elcombe et al., 2014; Holsapple et al., 2006; Lake, 2009). Thus, some of the key and associative events in the MOA for NaPB-induced rodent liver tumor formation are observable in the human liver. However, the key species difference is that although NaPB is a mitogenic agent in the rat and mouse liver, no such effect is observed in the human liver. To date, the major evidence that NaPB is not mitogenic in the human liver comes from studies with cultured human hepatocytes (Elcombe et al., 2014; Hirose et al., 2009; Lake, 2009). The current study thus provides valuable data using an in vivo model that NaPB does not induce replicative DNA synthesis in human hepatocytes.
To provide additional data on species differences in hepatocyte replicative DNA synthesis, some investigations have been performed with transgenic mice in which mouse nuclear receptors have been replaced with their human counterparts (Huang et al., 2005; Ross et al., 2010). One reported transgenic mouse model expressed only human CAR in the liver (hCAR mice), whereas in another transgenic mouse model both mouse CAR and the PXR were replaced with their human counterparts (hCAR/hPXR mice). Although NaPB induced hepatic replicative DNA synthesis in hCAR mice (Huang et al., 2005), no increase was observed in hCAR/hPXR mice (Ross et al., 2010). However, recent studies have demonstrated that NaPB can produce proliferative transcriptional responses (Luisier et al., 2014) and promote tumor production (Braeuning et al., 2014) in hCAR/hPXR mice. These findings are in conflict to the results of human hepatocyte studies (Elcombe et al., 2014; Hirose et al., 2009; Lake, 2009; Parzefall et al., 1991) and of epidemiological studies (Elcombe et al., 2014; Friedman et al., 2009; IARC, 2001; La Vecchia and Negri, 2014; Whysner et al., 1996). The available human hepatocyte and epidemiological data together with the results obtained in the present study suggest that apart from CAR itself, CAR signaling (CAR target genes) for cell proliferation appears to be a major factor in the observed species differences in liver tumor formation. Hence hCAR/hPXR transgenic mice, where CAR/PXR is human but signaling is still mouse, may not be an appropriate model for extrapolating the risk of rodent tumor findings to humans.
In summary, previous evaluations of the MOA for NaPB-induced rodent liver tumor formation have concluded that this MOA is not relevant for humans (Cohen, 2010; Elcombe et al., 2014; Holsapple et al., 2006; Lake, 2009). The data obtained in this study provide additional in vivo evidence for a marked species difference in the mitogenic effects of NaPB. In support of the lack of human relevance of the rodent MOA for liver tumor formation, a number of epidemiological studies have demonstrated that in human subjects receiving NaPB for many years, at doses producing plasma concentrations similar to those which are carcinogenic in rodents (Monro, 1993), there is no evidence of increased liver tumor risk (Elcombe et al., 2014; Friedman et al., 2009; IARC, 2001; La Vecchia and Negri, 2014; Whysner et al., 1996). The present results also suggest that other non-genotoxic rodent hepatocarcinogens that have a similar CAR activation MOA to NaPB would also not be expected to increase the risk of liver tumors in humans.
FUNDING
Sumitomo Chemical Co., Ltd.
The authors thank Dr Chise Tateno (PhenixBio Co., Ltd, Higashihiroshima, Japan) for valuable scientific discussions about the PXB mouse; Ms Hiroko Kikumoto, Keiko Tanaka, Keiko Maeda, Maki Katsura, and Mr Tadashi Noda for their technical assistance; and Ms Youko Obara for assistance with manuscript preparation. The authors also thank the other contributors to this research project from Sumitomo Chemical Co., Ltd and Sumika Technoservice Co. Conflict of interest: Authors Brian G. Lake and Samuel M. Cohen consult for Sumitomo Chemical Company.
REFERENCES

Comments