


Abstract
The in vitro characterization of the inhibition potential of four representative maytansinoid species observed upon hepatic and/or tumor in vivo processing of antibody-maytansine conjugates (AMCs) with cleavable and noncleavable linkers is reported. We investigated the free maytansinoid species N2′-deacetyl-N2′-(3-mercapto-1-oxopropyl)-maytansine (DM1), (S)-methyl-DM1, and N2′-deacetyl-N2′-(4-mercapto-4-methyl-1-oxopentyl)-maytansine (DM4) as representative cleavable linker catabolites and Lysine-Nε-N-succinimidyl 4-(N-maleimidomethyl) cyclohexane-1-carboxylate-DM1 (Lys-MCC-DM1) as the representative noncleavable linker catabolite. Studies with recombinant human cytochromes P450 (P450s) indicate CYP2D6, CYP3A4, and CYP3A5 are the primary isoforms responsible for the oxidative metabolism of DM1, (S)-methyl-DM1, and DM4. Lys-MCC-DM1 was not metabolized by any of the P450 isoforms studied. DM1 was shown to be a reversible inhibitor of CYP2C8 (Ki = 11 ± 3 μM) and CYP2D6 (Ki = 14 ± 2 μM). Lys-MCC-DM1 and (S)-methyl-DM1 showed no reversible or time-dependent inactivation of any of the P450s studied. DM1 and DM4 inactivated CYP3A from human liver microsomes with Ki/kinact values of 4.8 ± 0.9 μM/0.035 ± 0.002 min−1 and 3.3 ± 0.2 μM/0.114 ± 0.002 min−1, respectively. DM1 and DM4 inactivated recombinant CYP3A4 with Ki/kinact values of 3.4 ± 1.0 μM/0.058 ± 0.005 min−1 and 1.4 ± 0.3 μM/0.117 ± 0.006 min−1, respectively. Because of instability in plasma, further characterization of the DM1 and DM4 intramolecular and intermolecular disulfide conjugates observed in vivo is required before an accurate drug-drug interaction (DDI) prediction can be made. AMCs with noncleavable thioether-linked DM1 as the cytotoxic agent are predicted to have no potential for a DDI with any of the major human P450s studied.
Introduction
Antibody-drug conjugates (ADCs) are chemotherapeutic agents that capitalize on the specificity of a monoclonal antibody to selectively deliver cytotoxic compounds to cancer cells that overexpress the targeted surface antigen (Chari, 1998, 2008; Senter, 2009). The term antibody-maytansine conjugates (AMCs) has been used to describe ADCs that use the tubulin-targeting maytansinoid thiols, N2′-deacetyl-N2′-(3-mercapto-1-oxopropyl)-maytansine (DM1), N2′-deacetyl-N2′-(4-mercapto-1-oxopentyl)-maytansine (DM3), and N2′-deacetyl-N2′-(4-mercapto-4-methyl-1-oxopentyl)-maytansine (DM4), as the cytotoxic drug moiety conjugated through a linker to a targeting antibody (Chari, 2008). Several AMCs are progressing through clinical trials (Smith, 2005; Al-Katib et al., 2009; Ikeda et al., 2009; Burris et al., 2011).
The general mechanism of action of AMCs requires the following: 1) binding to the extracellular target, 2) endocytosis and trafficking to a lysosome, 3) proteolytic degradation of the AMC, and 4) intracellular release of the active maytansinoid species whereupon it binds to tubulin leading to cell death. Two chemical classes of cross-linkers have been used for preparation of AMCs; stable thioether linkers that upon degradation release lysine-linker maytansinoid (Lewis Phillips et al., 2008; Erickson et al., 2010) and disulfide-containing linkers that are susceptible to reduction, releasing free maytansinoid (Chari, 1998; Widdison et al., 2006; Kellogg et al., 2011). AMC preparations with stable thioether linkages generally use N-succinimidyl 4-(N-maleimidomethyl) cyclohexane-1-carboxylate (SMCC) as the linker, with the maytansinoid moiety most commonly being DM1. For disulfide-containing reducible linkages, numerous linker-maytansinoid pairs have been evaluated for AMC preparations with varying degrees of steric hindrance adjacent to the disulfide, either stemming from the linker itself, as in the case of N-succinimidyl 4-(2-pyridyldithio)pentanoate (SPP), or from the maytansinoid moiety, as in the case of DM3 and DM4 (Erickson et al., 2006; Lewis Phillips et al., 2008; Kellogg et al., 2011).
Erickson et al. (2006, 2010) reported differential in vitro and in vivo processing in mice bearing CanAg-positive COLO 205 tumors of AMCs for the anti-CanAg antibody (huC242) equipped with disulfide linker [huC242-N-succinimidyl 4-(2-pyridyldithio)butyrate (SPDB)-DM4 and huC242-SPP-DM1] versus one using a stable thioether linkage (huC242-SMCC-DM1). For the conjugate bearing the stable thioether linkage, a single catabolite, lysine-Nε-SMCC-DM1 (Lys-MCC-DM1), was observed in tumor tissues. Conjugates with reducible thiol linkers, huC242-SPDB-DM4 and huC242-SPP-DM1, resulted in the same corresponding primary catabolites, lysine-Nε-SPDB-DM4 and lysine-Nε-SPP-DM1, but also the secondary reduction products, DM4 and DM1. Furthermore, these secondary reduction products were subject to metabolism in tumor tissues from mice dosed with huC242-SPDB-DM4. Specifically, formation of (S)-methyl-DM4 was observed as a product of free DM4. Similar results were reported for nontarget-mediated hepatic in vivo processing of AMCs with cleavable versus noncleavable linkers (Sun et al., 2011). Using a humanized anti-CD56 monoclonal antibody (huN901) that does not cross-react with mouse target, nonspecific in vivo processing in livers of female CD1 mice resulted in the anticipated catabolites observed in target tumor tissue with the huC242 AMCs described above.
The in vitro oxidative processing of maytansinoid catabolites in human liver microsomal fractions has also been reported (Widdison et al., 2010). Widdison et al. (2010) have reported no observable oxidative metabolism of the Lys-MCC-DM1 catabolite of AMCs using the stable thioether linker. For catabolites DM1 and DM4 from AMCs using reducible disulfide linkers, as well as for their respective methylated metabolites (S)-methyl-DM1 and (S)-methyl-DM4, oxidative metabolism was observed. In NADPH-supplemented human liver microsomes (HLM), both DM1 and DM4 formed both sulfinic and sulfonic metabolites. In addition, DM1 also formed a disulfide-linked homodimer, and DM4 formed a cysteine conjugate. Both (S)-methyl-DM1 and (S)-methyl-DM4 underwent oxidation forming both sulfoxide and sulfone metabolites.
The identification of oxidative metabolites of DM1, (S)-methyl-DM1, DM4, and (S)-methyl-DM4 from human liver microsomal fractions by Widdison et al. (2010) suggests the involvement of cytochrome P450 (P450) enzymes in the oxidative clearance of unconjugated maytansinoids. In this study, we sought to investigate whether the pharmacologically active agents from AMC catabolism inhibit the major human drug-metabolizing P450s in vitro. As a representative pharmacologically active agent from stable thioether linkages, we studied Lys-MCC-DM1. For AMCs using reducible thiol linkers, DM1, (S)-methyl-DM1, and DM4 were studied as representative pharmacologically active agents (Fig. 1). Our findings suggest that catabolites of AMCs with “cleavable” versus “noncleavable” linker chemistries can affect their potential interactions with human P450s.
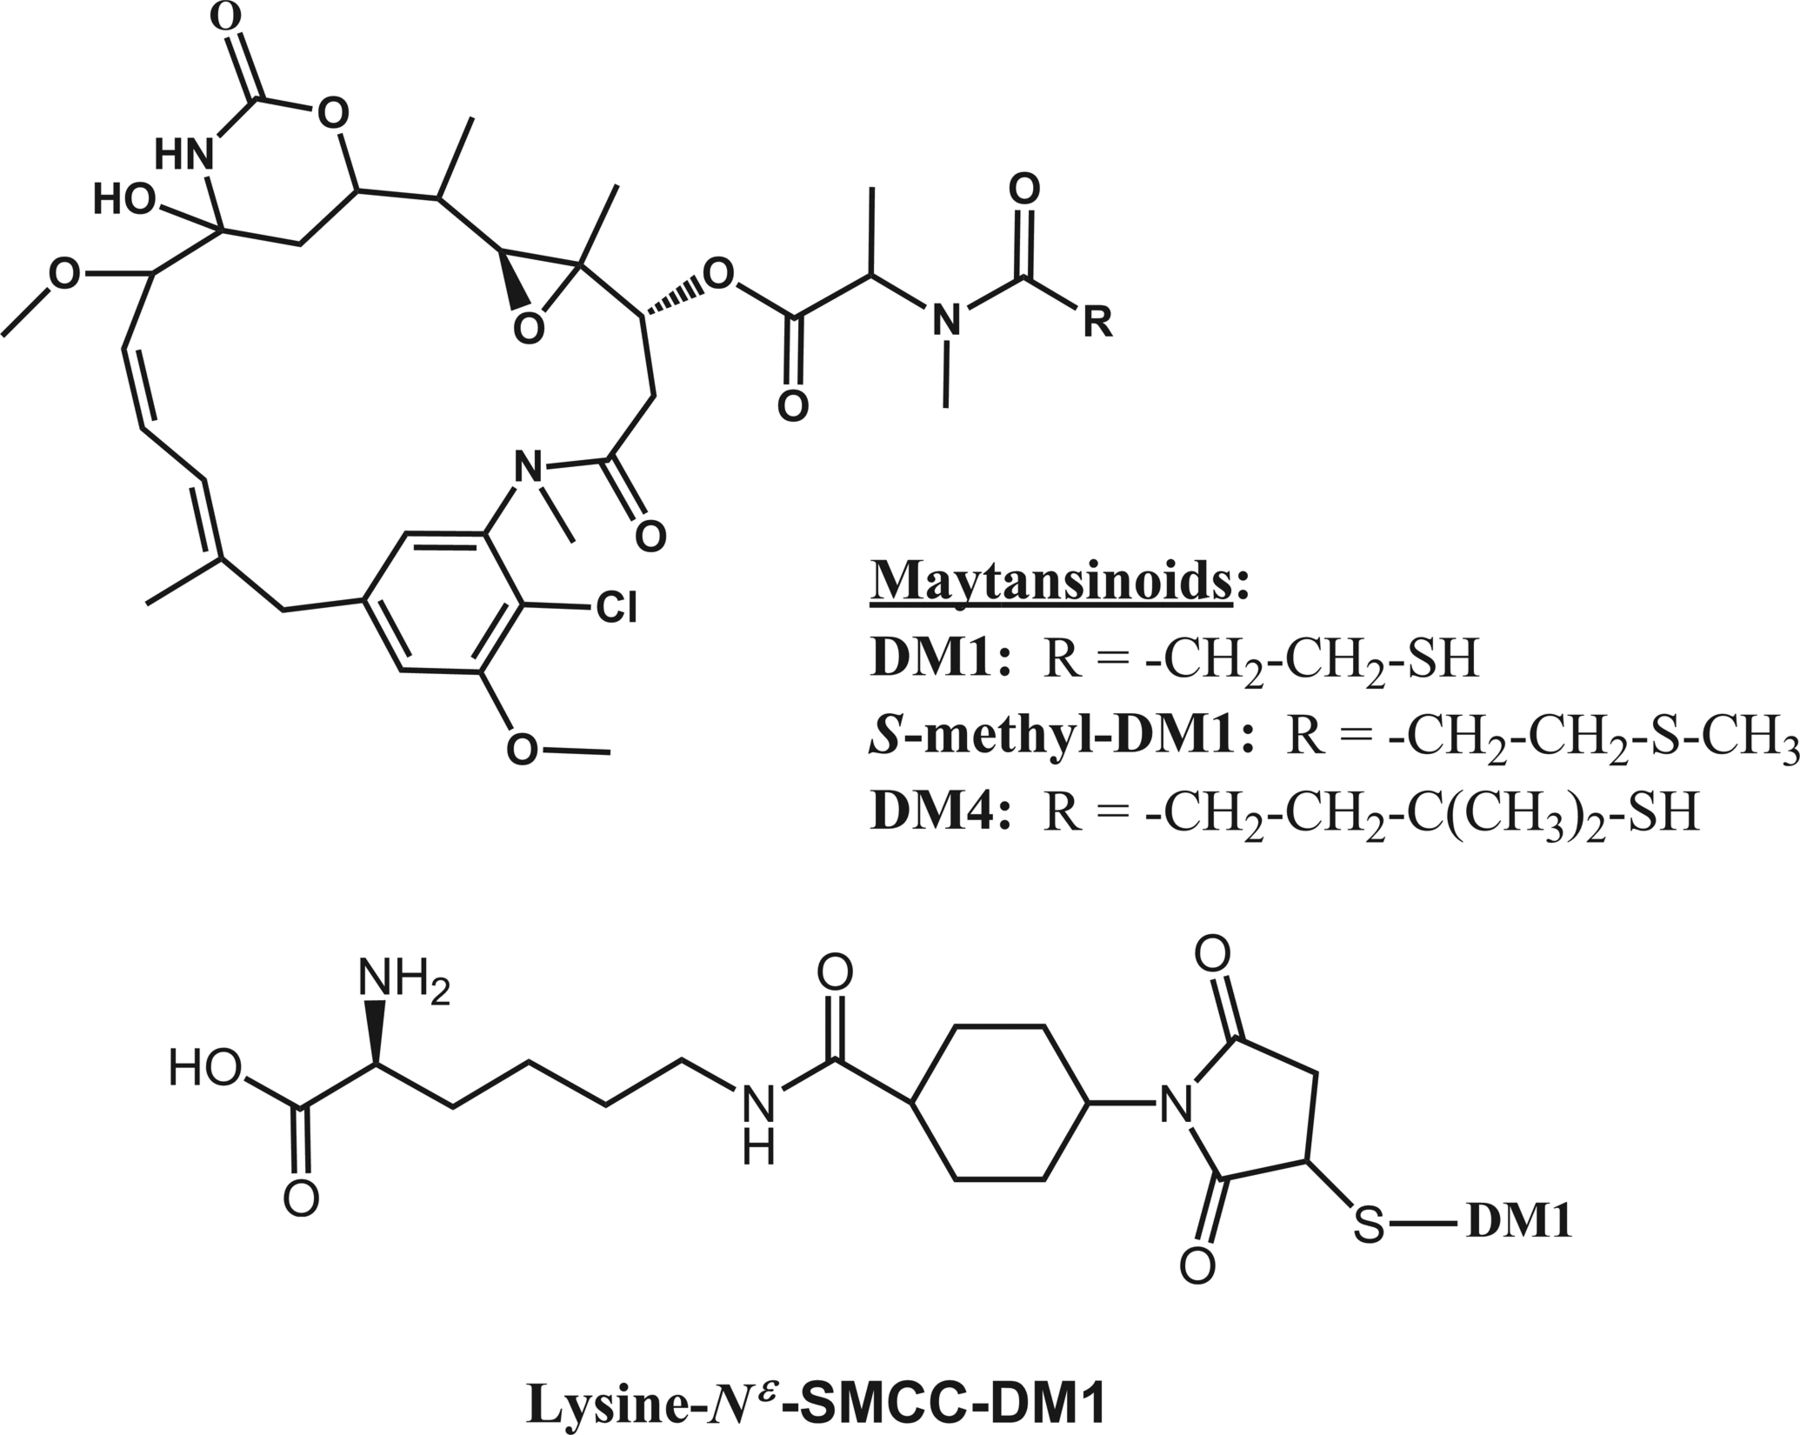
Maytansinoid species investigated in this study; maytansinoids (top) and Lys-MCC-DM1 conjugate showing the sulfur atom of DM1 (bottom).
Materials and Methods
Materials.
Pooled HLM and recombinant human P450 Supersomes were obtained from Invitrogen (Carlsbad, CA) and BD Gentest (Woburn, MA), respectively. When available, P450 Supersomes coexpressed with cytochrome b5 were used for assays. DM1, (S)-methyl-DM1, DM4, and Lys-MCC-DM1 were obtained from ImmunoGen (Waltham, MA). Bupropion, furafylline, diclofenac, dextromethorphan, dextrorphan, midazolam, 1′-hydroxymidazolam, sulfaphenazole, quinidine, ketoconazole, diethyldithiocarbamate, 6β-hydroxytestosterone, 1-aminobenzotriazole (ABT), α-napthoflavone, paclitaxel, mifepristone, clotrimazole, paroxetine, and chlorzoxazone were purchased from Sigma-Aldrich (St. Louis, MO). (S)-mephenytoin was purchased from Enzo Life Sciences, Inc. (Farmingdale, NY). 6-Hydroxypaclitaxel and reduced β-NADPH were purchased from Calbiochem (San Diego, CA). 4′-Hydroxy-(S)-mephenytoin, 4′-hydroxydiclofenac, 6-hydroxychlorzoxazone, hydroxybupropion, (+)-N-3-benzyl-nirvanol, 4′-hydroxydiclofenac (13C6), 4′-hydroxy-(S)-mephenytoin (2H3), 6β-hydroxytestosterone (2H7), acetaminophen (13C2, 15N), dextrorphan (2H3), hydroxybupropion (2H6), and 1′-hydroxymidazolam (13C3) were purchased from BD Biosciences Discovery Labware (Bedford, MA). Phenacetin and acetaminophen were purchased from MP Biomedicals (Solon, OH). Montelukast and tienilic acid were purchased from Cayman Chemical (Ann Arbor, MI). Testosterone was purchased from Steraloids (Newport, RI). Troleandomycin was purchased from Enzo Life Sciences Inc. Ticlopidine was purchased from Fluka Chemical Corp. (Ronkonkoma, NY). Gemfibrozil 1-O-glucuronide was purchased from Santa Cruz Biotechnology, Inc. (Santa Cruz, CA).
Human P450 Reaction Phenotyping.
To determine the human P450 isozymes responsible for the metabolism of the four maytansinoid species, reaction phenotyping was performed using recombinantly expressed P450 Supersomes. In brief, each substrate (final concentration, 2 μM) was incubated with 2 pmol of CYP1A2, CYP2B6, CYP2C8, CYP2C9, CYP2C19, CYP2D6, CYP2E1, CYP3A4, and CYP3A5 in 100 mM potassium phosphate buffer (pH 7.4; final volume, 100 μl) containing 3 mM magnesium chloride. Reactions (in triplicate) were preincubated at 37°C for 5 min before the addition of 1 mM NADPH (final concentration) to initiate the reaction. Reactions were terminated with the addition of 2 volumes (v/v) of ice-cold acetonitrile containing 0.1 μM tolbutamide as internal standard after 30 min. Samples were subsequently vortexed and centrifuged (1460g for 10 min) before liquid chromatography/tandem mass spectrometry (LC-MS/MS) analysis.
IC50 Determination in Pooled HLM.
In general, incubation conditions were selected that were uniformly applicable to all P450 probe substrate reactions. Minor modifications for individual substrates are noted below. Substrates and inhibitors were prepared in dimethyl sulfoxide [acetonitrile for DM1, (S)-methyl-DM1, and DM4] and subsequently diluted into acetonitrile to achieve the necessary stock concentration. Final incubation conditions consisted of 0.2% dimethyl sulfoxide (v/v) for all reactions.
To evaluate the inhibitory potential of a given test compound toward eight P450 isozymes for IC50 studies, a single concentration (at the measured Km value) of the probe substrate was incubated in combination with the test compound at a final concentration of 0, 0.20, 0.39, 0.78, 1.56, 3.13, 6.25, 12.5, 25, and 50 μM (n = 3). Positive control experiments (n = 2) were also performed (data not shown) with varying concentrations of isozyme-selective inhibitors (CYP1A2, α-naphthoflavone; CYP2B6, clotrimazole; CYP2C8, montelukast; CYP2C9, sulfaphenazole; CYP2C19, (+)-N-3-benzyl-nirvanol; CYP2D6, quinidine; CYP2E1, diethyldithiocarbamate; and CYP3A, ketoconazole). For IC50 experiments, the incubation mixtures (final volume, 0.2 ml) contained microsomal protein (0.1 mg/ml) and 100 mM potassium phosphate buffer (pH 7.4) containing 3 mM MgCl2. The microsomal protein content and incubation time were such that no more than 10% of the substrate was depleted, and product formation was linear with time. Reactions were initiated with the addition of a final concentration of 1 mM NADPH and were allowed to incubate at 37°C in an incubating shaker for 5 min (midazolam), 10 min (bupropion, diclofenac, dextromethorphan, and chlorzoxazone), or 20 min (phenacetin, paclitaxel, (S)-mephenytoin, and testosterone). Each reaction was terminated with the addition of 2 volumes of acetonitrile (v/v) containing the appropriate stable label or tolbutamide as internal standard. The samples were centrifuged (1460g for 10 min) and then analyzed by LC-MS/MS.
IC50 Determination in Recombinant Human CYP3A4 and CYP3A5.
The inhibitory potential of a given maytansinoid species toward midazolam 1′-hydroxylase and testosterone 6β-hydroxylase activity was determined in recombinant P450 Supersomes expressing human CYP3A4 and CYP3A5. These IC50 studies were performed in the same manner as described above in IC50 Determination in Pooled HLM with each incubation mixture containing 1 pmol of enzyme.
Ki Determination in Pooled HLM.
In brief, incubations to determine the inhibition constant of a test compound were conducted in HLM (final concentration, 0.1 mg/ml) mixed with 100 mM potassium phosphate buffer (pH 7.4) and MgCl2 (final concentration, 3 mM). Each experiment was determined (in triplicate) with four concentrations of probe substrate (0.5, 1, 2, and 4 times Km), each of which contained five concentrations of inhibitor including the no inhibitor, solvent control. To reduce variability, scaled-up aliquots of the HLM mixtures were prepared for each of the probe-substrate concentrations in a 15-ml conical tube and gently mixed. These scaled-up HLM/probe mixtures were then added to a deep 96-well polypropylene reaction plate, followed by the addition of the corresponding inhibitor. IC50 experiments were performed (in duplicate) as described previously along with each Ki experiment to serve as a control. The subsequent mixtures were gently mixed and added to a shallow 96-well polypropylene reaction plate used for the final incubation. The final solvent concentrations in each case were ≤1% (v/v). After an initial preincubation period at 37°C for 5 min, reactions were initiated with the addition of NADPH (final incubation concentration, 1 mM) resulting in a total incubation volume of 200 μl. Incubations were terminated after 5 min (midazolam), 10 min (bupropion, diclofenac, dextromethorphan, and chlorzoxazone), or 20 min (phenacetin, paclitaxel, (S)-mephenytoin, and testosterone) by removing an aliquot and immediately adding it to 2 volumes of acetonitrile (v/v) containing the appropriate stable label or tolbutamide as internal standard. The terminated incubations were centrifuged at 1460g for 10 min and then analyzed by LC-MS/MS.
Time-Dependent Inhibition Screen in Pooled HLM.
To evaluate the potential of a test compound to inactivate human P450 isozymes in a time-dependent manner, primary incubations (final volume, 200 μl) containing the test compound (10 μM), microsomal protein (1.0 mg/ml), and 100 mM potassium phosphate buffer (pH 7.4) with 3 mM MgCl2 were initiated with 1 mM NADPH (final concentration) and allowed to proceed up to 30 min at 37°C in an incubator shaker. Aliquots (10 μl) of the primary incubation mixture were removed at select time points (0, 5, 10, 15, and 30 min) and were added to a secondary incubation containing probe substrate (∼4–5 times Km), 1 mM NADPH, and phosphate buffer (pH 7.4) with 3 mM MgCl2. This 20-fold dilution scheme can be used for compounds that exhibit a high degree of reversible inhibition. The final volumes of the secondary incubations were 200 μl. The microsomal protein content and incubation time in the secondary incubations were such that no more than 10% of the substrate was depleted, and product formation was linear with time. Secondary reactions were incubated for 5 min (midazolam), 10 min (bupropion, diclofenac, dextromethorphan, and chlorzoxazone), or 20 min (phenacetin, paclitaxel, (S)-mephenytoin, and testosterone). Each secondary probe substrate reaction was terminated with the addition of 2 volumes of acetonitrile (v/v) containing the appropriate stable label or tolbutamide as internal standard. The samples were centrifuged (1460g for 10 min) and then analyzed by LC-MS/MS. Positive-control experiments were also performed using a similar procedure with known isozyme-specific time-dependent inactivators (TDIs) at 10 μM: furafylline (CYP1A2), ABT (CYP2B6), gemfibrozil 1-O-glucuronide (CYP2C8), tienilic acid (CYP2C9), ticlopidine (CYP2C19), paroxetine (CYP2D6), ABT (CYP2E1), and troleandomycin (CYP3A).
Determination of KI and kinact in Pooled HLM.
For test compounds that result in 20% or greater loss in P450 activity over 30 min in the time-dependent inhibition screen, the inactivation parameters KI (inactivator concentration that supports half the maximal rate of inactivation) and kinact (rate constant for maximal inactivation) were determined. In this case, these inactivation parameters were obtained for CYP3A using nonlinear regression analyses of the observed rates of inactivation over the linear range for each concentration of test compound investigated.
These studies were performed using the following concentration range of test compounds; 0, 2.5, 5, 10, 20, and 40 μM. In brief, primary incubations (final volume, 200 μl) containing the test compound (various concentrations), microsomal protein (1.0 mg/ml), and 100 mM potassium phosphate buffer (pH 7.4) with 3 mM MgCl2 were initiated with 1 mM NADPH (final concentration) and allowed to proceed up to 20 min at 37°C in an incubator shaker. Aliquots (20 μl) of the primary incubation mixtures were removed at select time points on the basis of the rate of inactivation observed in the TDI screen (0, 2.5, 5, 10, 15, and 20 min) and added to a secondary incubation containing probe substrate (∼4–5 times Km), 1 mM NADPH, and phosphate buffer (pH 7.4) with 3 mM MgCl2. The final volumes of the secondary incubations were 200 μl. The microsomal protein content and incubation time in the secondary incubation wells were such that no more than 10% of the substrate was depleted, and product formation was linear with time. Secondary reactions were incubated for 20 min with 250 μM testosterone and were terminated with the addition of 2 volumes of acetonitrile (v/v) containing the appropriate stable label internal standard. The samples were centrifuged (1460g for 10 min) and then analyzed by LC-MS/MS. Positive-control experiments were also performed using a similar procedure using a known CYP3A-specific TDI, mifepristone.
Determination of KI and kinact in Recombinant Human CYP3A4 and CYP3A.
Primary reactions (200 μl) were performed by incubating CYP3A4 or CYP3A5 Supersomes (10 pmol of total P450 enzyme per reaction) containing P450 reductase and cytochrome b5 with different concentrations (0–40 μM) of test compound. For each reaction, 5 μl aliquots were removed at 0, 5, 10, 15, and 30 min and placed into secondary incubations containing 1 mM NADPH and 20 μM midazolam. The secondary reaction volume was 100 μl, providing a 1:20 dilution of the primary incubation. Product formation from midazolam was determined to be linear over the 5-min secondary reaction incubation time. The reactions were terminated with the addition of 2 volumes of acetonitrile (v/v) containing the appropriate stable label internal standard. Resulting samples were centrifuged (1460g for 10 min) and then analyzed by LC-MS/MS.
Metabolite Formation in Recombinant P450.
DM1, DM4, or (S)-methyl-DM1 was incubated in recombinant CYP2D6, CYP3A5, and CYP3A4 at a final concentration of 20 μM (final organic, 0.05%, v/v). Incubations were performed in 100 mM potassium phosphate buffer (pH 7.4), 3 mM MgCl2, and 20 pmol of recombinant isozyme. Incubations were initiated with the addition of NADPH (1 mM) and were allowed to proceed for 30 min before termination by the addition of an equal volume of acetonitrile with 0.1% formic acid. The resultant reactions were centrifuged (1460g for 10 min), and the supernatants were transferred to high-performance liquid chromatography (HPLC) vials for analysis.
Accurate Mass Analysis of Metabolite Samples.
Analysis was performed with an LTQ Orbitrap Velos mass spectrometer fitted with a heated electrospray ion source in line with a Surveyor 1250 pump, photodiode array detector, and PAL autosampler (Thermo Fisher Scientific, Waltham, MA). General source conditions used were as follows: heater temperature, 300°C; sheath gas flow, 40 arbitrary; auxiliary gas flow, 10 arbitrary; and capillary temperature, 350°C. Analysis of DM1 and DM4 was performed in negative ion mode with a spray voltage of 2.5 kV and S-lens radiofrequency levels of 65 and 67%, respectively. Analysis of (S)-methyl-DM1 was performed in positive-ion mode with a spray voltage of 3 kV and an S-lens radiofrequency level of 69%. The HPLC mobile phase consisted of solvent A (0.1% formic acid in water) and solvent B (0.1% formic acid in acetonitrile). Gradients were used to deliver solvent at a constant flow rate (500 μl/min) to a Phenomenex Luna C-18(2), 150 × 2 mm, 5μ column (Phenomenex, Torrence, CA). The gradient conditions used for DM1 and (S)-methyl-DM1 were as follows: 0 to 5 min (5% solvent B), 5 to 20 min (linear increase to 50% solvent B), 20 to 21 min (linear increase to 90% solvent B), 21 to 25 min (90% solvent B), 25 to 25.1 min (linear decrease to 5% solvent B), and 25.1 to 30 min (5% solvent B). For DM4, the conditions were all the same except that from 5 to 20 min, a linear increase to 60% solvent B was used. The mobile-phase flow was split (approximately 1:1) before entry into the source, and the initial and final 5 min of each run were diverted to waste. Full scan mass spectral data were collected in the Fourier transform mass spectrometry analyzer from m/z 600 to 2000 with a resolution of 30,000. MetWorks (version 1.3; Thermo Fisher Scientific) was used to apply multiple mass defect filters to the raw full scan data as follows: DM1: 690 to 920 (175–325), 1020 to 1100 (270–370), and 1440 to 1540 atomic mass units (amu) [465–558 milli-mass units (mmu)]; DM4: 740 to 970 (230–360), 1060 to 1150 (310–420, and 1530 to 1630 amu (553–648 mmu); and (S)-methyl-DM1: 700 to 910 (250–325) and 1020 to 1100 amu (340–374 mmu). Postprocessed data were visualized in Qual Browser (Excalibur version 2.1; Thermo Fisher Scientific), and pseudo-molecular ions were determined for each putative metabolite.
Statistical Analysis.
Standard curve fitting was performed using Analyst (version 1.4; Applied Biosystems, Foster City, CA) with either 1/x- or 1/x2-weighted linear regressions. Substrate saturation curves and inhibition data were plotted and analyzed using GraphPad Prism (version 5.01; GraphPad Software, Inc., San Diego, CA) or Galileo version 3.2 (Thermo Fisher Scientific).
IC50 values were determined by fitting data with the following equation, using the algorithms contained in Galileo:
 Ki estimates were determined by nonlinear regression using the following equation for competitive inhibition as determined by Dixon plots plus Akaike's information criteria and Lineweaver-Burk visualizations:

Inactivation rates are fit to a one-site binding model using the following equation:

LC-MS/MS Quantitation of Analytes for P450 Inhibition and Depletion Studies.
In brief, the LC-MS/MS system was composed of an Applied Biosystems 4000 Q-Trap (operated in multiple reaction monitoring mode) equipped with an electrospray ionization source (Applied Biosystems). The tandem mass spectrometry (MS/MS) system was coupled to two LC-20AD pumps with an in-line CBM-20A controller and DGU-20A5 solvent degasser (Shimadzu, Kyoto, Japan) and a LEAP CTC HTS PAL autosampler equipped with a dual-solvent self-washing system (CTC Analytics, Carrboro, NC). The injection volume was 10 to 20 μl for each sample. For all assays, HPLC separation was achieved using a Gemini C18 2.0 × 30 mm 5-μm column (Phenomenex). Gradient elution (flow rate, 500 μl/min) was performed using a mobile-phase system consisting of 5 mM ammonium formate with 0.1% formic acid and acetonitrile with 0.1% formic acid (Supplemental Fig. S1). HPLC flow was diverted from the MS/MS system for the first 20 s to remove any nonvolatile salts. MS/MS conditions were optimized for individual analytes accordingly. Generic mass spectrometry parameters included the following: curtain gas, 40 arbitrary units; collisionally activated dissociation gas, medium; ion-spray voltage, 4500 V; source temperature, 450°C; and ion source gas 1 and gas 2, 40 arbitrary units, each. Individual conditions for each respective analyte and internal standard are noted in Supplemental Table 1. Retention times for all analytes ranged from 0.94 to 1.12 min.
Results
To investigate which P450 isozymes were responsible for the observed metabolism of the various maytansinoid species, we incubated DM1, DM4, Lys-MCC-DM1, and (S)-methyl-DM1 across a panel of nine recombinant human P450 enzymes. Incubations showing less than 20% depletion of maytansinoid species were considered as showing no depletion in accordance with industry-standard P450 reaction-phenotyping protocols (Wienkers and Stevens, 2003; Zhang et al., 2007). Depletion of Lys-MCC-DM1 at a concentration of 2 μM was insignificant across the panel of P450 isozymes investigated (CYP1A2, CYP2B6, CYP2C8, CYP2C9, CYP2C19, CYP2D6, CYP2E1, CYP3A4, and CYP3A5) with all incubations having greater than 80% remaining parent compound after a 20-min incubation (data not shown). By substrate depletion, CYP2D6, CYP3A4, and CYP3A5 showed metabolic activity toward DM1, DM4, and (S)-methyl-DM1, with less than 80% of parent compound remaining after 30-min incubations (Fig. 2) with the other six P450s studied having no activity (>80% parent remaining). Plasma stability was also assessed and showed that DM1 and DM4 were unstable in plasma (Supplemental Fig. S4).
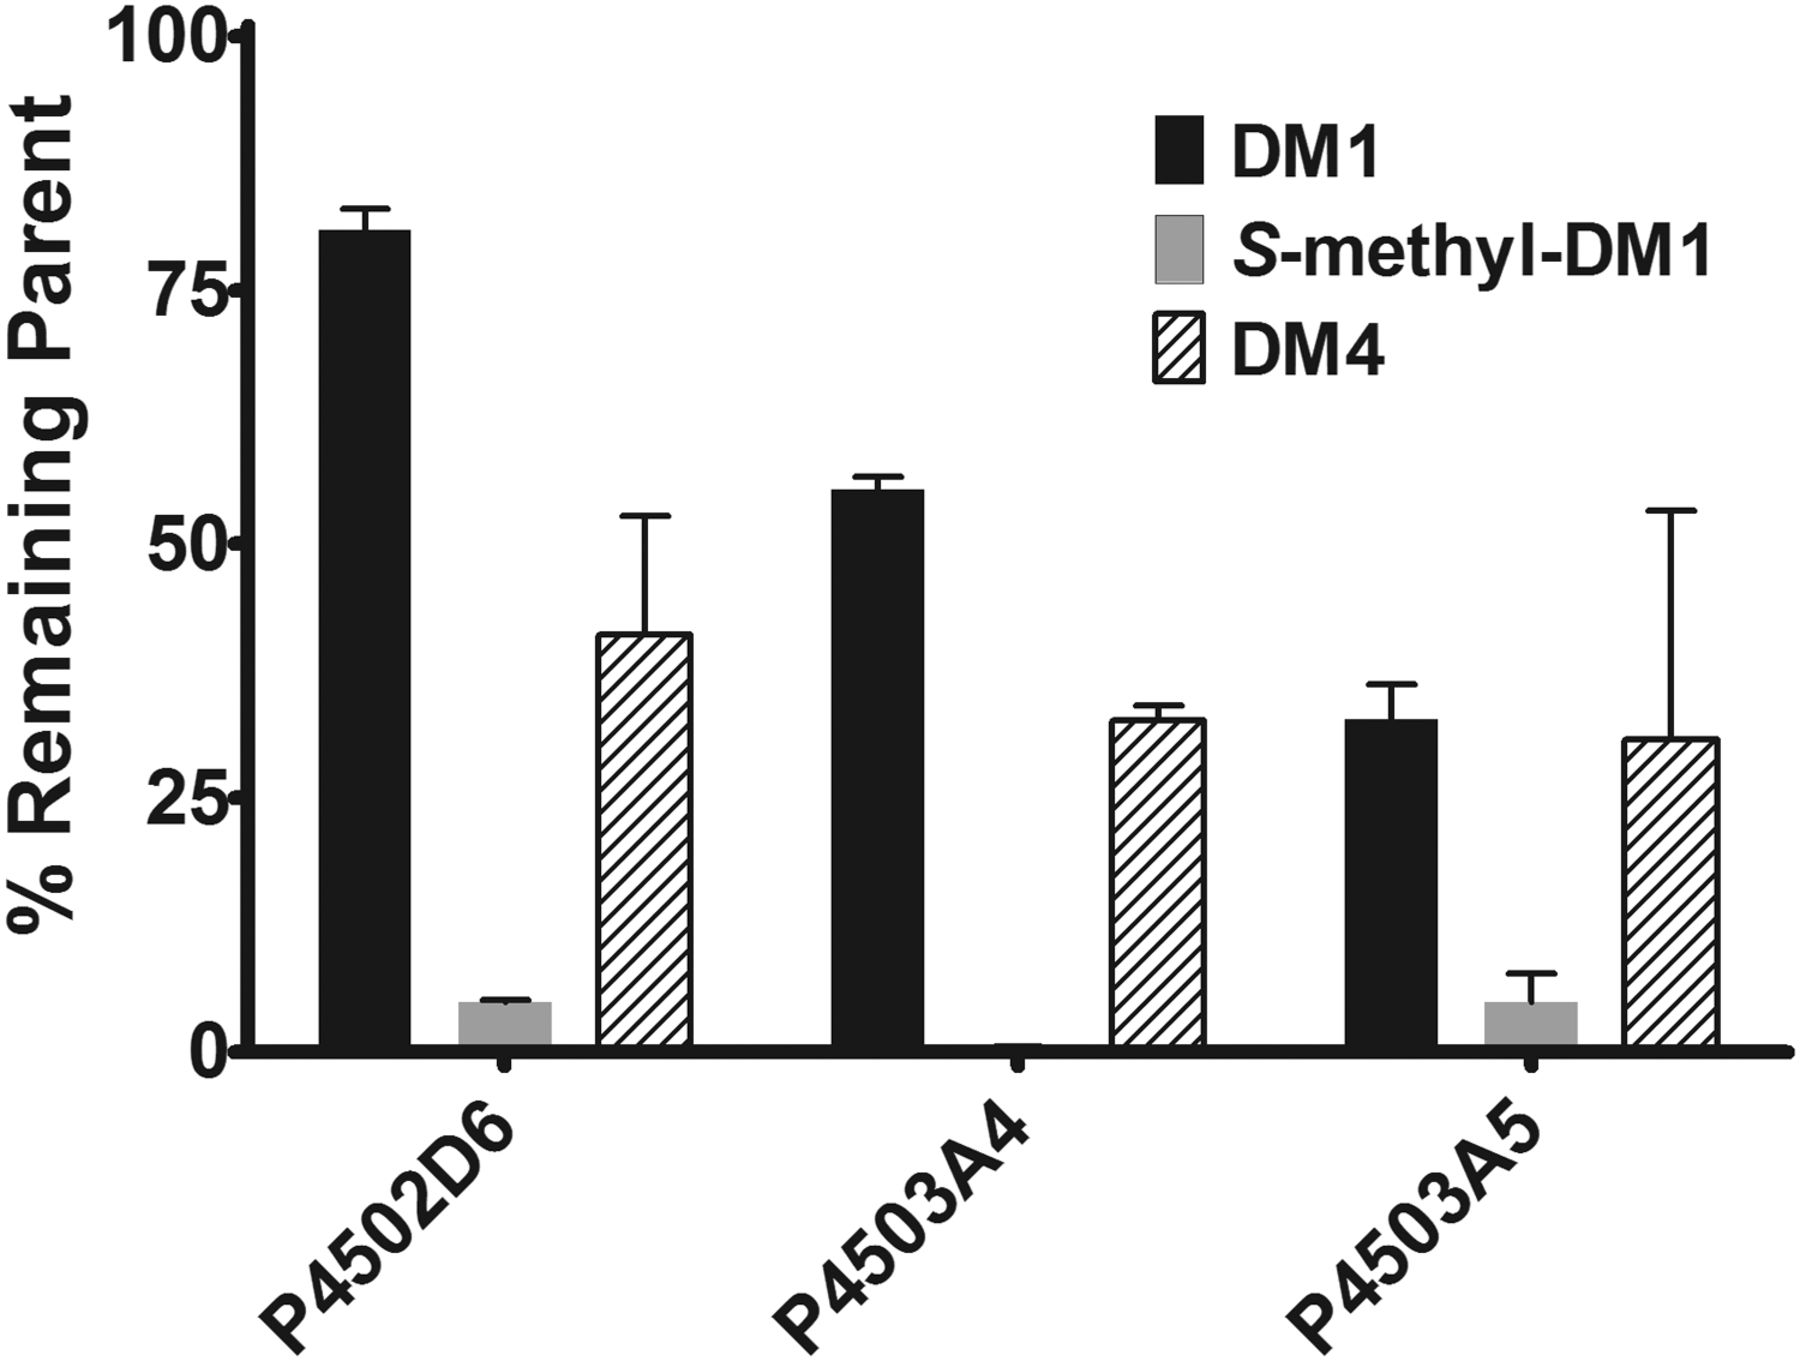
Graph of the percentage remaining of DM1, (S)-methyl-DM1, and DM4 after 30-min incubations with 2 pmol of recombinant human P450s CYP2D6, CYP3A4, and CYP3A5. Each parent compound was incubated in quadruplicate at a concentration of 1 μM in reactions initiated with either buffer (no NADPH control) or NADPH. Percentage remaining was calculated as the ratio of the average of the maytansinoid species remaining plus NADPH samples divided by the average from the corresponding no-NADPH control samples.
DM1, DM4, (S)-methyl-DM1, and Lys-MCC-DM1 were screened for inhibition (IC50) of human P450s in pooled HLM (15 donors) through the use of selective probe substrates (Supplemental Table S2). For Lys-MCC-DM1 and (S)-methyl-DM1, no significant inhibition (IC50 values greater than 50 μM) was observed across the eight major hepatic isozymes investigated (CYP1A2, CYP2B6, CYP2C8, CYP2C9, CYP2C19, CYP2E1, and CYP3A). For P450 isozymes displaying inhibition (IC50 values less than 50 μM) toward DM1 or DM4, experiments to determine the dissociation constant of the enzyme-inhibitor complex (Ki) and mode of inhibition were conducted (Fig. 3). DM1 competitively inhibits CYP2C8 and CYP2D6 with Ki values of 11 ± 3 and 14 ± 2 μM, respectively. DM1 and DM4 both inhibited CYP3A-dependent 1′-hydroxymidazolam and 6β-hydroxytestosterone formation, but because of the irreversible nature of the inhibition (see below), the Ki values are not reported.
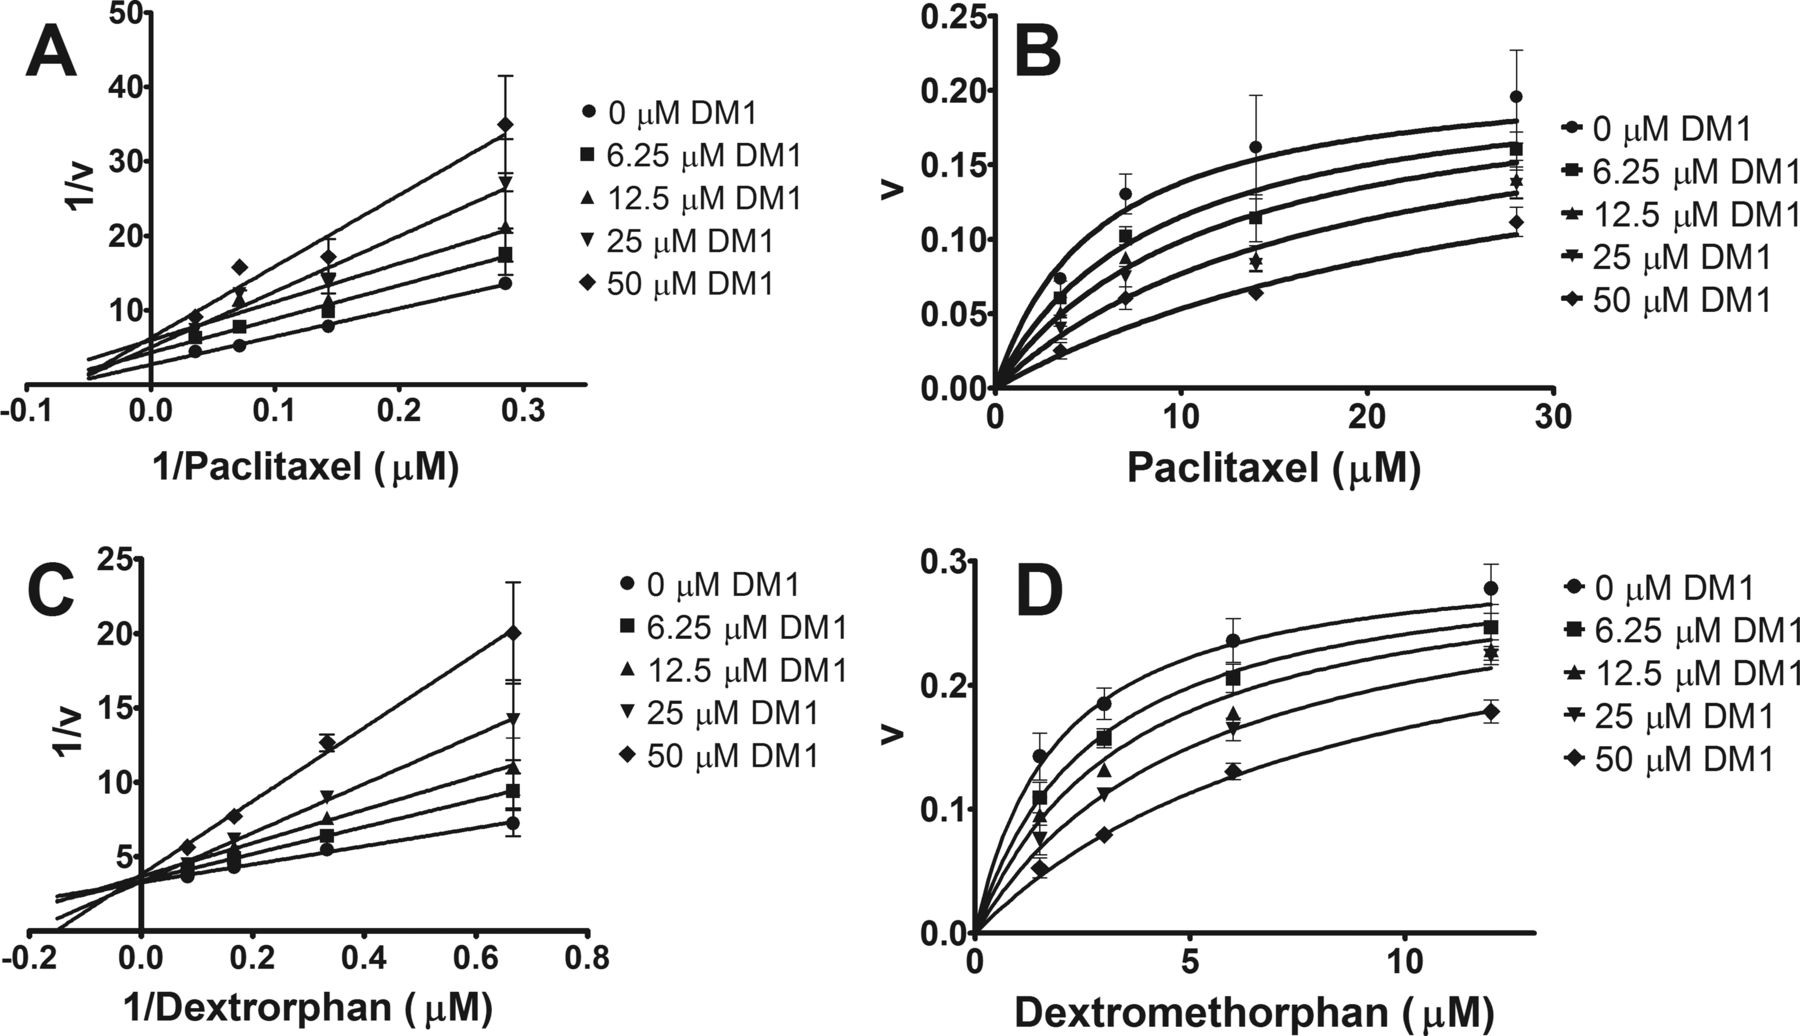
Lineweaver-Burke plots for visual inspection of DM1-dependent reversible inhibition of paclitaxel 6 α-hydroxylation by CYP2C8 (A) and O-demethylation of dextromethorphan by CYP2D6 (C). Reversible inhibition constant (Ki) determined by nonlinear regression with representative fits shown for paclitaxel 6 α-hydroxylation by CYP2C8 (B) and O-demethylation of dextromethorphan by CYP2D6 (D).
DM1, DM4, (S)-methyl-DM1, and Lys-MCC-DM1 were evaluated for irreversible inhibition of human P450s in pooled HLM (15 donors) through the use of selective probe substrates. Maytansinoid species were preincubated with microsomes containing NADPH for varying time points before addition of probe substrates used to measure remaining activity. A total of eight P450s were screened in this study for potential susceptibility to time-dependent inhibition. The P450s investigated were CYP1A2 (phenacetin), CYP2B6 (bupropion), CYP2C8 (paclitaxel), CYP2C9 (diclofenac), CYP2C19 [(S)-mephenytoin], CYP2D6 (dextromethorphan), CYP2E1 (chlorzoxazone), and CYP3A (testosterone). For all four maytansinoid species at a concentration of 10 μM, no time-dependent inhibition (inactivation) was observed for any of the P450s studied (data not shown) except CYP3A. At a concentration of 10 μM, both free thiol-containing maytansinoid species, DM1 and DM4, were time-dependent inhibitors of CYP3A with greater than 20% of activity lost after 5 min of preincubation (Supplemental Fig. S2). In contrast, Lys-MCC-DM1 and (S)-methyl-DM1 were not time-dependent inhibitors of CYP3A. For DM1 and DM4, additional full kinetic assessment of the inactivation of CYP3A was performed to determine the KI/kinact (Fig. 4). For DM1, a KI of 4.8 ± 0.9 μM was obtained with a corresponding kinact of 0.035 ± 0.002 min−1, and for DM4, a KI of 3.3 ± 0.2 μM was obtained with a corresponding kinact of 0.114 ± 0.002 min−1.

CYP3A KI/kinact experiments for DM1 (A) and DM4 (C) with nonlinear regression analysis of time-dependent inhibition parameters for DM1 (B) and DM4 (D). Percentage remaining activity represents percentage of 6β-hydroxytestosterone formation in pooled HLM normalized to that of control (preincubation time equal to zero) with each time point the average of replicates (n = 4).
Differential TDI of CYP3A4 and CYP3A5 for the drug raloxifene has been reported previously (Pearson et al., 2007). To further characterize the observed time-dependent inhibition of CYP3A in pooled HLM, we sought to identify whether DM1 and DM4 inactivate both CYP3A4 and CYP3A5 in a time-dependent manner. To ensure time-dependent inhibition experiments were set up accurately to compare inactivation of CYP3A4 and CYP3A5, we first measured relative affinities of DM1 and DM4 for recombinant human CYP3A4 and CYP3A5 by inhibition. Both DM1 and DM4 observed similar inhibitory potency (as measured by IC50) to CYP3A4 and CYP3A5 with values in the single-digit micromolar range (Supplemental Table S2), arguing that inhibitor and substrate concentrations need not be adjusted for CYP3A4 versus CYP3A5 irreversible inhibition experiments.
Preincubation of CYP3A5 with either DM1 or DM4 in the absence or presence of NADPH showed no time-dependent loss of midazolam 1′-hydroxylase activity (data not shown). For CYP3A4, preincubation with DM1 or DM4 in the absence of NADPH also showed no loss of activity (Fig. 5, A and C). In the presence of NADPH, however, time-dependent loss in CYP3A4 activity when preincubated with either DM1 or DM4 was observed (Fig. 5, B and D). DM1-inactivated CYP3A4 with a KI of 3.4 ± 1.0 μM and a corresponding kinact of 0.058 ± 0.005 min−1, and for DM4, a KI of 1.4 ± 0.3 μM was obtained with a corresponding kinact of 0.117 ± 0.006 min−1 (Supplemental Fig. S3).

Recombinant human CYP3A4 inactivation experiments with DM1 and DM4. Preincubation of CYP3A4 with DM1 (A) and DM4 (C) in the absence of NADPH observes no time-dependent loss of activity. In the presence of NADPH, preincubation of CYP3A4 with both DM1 (B) and DM4 (D) shows a time-dependent decrease in activity.
Oxidative metabolism of DM1 and DM4 was similar across CYP2D6, CYP3A4, and CYP3A5 with oxidation of the sulfur to sulfinic and sulfonic acid metabolites (Fig. 6). DM1 formed GSH conjugates equivalent to oxidative product formation, whereas DM4 formed a fraction of the GSH conjugate relative to sulfur oxidized products. DM1 also formed varying degrees of dimer as a result of intramolecular disulfide formation with the largest amount of dimer formed in incubations with CYP2D6 and less but equivalent amounts in incubations with CYP3A4 and CYP3A5. Incubations of (S)-methyl-DM1 with CYP2D6, CYP3A4, and CYP3A5 showed oxidative metabolism of the sulfur moiety to form both sulfoxide and sulfone metabolites. The metabolism of Lys-MCC-DM1 was investigated, but no metabolism was observed (data not shown). Incubation of DM1 and DM4 in plasma (Supplemental Fig. S4) resulted in depletion of parent drug as a result of intramolecular and intermolecular disulfide formation (data not shown).

Recombinant P450 metabolism of DM1, DM4, and (S)-methyl-DM1 with CYP3A4 (A) and CYP2D6 (B). Metabolism results for CYP3A4 are representative of similar results observed with CYP3A5.
Discussion
The observation that patients in the oncology setting are at a higher potential risk for drug-drug interactions (DDIs) has been covered extensively (Beijnen and Schellens, 2004; Blower et al., 2005; Meijerman et al., 2006; Scripture and Figg, 2006; Hanigan, 2009; Riechelmann and Del Giglio, 2009). Cancer patients often require additional medications because of treatment-induced toxicity and cancer-related syndromes (Riechelmann and Del Giglio, 2009). The incidence of complementary and alternative medicines by cancer patients is also on the rise (Gratus et al., 2009a,b) with reports of up to 72% of patients not informing their treating physician about their complementary and alternative medicine use (Sparreboom et al., 2004). Given the high propensity for concomitant medication use, the need to underwrite the drug interaction potential of new oncology agents is imperative.
The resultant catabolites of disulfide versus thioether-linked AMCs form unique molecules possessing distinct chemical properties. The thioether-linked conjugated antibodies result in the formation of Lys-MCC-DM1, a zwitterionic, high-molecular-mass (1102.3 Da) and low cLogP (1.8) molecule. The thioether linkage is stable with low levels of degradation observed in vivo (Girish et al., 2012), restricting the sulfur in DM1 from reacting with other biological constituents. As expected, the physiochemical properties of Lys-MCC-DM1 prevented appreciable interaction with any of the major hepatic P450 isozymes tested herein, as evidenced by the lack of both metabolism and inhibition. In contrast, DM1 and DM4 liberated from cleavable disulfide-conjugated AMCs average 30% lower molecular mass and have increased cLogP (values >4). These attributes play a role in the inhibition of CYP3A observed by both DM1 and DM4 and to a lesser extent CYP2C8 and CYP2D6 for DM1. (S)-Methyl-DM1 was extensively metabolized by recombinant CYP2D6, CYP3A4, and CYP3A5 but lacked inhibition against any of the P450s investigated. Under our inhibition assay conditions in HLM, after 10 and 20 min of incubation time, depletion of (S)-methyl-DM1 was less than 10 and 40%, respectively, arguing depletion was not the primary driver for the lack of inhibition. The lower depletion of (S)-methyl-DM1 in microsomal incubations compared with incubations with recombinantly expressed P450s could be due to higher nonspecific binding in microsomal fractions (Gertz et al., 2008).
DM1 and DM4 are shown here to inactivate hepatic CYP3A. Given the reactivity of the thiol present in both DM1 and DM4 and their susceptibility to oxidation (Widdison et al., 2010), it is possible that the inactivation of CYP3A4 is mediated through covalent bond formation. In the same study, no oxidation of the epoxide moiety was observed (Widdison et al., 2010), arguing the NADPH-dependent TDI observed is not through the epoxide. The DM1- and DM4-mediated TDI in CYP3A was further explored using recombinant enzymes. Previous studies from our group demonstrated the presence of an accessible reactive cysteine present in CYP3A4 but not in CYP3A5 (Pearson et al., 2007). The position of this cysteine facilitates trapping of reactive intermediates and is capable of leading to enzyme inactivation (Baer et al., 2007). Inactivation kinetics in recombinant CYP3A4 reflect the TDI observed in microsomes. In contrast, CYP3A5 did not observe TDI when preincubated with DM1 or DM4 in the presence of NADPH. TDI experiments were also performed in the absence of NADPH to explore the potential reactivity of the parent drugs' thiol. Under these conditions, no TDI was observed, providing evidence that oxidation of the free thiol is required for eliciting TDI in CYP3A4. These results, combined with the lack of TDI observed herein with (S)-methyl-DM1, argues that the mechanism of DM1- and DM4-mediated CYP3A4 TDI involves their thiol moiety and potentially cysteine 239 of CYP3A4, similar to what has been reported for raloxifene (Pearson et al., 2007). Further characterization of the mechanism of inactivation is currently underway. However, for an accurate prediction of the DDI potential of AMC catabolites DM1 and DM4, further characterization of the physiologically relevant DM1 and DM4 species accessible to CYP3A4 (and CYP2C8 and CYP2D6 for DM1) as free unconjugated catabolite is required.
In the clinic, trace levels of DM1 have been reported from studies with the thioether-linked trastuzumab-DM1 (T-DM1) with insufficient data for an accurate area-under-the-curve determination and no reported accumulation upon multiple dosing of T-DM1 (Gupta et al., 2012). The average maximal concentration (Cmax) of DM1 ranged from 4.6 ± 1.3 to 5.4 ± 1.6 ng/ml (∼7 nM) from three different clinical studies with T-DM1 (Krop et al., 2010; Burris et al., 2011). However, DM1 concentrations reported in these studies were measured after tris(2-carboxyethyl)phosphine reduction and derivatization with n-ethylmaleimide. This procedure reduces the extrahepatic intramolecular and intermolecular disulfides of DM1 formed in plasma, leading to overestimation of circulating free DM1 concentrations. The consistently low plasma concentrations reported in the clinic for DM1 have been proposed to be to the result of low systemic release of DM1 (thioether-linkage instability) in circulation, rapid elimination of DM1, and/or a high volume of distribution of DM1 (Girish et al., 2012; Gupta et al., 2012). In a similar fashion, early clinical studies with AVE9633, an AMC using cleavable disulfide-linked DM4, also show low levels of free DM4 in plasma with DM4 exhibiting a more rapid clearance than that of the parent molecule AVE9633 (Lapusan et al., 2012). At the maximal tolerated dose, the measured concentrations of DM4 at Cmax ranged from 1 to 3 ng/ml (∼1.3–3.9 nM). Current evidence of rapid clearance in vitro (Supplemental Fig. S4) and in vivo of both free DM1 and DM4 in plasma from preclinical species and humans (Boudreaux et al., 2012; Girish et al., 2012; Lapusan et al., 2012), combined with the observed low exposures discussed above, argues for a low burden of systemically derived free DM1 or DM4 from thioether- or disulfide-linked AMCs reaching the liver.
However, it is unknown whether plasma concentrations of free DM1 or DM4 represent the physiologically relevant in vivo concentration of inactivating species accessible to CYP3A4. Endogenous immunoglobulins are primarily cleared through the reticuloendothelial system (RES) by proteolytic degradation in reticuloendothelial and hepatic cells (Gupta et al., 2012). For AMCs, clearance is via dual mechanisms, specific antigen target-mediated disposition, and nonspecific RES, as observed with T-DM1 in the clinic (Girish et al., 2012). As tumor burden (antigen load) diminishes upon treatment and target-mediated clearance of an AMC theoretically decreases, catabolism through RES will play a more significant role in AMC clearance. In a similar fashion, dosing of an AMC above the target-mediated threshold to yield linear pharmacokinetics would theoretically lead to an increase in clearance of the AMC through RES. Therefore, hepatic concentrations of DM1 and DM4 would be dependent on catabolism of maytansinoid conjugates within the liver. Hepatic catabolism of thioether-linked AMCs with DM1 as the cytotoxic agent would result in the low to no potential DDI catabolite Lys-MCC-DM1. For disulfide-linked AMCs, accumulation in the liver of either DM1 or DM4 could potentially affect the use of concomitant mediations.
In conclusion, the physiochemical properties of the noncleavable thioether-derived AMC catabolite, Lys-MCC-DM1, prevent interactions with the major drug-metabolizing P450s studied, resulting in no observable metabolism (Widdison et al., 2010) or inhibition (herein). AMCs using thioether-linked DM1 as their cytotoxic agent are predicted to have no potential for an in vivo DDI with any of the major human P450s studied. The free maytansine catabolites DM1 and DM4 from cleavable disulfide-linked AMCs inactivate CYP3A4 in a NADPH-dependent manner, with DM1 also competitively inhibiting CYP2C8 and CYP2D6. However, given the limited exposure observed in the clinic thus far, combined with the rapid conjugation of DM1 in plasma, no DDIs are anticipated for DM1. However, further characterization of the relevant in vivo DM1 and DM4 species and their hepatically accessible concentrations of free unconjugated catabolite is required before an accurate prediction of the DDI potential of cleavable disulfide-linked AMCs can be undertaken.
Authorship Contributions
Participated in research design: Rock and Pearson.
Conducted experiments: Davis, Rock, and Pearson.
Performed data analysis: Davis and Pearson.
Wrote or contributed to the writing of the manuscript: Davis, Rock, Wienkers, and Pearson.
Acknowledgments
We thank Rob Foti (Amgen Department of Pharmacokinetics and Drug Metabolism) for critical review of this manuscript, Brooke VandenBrink (Amgen Department of Pharmacokinetics and Drug Metabolism) for help with assay development, and ImmunoGen for providing the Lys-MCC-DM1 material.
Footnotes
Article, publication date, and citation information can be found at http://dmd.aspetjournals.org.
↵
 The online version of this article (available at http://dmd.aspetjournals.org) contains supplemental material.
ABBREVIATIONS:
- ADC
- antibody-drug conjugate
- AMC
- antibody-maytansine conjugate
- DM1
- N2′-deacetyl-N2′-(3-mercapto-1-oxopropyl)-maytansine
- DM3
- N2′-deacetyl-N2′-(4-mercapto-1-oxopentyl)-maytansine
- DM4
- N2′-deacetyl-N2′-(4-mercapto-4-methyl-1-oxopentyl)-maytansine
- SMCC
- N-succinimidyl 4-(N-maleimidomethyl) cyclohexane-1-carboxylate
- SPP
- N-succinimidyl 4-(2-pyridyldithio)pentanoate
- Lys-MCC-DM1
- lysine-Nε-SMCC-DM1
- DDI
- drug-drug interaction
- SPDB
- N-succinimidyl 4-(2-pyridyldithio)butyrate
- P450
- cytochrome P450
- LC-MS/MS
- liquid chromatography/tandem mass spectrometry
- HLM
- human liver microsomes
- ABT
- 1-aminobenzotriazole
- TDI
- time-dependent inactivation
- HPLC
- high-performance liquid chromatography
- amu
- atomic mass unit
- mmu
- milli-mass unit
- MS/MS
- tandem mass spectrometry
- T-DM1
- trastuzumab-DM1
- RES
- reticuloendothelial system.

- Received April 9, 2012.
- Accepted June 29, 2012.
- Copyright © 2012 by The American Society for Pharmacology and Experimental Therapeutics


