


Abstract
Several microRNAs (miRNAs) were selected for characterization of their response to insulin signaling based on in silico predictions of targeting CYP2E1 mRNA and previous reports implicating their role in hepatic metabolism and disease. CYP2E1 expression decreases with increasing insulin concentration and has been shown to be regulated by the phosphatidylinositol 3-kinase (PI3-K)/protein kinase B (Akt)/mammalian target of rapamycin (mTOR) signaling pathway. In primary cultured rat hepatocytes, insulin at 0.1, 1.0, and 10 nM elevated miRNA-132 and -212 expression ∼2- and 1.8-fold, respectively, whereas expression of miRNA-181a and -122 increased ∼1.6- and 1.4-fold, respectively. In contrast, insulin failed to alter significantly the expression of miRNA let-7a. Mechanistic studies using inhibitors of PI3-K, Akt, and mTOR were used to examine the role of the insulin signaling pathway on miR expression and resulted in significant suppression of the insulin-mediated elevation of miR-132, miR-212, and miR-122 levels, with a lesser effect observed for miR-181a. Targeting of the rat CYP2E1 3′-untranslated region (UTR) by miR-132 and -212 was demonstrated with an in vitro luciferase reporter assay. These data show that insulin, which regulates CYP2E1 through the PI3-K, Akt, mTOR signaling pathway, also regulates the expression of miRs that target the 3′-UTR of CYP 2E1 mRNA and are involved in the regulation of hepatic metabolism and disease.
Introduction
MicroRNAs (miRNAs) consist of 20–25 nucleotides, and are endogenously expressed noncoding RNAs that negatively regulate target messenger RNAs via inhibition of mRNA stability and translation (Hudder and Novak, 2008). One-third of all human gene RNAs are predicted targets of miRNAs (Lewis et al., 2005), highlighting the abundance and importance of miRNAs in regulating mRNA translation and degradation and hence serving as regulatory molecules. The regulation of genes by miRNAs is complex, with single miRNAs targeting multiple mRNAs and several miRNAs binding one mRNA, working cooperatively to silence gene expression. The miRNAs have been associated with cell development and differentiation, apoptosis, fatty acid metabolism, hormone secretion, long-term memory, limb regeneration, as well as a multitude of other diverse pathophysiological events and conditions, including diabetes, oxidative stress, and cardiac disease. In addition, studies have uncovered an important fundamental role for miRNAs in many cancers (Calin et al., 2004; Kerr et al., 2011).
The biosynthesis of miRNAs is a complex, multistage process, beginning with the transcription of the miRNA gene to a primary miRNA, typically greater than 100 bp long. The primary miRNA is processed by the RNase III enzyme Drosha, resulting in a double-stranded precursor miRNA (pre-miRNA) of 60–70 nucleotides. The pre-miRNA is exported from the nucleus into the cytoplasm and is subjected to cleavage by another RNase III enzyme, Dicer, producing a double-stranded miRNA duplex 20, which is 20 nucleotides long. The duplex is cleaved, and a single strand forms the mature miRNA (Hudder and Novak, 2008; Krol et al., 2010).
Insulin and its physiologic effects have been extensively studied, and insulin and insulin-like growth factor I activation of signaling pathways have been well characterized (Esguerra et al., 2011). The effects of insulin and activation of the phosphatidylinositol 3-kinase (PI3-K) signaling pathway on miRNA expression have not yet been examined in primary cultured hepatocytes; however, insulin-mediated regulation of miRNAs could constitute a significant element of its pathophsyiological effects. Global profiling of miRNAs in human skeletal muscle revealed that insulin regulates the expression of muscle-specific miRNAs, supporting the hypothesis that some of insulin’s downstream effects are dependent on the regulation of miRNAs (Gallagher et al., 2010). However, no study has yet been undertaken to examine insulin’s effects on miRNA expression in primary cultured hepatocytes. Such a study in hepatocytes could increase the scope of our understanding of the mechanism of insulin’s activity on its target genes in the liver. Of particular interest is the expression of miRNAs implicated in liver disease and those predicted to target drug-metabolizing enzymes that are regulated in response to insulin activation of the PI3-K signaling pathway.
The current study aimed to determine the effects of insulin treatment on miRNA expression in primary cultured rat hepatocytes, as well as establish the role of PI3-K, protein kinase B (Akt), and mammalian target of rapamycin (mTOR) in the regulation of targeted miRNA levels. Four target miRNAs were chosen for investigation based on their previously reported role in regulating hepatic metabolism or in hepatic disease, including obesity, diabetes, hepatitis, and hepatocellular carcinoma (Guay et al., 2011; Xu et al., 2011; Hsu et al., 2012) or their predicted targeting of CYP2E1. miR-122 has been shown to be involved in the regulation of gene networks, metabolic pathways, hepatic function, response to toxicants, and disease (Guay et al., 2011; Ji and Wang, 2009). miR-181a has been implicated in the regulation of starvation and rapamycin-induced autophagy and has been found to be elevated in the blood in type 1 diabetes (Nielsen et al., 2012; Tekirdag et al., 2013). Both miRs-212 and -132 were predicted by a consensus of multiple computational methods to target rat CYP2E1, a drug-metabolizing enzyme that is upregulated in diabetes and has been implicated as a risk factor in hepatocellular carcinoma. The mechanism of CYP2E1 induction in response to impaired insulin signaling has remained elusive. Elevated CYP2E1 expression in subjects with metabolic disease is of concern because of the potential for increased xenobiotic metabolism and production of hepatotoxic metabolites. We hypothesized that microRNAs may be involved in insulin-mediated CYP2E1 regulation, and we focused our investigation on the two microRNAs having the greatest likelihood of regulating the gene based on rigorous computational predictions. Hence, mechanistic studies using quantitative real-time polymerase chain reaction (qRT-PCR) analysis of target miRNAs were conducted using insulin and inhibitors of downstream serine and threonine kinases in the insulin signaling pathway to identify the role of this pathway and these kinases in the regulation of miRNA expression.
Materials and Methods
Modified Chee’s medium and l-glutamine were obtained from Invitrogen (Carlsbad, CA). Insulin (Novolin R) was purchased from Novo-Nordisk (Princeton, NJ). Collagenase (type I) was purchased from Worthington Biochemicals (Freehold, NJ). PureCol (97% type I collagen, 3% type III collagen) was obtained from Advanced BioMatrix (San Diego, CA). LY294002 (2-morpholin-4-yl-8-phenylchromen-4-one) and rapamycin were obtained from Calbiochem (San Diego, CA). The Akt inhibitor A-443654 [(2s)-1-(1h-Indol-3-Yl)-3-{[5-(3-Methyl-1h-Indazol-5-Yl)pyridin-3-Yl]oxy}propan-2-Amine] was obtained from Dr. Giranda (Abbott Laboratories, Abbott Park, IL). Reagents for reverse transcription PCR and real-time PCR (Taqman microRNA reverse transcription kit, TaqMan fast advanced master mix 2X, TaqMan microRNA probe) were purchased from Applied Biosystems, Inc. (Foster City, CA).
Luciferase 3′-Untranslated Region Reporter Assay.
A Luc-Pair miR luciferase assay was used to demonstrate targeting of the rat CYP2E1 3′-untranslated region (UTR) by miR-132 and -212. A CYP2E1 3′−UTR luciferase reporter construct (RmiT051147-MT01), rno-miR-132, and rno-miR-212 precursor expression plasmids (RmiR6036-MR04 and RmiR6108-MR04, respectively) and scrambled control expression vector (CmiR0001-MR04) were all obtained from Genecopoeia (Rocokville, MD). Renilla luciferase is included on the 3′-UTR CYP2E1 construct and was used to normalize for transfection efficiency. Cos-7 cells were used for the luciferase reporter experiment. Dulbecco’s modified Eagle’s medium (high glucose; Gibco Life Technologies, Grand Island, NY) with 10% fetal bovine serum was used to plate the cells. The cells were plated in a 96-well flat-bottom white plate. After 24 hours, cells were transfected with 3′-UTR-luc reporter and microRNA expression vector (or control vector) in the concentration ratio of 2:4, respectively, with Lipofectamine (Life Technologies) per the manufacturer’s instructions. Transfections were performed using three replicates for each condition. After 48 hours of transfection, the Renilla and Firefly luciferase activities were quantified by the Luc-Pair miR luciferase assay system (Genecopoeia) and measured on a FlexStation 3 universal plate reader (Molecular Devices). Data analysis was performed using Softmax Pro (Molecular Devices, LLC, Sunnyvale, CA). Expression of the 3′−UTR reporter was measured by Firefly luciferase luminescence and normalized using the control Renilla-luc luminescence. Normalized expression values were compared between transfections with the scrambled control vector and those with each pre-miR vector. A two-tailed Student’s t test with equal variance was used to determine statistical significance.
Primary Rat Hepatocyte Culture.
Hepatocytes were isolated from the livers of male Sprague-Dawley rats (200–300 g) using collagenase perfusion as described previously (Woodcroft et al., 2002). Hepatocytes were plated onto dishes covalently coated with Purecol, and modified Chee’s medium was fortified as described previously (Woodcroft et al., 2002) and supplemented with 1 μM insulin, 0.1 μM dexamethasone, 12.5 mg/ml transferrin, 50 μg/ml gentamycin, and 2 mM l-glutamine. Cells were plated at a density of 3 × 10⁶ cells/60-mm dish. Hepatocytes were incubated in a humidified 37°C incubator with 95% air/5% CO2 atmosphere. Four hours after the initial plating, cells were washed with insulin-free medium three times and cultured in insulin-free medium before initiation of treatment with insulin or inhibitors.
Treatment of Primary Cultured Hepatocytes.
Hepatocytes were treated with insulin at 0.1, 1, and 10 nM concentrations 48 hours after plating. The PI3-K inhibitor LY294002, the mTOR (TORC1) inhibitor rapamycin, and the pan Akt inhibitor A-443654 were dissolved in dimethylsufoxide and added 1.5 hour before the addition of insulin. LY294002, rapamycin, and A-443654 were used at the concentrations of 1 µM, 500 nM, and 10 µM, respectively. Treatment of cells continued for 24 hours before harvesting of cells and isolation of RNA. Total hepatocyte RNA was extracted by using Trizol (Invitrogen) according to the manufacturer’s protocol. The concentration (ng/μl) of the purified RNA was quantified using the Nano Drop, version 3.3 (Applied Biosystems). The quality of the RNA was assessed by Agilent RNA 6000 Nano kit (Agilent Technologies, Böblingen, Germany), which estimates the ratio of the band intensity of 28S and 18S rRNA. Statistical analysis was performed on triplicate preparations of total RNA from a single hepatocyte preparation. Reproducibility of results was confirmed in at least three hepatocyte preparations. The Wayne State University Animal Investigation Committee approved all experimental procedures involving animals.
Reverse-Transcription RT-PCR Analysis.
The cDNA templates were prepared from total RNA using the TaqMan microRNA Reverse Transcription kit, which utilizes the stem-loop reverse primers, according to manufacturer’s protocol (Applied Biosystems). qRT-PCR was performed to measure the relative expression of miRNAs among the treatments using an ABI 7500 Fast RT-PCR System (Applied Biosystems). The expression of mature miRNAs was assayed using the Taqman microRNA assay specific for hsa-mir-122, hsa-mir-132, hsa-mir-212, hsa-mir-181a, and hsa-mir-let7a (has, Homo sapiens), and the expression level was normalized to 4.5s rRNA. The Taqman probes targeting human (hsa) and rat (rno) miRNAs were identical, and termed hsa assays by Taqman. Relative expression was calculated using the comparative cycle threshold method.
Statistics.
Data are represented as mean ± S.E., and statistical significance was determined with unpaired two-tailed Student’s t test.
Results
Identification of MicroRNAs Predicted to Regulate Rat CYP2E1.
To identify microRNAs likely to target CYP2E1, we used a computational approach that uses a consensus of multiple prediction methods. Computational methods are widely used to predict target transcripts of microRNAs. It is recognized that these methods often have high false-positive rates, and one approach to reduce false positives and improve accuracy is to rely on the consensus of multiple independent computational methods. Accordingly, we used the Web-based application miRWalk to perform consensus-based identification of microRNAs predicted to target CYP2E1 (Dweep et al., 2011). Using the rat CYP2E1 transcript (NM_031543), we found that the two microRNAs predicted by the greatest number of computational methods to target CYP2E1 were miRs rno-miR-212 and -132. Each of these microRNAs was predicted by four independent methods (miRanda, miRDB, miRWalk, PITA [Probability of Interaction by Target Accessibility]) to target the CYP2E1 3′-UTR. The next highest scoring candidates included one microRNA predicted by three methods to target CYP2E1 and three microRNAs predicted by two methods to target the gene, and the remaining predictions were restricted to a single computational method. Figure 1A shows the target site in the rat CYP2E1 3′-UTR for miRs-212 and -132.
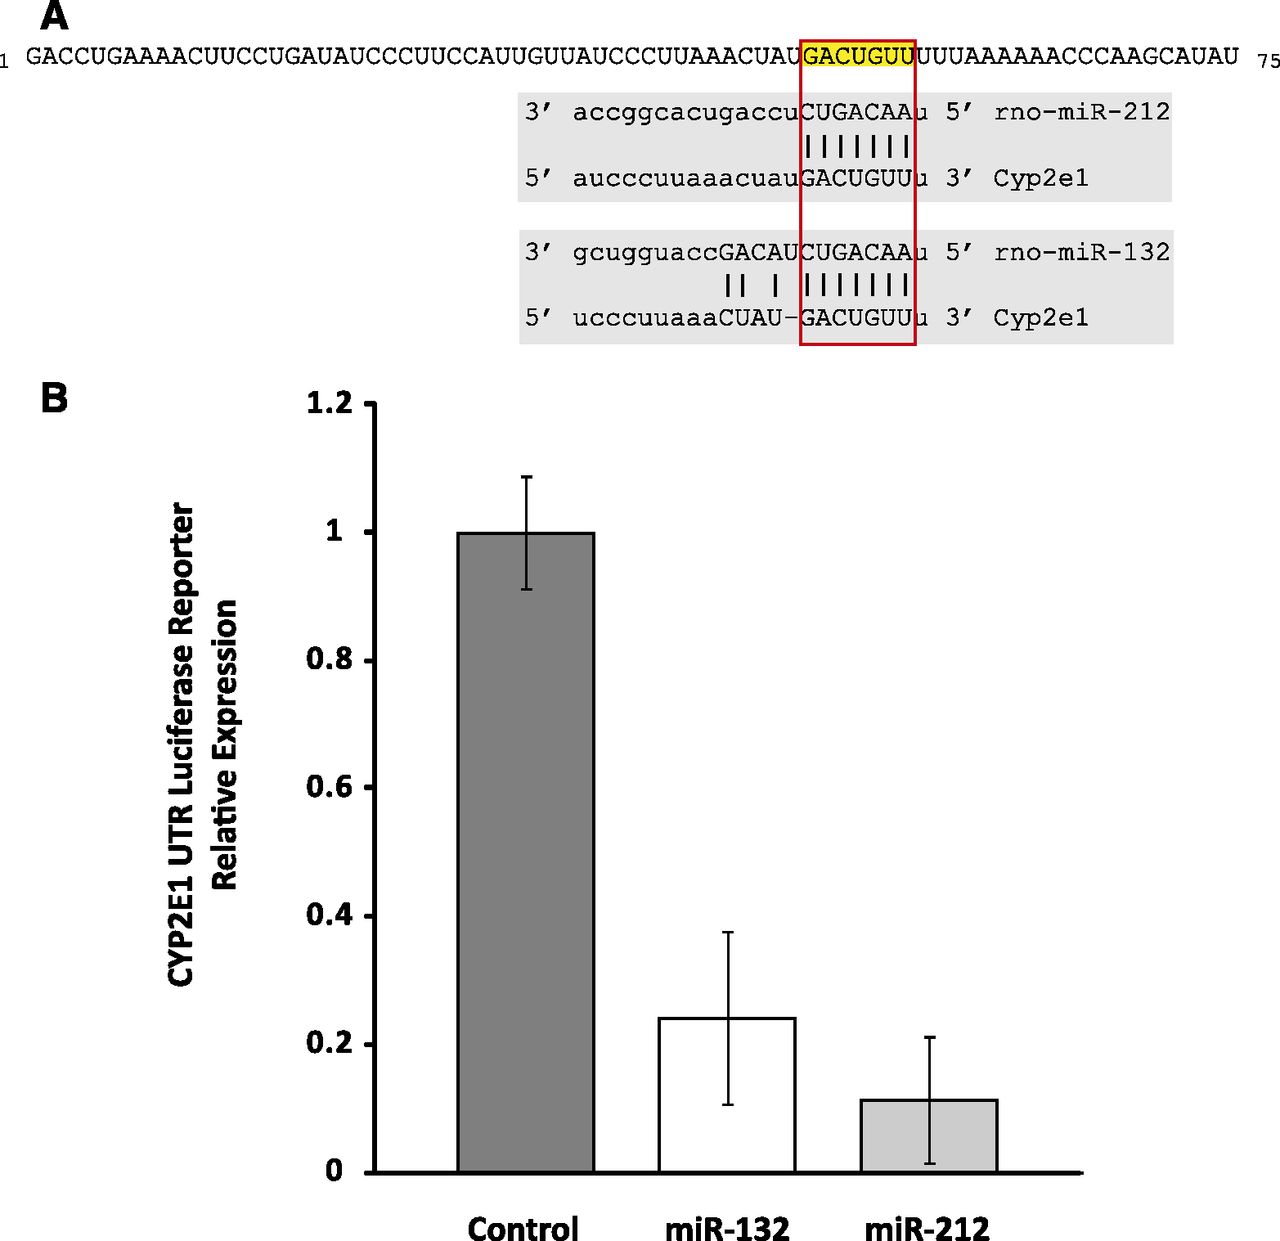
(A) The rat CYP2E1 transcript is predicted by a consensus of computational methods to be regulated by microRNAs miR-212 and -132. The first 75 nucleotides of the CYP2E1 3′-UTR are shown, with the predicted target sites highlighted. (B) Rat CYP2E1 3′-UTR is targeted by miR-132 and -212. A luciferase reporter assay was used to confirm targeting of the rat CYP2E1 3′-UTR by miR-132 and -212. A Luc-Pair miR luciferase reporter with the 3′-UTR of CYP2E1 was cotransfected into Cos-7 cells with a vector expressing pre–miR-132, -212, or scrambled control. Expression levels are shown relative to control. Transfection with pre–miR-132 or -212 resulted in approximately 75 and 90% decrease in reporter signal, respectively (P = 0.013; P = 0.002) demonstrating targeting of the 3′-UTR by the microRNAs. Error bars are standard error.
Rat CYP2E1 3′-UTR Is Targeted by miR-132 and -212.
To confirm computational predictions that miRs-132 and -212 target rat CYP2E1, we used a luciferase 3′−UTR reporter assay. A vector construct was created with the firefly luciferase reporter gene and the 3′-UTR of rat CYP2E1. Luc-Pair miR luciferase assays were performed by transfecting the vector into the Cos-7 cell line along with vectors expressing a pre-miR or scrambled control. The Cos-7 cell line has been widely used for microRNA target validation assays. Cotransfection of pre–miR-132 or -212 with the reporter plasmid containing 3′−UTR CYP2E1 showed a dramatic reduction in the luciferase signal compared with transfection with a scrambled pre-miR control. Pre–miR-132 and -212 resulted in 75 and 90% decrease, respectively (P = 0.009 and 0.003) in expression of the reporter construct (Fig. 1B), indicating direct targeting of rat CYP2E1 by miR-132 and -212.
Insulin Effects on miRNA Expression.
miR-132 and -212 are of the same miRNA family, target the same putative sequence in CYP2E1, and colocalize to the same genomic region in rats, humans, and mice and hence are referred to as the miR-132/212 cluster (Remenyi et al., 2010). Primary rat hepatocytes either contained no insulin or were treated with low (i.e., diabetic plasma–level insulin) (0.1 nM insulin), normal (1.0 nM insulin), or supraphysiologic (10 nM) insulin for 24 hours, and miRNA expression was determined with qRT-PCR and data reported relative to untreated (no insulin) cells. Insulin treatment of hepatocytes increased miR-132 expression ∼2-fold at 1.0 nM insulin, relative to controls, with no additional increase monitored at 10 nM insulin (Fig. 2A). Insulin progressively increased miR-212 levels in a concentration-dependent manner, with 1 and 10 nM insulin producing statistically significant increases of ∼1.5- and ∼1.7-fold, respectively, relative to untreated cells (Fig. 2B).
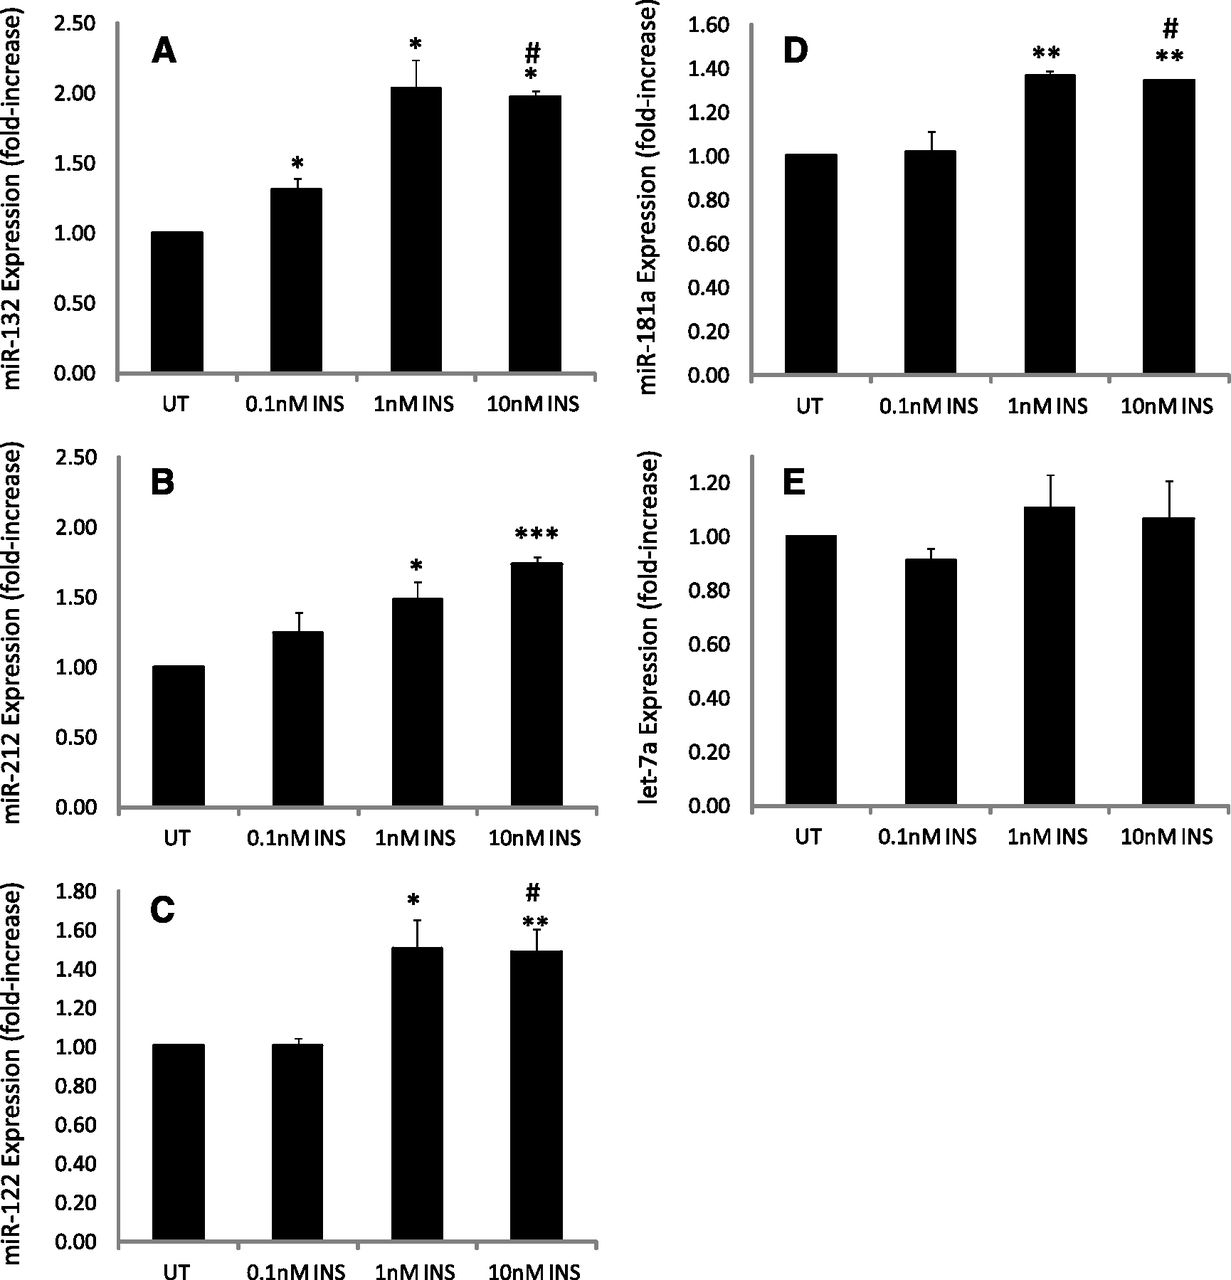
Primary cultured rat hepatocytes either contained no insulin or were treated with 0.1, 1.0, or 10 nM insulin, RNA was extracted and miRNA expression quantified as described in Materials and Methods. The data show the concentration-dependent effects of insulin on (A) miRNA-132 expression, (B) miR-212 expression, (C) miR-122 expression, (D) miR-181 expression, and (E) miR let-7a expression. Whereas insulin produced a concentration-dependent increase in miR-132 and -212 expression, the effects of insulin on miR-122 and -181a occurred at 1 and 10 nM, with little, if any, increase noted at 0.1 nM insulin, relative to untreated cells (no insulin). No statistically significant or concentration-dependent effect of insulin on miR let-7a expression relative to untreated cells was observed, although a slight (∼10%) increase was noted for 1 and 10 nM insulin. ¥Statistical significance was determined using a two-tailed Student’s t test. Statistically significant relative to untreated cells: *P < 0.05; **P < 0.01; ***P < 0.001. Statistically significant relative to 0.1 nM insulin treated cells: #P < 0.1. INS, insulin; UT, untreated.
miR-122 is highly expressed in hepatocytes, constituting up to 70% of the level of all miRs present in the hepatocyte (Law and Wong, 2011). miR-122 has been implicated in a variety of liver-specific cellular processes, including lipid metabolism, and is considered one of the most vital miRNAs for normal hepatic function, with aberrant expression observed in a variety of altered liver-specific pathologic conditions, including hepatocellular carcinoma (Gramantieri et al., 2007). Mice with streptozotocin-induced diabetes were shown to express lower levels of miR-122 (Fernandez-Valverde et al., 2011). Insulin treatment of hepatocytes increased miR-122 expression, with statistically significant elevations of ∼1.5-fold monitored at 1 and 10 nM concentrations relative to untreated controls or hepatocytes treated with 0.1 nM insulin (Fig. 2C).
miR-181a has been identified as being elevated in blood from patients with Type 1 diabetes, as regulating starvation and rapamycin-induced autophagy and has been implicated as playing a role in cellular differentiation and effecting abnormal cellular proliferation and cancer pathogenesis (Ji et al., 2009; Tekirdag et al., 2013). The ability of insulin to regulate miR-181a levels was also examined. A significant, albeit lesser, response was observed in response to insulin, with insulin elevating miR-181a ∼1.4-fold at 1 and 10 nM insulin, respectively, relative to untreated cells or cells treated with 0.1 nM insulin (Fig. 2D).
Let-7a was one of the first experimentally discovered miRNAs and was first isolated and identified as an element of developmental regulation in Caenorhabditis elegans (Guay et al., 2011). It has since been implicated in a variety of cellular processes, including regulation of cell proliferation, cancer, and angiogenesis (Ji and Wang, 2009). However, CYP2E1 mRNA is not a target of miR let-7a. Hence, the ability of insulin to alter the expression of miRNA let-7a in hepatocytes was examined as a positive control. Insulin treatment of cells failed to alter significantly miRNA let-7a expression over the concentrations examined (Fig. 2E).
Mechanistic Studies Involving Insulin Signaling through PI3-K.
The signaling pathways involved in insulin's regulation of the miRs-132/-212, -122, -181a, and let-7a were also examined through mechanistic experiments, using various inhibitors of the kinase members of the insulin signaling pathway. The rationale behind these experiments resides in the PI3-K, Akt, mTOR signaling pathway and downstream kinases, which have been implicated as playing a role in the storage and regulation of miRNA expression. The initial kinase of interest in the insulin signaling pathway is PI3-K.
Insulin-mediated elevation of miR-132 and -212 through the PI3-K signaling was examined. Inhibition of PI3-K with LY294002 revealed that insulin’s effects on both miR-132 and miR-212 were mediated through PI3-K. LY294002 treatment significantly abrogated the insulin-mediated elevation of miR-132, -212, 122 and 181a with miR-132, 212, 122 and -181a suppressed to levels below, or equal to, respectively, the levels present in untreated controls (Fig. 3, A–D). The effect of LY294002 in decreasing the miR-132 levels is clearly more pronounced compared with miR-181a (Fig. 3A and D). At 1.0 nM insulin, LY294002 significantly inhibited the insulin-mediated increase in expression of miRNA-132 by ∼70% relative to the respective insulin-mediated increase, with suppression of miR-132 by inhibition of PI3-K equal to or below that of untreated controls (Fig. 3A).

The role of PI3-K in the insulin-mediated elevation of miR expression in primary cultured rat hepatocytes was examined using the PI3-K inhibitor LY294002 at the concentration of 1 µM, in the absence and presence of 0.1, 1.0, and 10 nM insulin. miR expression was monitored as described in Materials and Methods. (A) The effects of LY294002 on the insulin-mediated increase in miR-132 expression. (B) The effects of LY294002 on the insulin-mediated increase in miR-212 expression. (C) The effects of LY294002 on the insulin-mediated increase in miR-122 expression. (D) The effects of LY294002 inhibition of PI3-K on the insulin-mediated increase in miR-181a expression. (E) The effects of inhibition of PI3-K with LY294002 on miR let-7a expression. Inhibition of PI3K significantly decreased the insulin-mediated increase in expression to levels below those monitored in untreated cells for miR-132 at all insulin concentrations, for miR- 212 at 1 and 10 nM insulin, and for miR-122 and -181a at all insulin concentrations, demonstrating a critical regulatory role for PI3-K in the expression of these miRs. Statistically significant at *P < 0.05; **P < 0.01; ***P < 0.001. Statistically significant relative to 0.1 nM insulin-treated cells: #P < 0.1; ##P < 0.01; ###P < 0.001. INS, insulin; UT, untreated.
The miR-212 levels were less affected by inhibition of PI3-K, although miR-212 levels were nonetheless significantly decreased to levels present in untreated controls at 1 and 10 nM insulin (Fig. 3B). In the presence of 10 nM insulin, LY294002, produced an ∼60% decrease in miR-132 levels, relative to the respective insulin-treated cells, compared with an ∼25% decrease in miRNA-212 at 1 nM insulin relative to insulin-treated cells (Fig. 3B). These data support the analysis that insulin-mediated upregulation of miR-132 and -212 is PI3-K–dependent.
Experiments using the PI3-K inhibitor LY294002 revealed that the insulin-mediated increase in miR-122 appears to be associated with the insulin signaling PI3-K pathway (Fig. 3C). Examination of miR-122 levels from cells treated with insulin alone and cells treated with insulin in combination with the PI3-K inhibitor LY294002 treatment revealed a significant suppression of miR-122 expression. Inhibition of PI3-K with LY294002 produced a significant decline of ∼20–50% in miR-122 relative to the levels detected in cells treated with the respective insulin concentrations, even at the lowest concentration of 0.1 nM insulin (Fig. 3C). LY294002 suppression of the insulin-mediated increase in miR-122 expression was maximal at 1 and 10 nM insulin, where a decline of ∼50 and ∼44% at 1 and 10 nM, respectively, was monitored relative to cells treated with insulin alone. These data reveal a pronounced effect of PI3-K inhibition on the suppression of miR-122, thereby showing the critical regulatory role of PI3K in the insulin-mediated increase in mIR-122 levels.
Inhibition of PI3-K also plays a critical role in effecting miR-181a expression (Fig. 3D). Inhibition of PI3-K with LY294002 produced decreases of ∼30 and ∼50% in miR-181 levels at 1 and 10 nM insulin, respectively, relative to the respective insulin-treated cells. Inhibition of PI3-K abrogated the insulin-mediated increase in miR-181a levels at all concentrations of insulin and decreased miR-181a to levels below those detected in untreated cells.
It was previously shown that insulin did not appear to cause any significant change in miR let-7a expression. Nonetheless, to assess the possibility of PI3-K playing a role in the regulation of basal miR let-7a expression, as well as serving as a positive control, the effects of the PI3-K inhibitor LY294002 treatment on miR let-7a expression in the absence and presence of insulin were examined. No significant change in miR let-7a expression was observed in cells treated with increasing concentrations of insulin in the presence LY294002 relative to insulin alone (Fig. 3E).
Mechanistic Studies Involving Akt.
There are three members of the Akt family; this serine threonine kinase is downstream of PI3-K. Akt regulates a variety of critical cellular processes, including mRNA storage, translation, gene transcription, cell proliferation, and apoptosis and, hence, plays a critical role in metabolic disease and tumorigenesis. Therefore, the role of Akt in regulating miR expression in primary cultured hepatocytes was also examined with the view that insulin-mediated upregulation of the identified miRs is also mediated through Akt. Akt inhibition was achieved using a highly specific and efficacious pan inhibitor of Akt A-443654 (Han et al., 2007). Cells were treated with insulin alone and insulin in combination with A-443654, and miR expression was then analyzed.
The Akt inhibitor A-443654 was used to examine the effects of Akt on the insulin-mediated increase in miR-132 and -212 (Fig. 4, A and B). Akt inhibition by A-443654 ameliorated the insulin-mediated increase in miR-132 and -212 by ∼60 and 75%, at 0.1 and 1.0 nM, respectively, relative to the respective insulin-treated cells (Fig. 4, A and B). Inhibition of Akt significantly decreased the levels of miR-132 and -212 in insulin-treated cells to well below levels present in untreated controls (Fig. 4, A and B). These data clearly establish a role for Akt in regulating miR-132 and -212 expression.

The role of Akt in the insulin-mediated elevation of miRs in primary cultured rat hepatocytes was examined using the Akt inhibitor A-443654 at the concentration of 10 µM in the absence or presence of 0.1, 1.0, and 10 nM insulin. miR expression was monitored as described in Materials and Methods. (A) The effects of A-443654 on the insulin-mediated increase in miR-132 expression. (B) The effects of A-443654 inhibition of Akt on the insulin-mediated increase in miRNA-212 expression. (C) The effects of A-443654 on the insulin-mediated increase in miR-122 expression. (D) The effects of A-443654 on the insulin-mediated increase in miR-181a expression. (E) The effects of A-443654 on miR let-7a expression. Inhibition of Akt produced a significant and dramatic suppression of miR-132, -212, and -122 expression to levels below that present in controls at 0.1, 1.0, and 10 nM insulin, whereas inhibition of Akt resulted in a less pronounced decrease in miR-181a. An inhibitory effect was observed with miR let-7a at 1.0 and 10 nM insulin, although there was no consistent pattern of miR let7a suppression. Statistically significant at *P < 0.05; **P < 0.01; ***P < 0.001. Statistically significant relative to 0.1 nM insulin-treated cells: #P < 0.1; ##P < 0.01; ###P < 0.001. INS, insulin; UT, untreated.
The role of Akt in regulating miR-122 expression was also examined with a view that insulin-mediated upregulation of miR-122 is also mediated through Akt (Fig. 4C). Cells were treated with insulin alone and insulin in combination with A-443654. A significant difference in miR-122 expression was between cells treated with insulin and insulin in combination with the Akt inhibitor A-443654. Inhibition of Akt with A-443654 decreased the 1 and 10 nM insulin-mediated increase in miR-122 expression by 40 and 50%, respectively. Thus, Akt inhibition significantly prevented the insulin-mediated increase in miR-122 expression, although the effect was not as pronounced as that for miR-132 or -212.
The effect of Akt inhibition on miR-181a expression is provided in Fig. 4D. Although the increase in miR-181a levels associated with insulin treatment is relatively small, there was nonetheless a significant difference between cells treated with insulin alone and those with insulin and A-443654 in combination at 1 nM and 10 nM insulin (P < 0.01) (Fig. 4D). An ∼30% decrease miR-181a levels was monitored for at 1 and 10 nM insulin in the presence of A-443654 compared with the respective 1 and 10 nM insulin-treated cells. Inhibition of Akt diminished the insulin-mediated increase in miR-181a to levels present in controls.
Examination of the effects of Akt inhibition on miR let-7a revealed an inconsistent effect at 0.1, 1, and 10 nM insulin, which was statistically insignificant relative to the respective insulin-treated cells (Fig. 4E).
Mechanistic Studies on mTOR (TORC1).
The serine threonine kinase downstream from Akt is mTOR, and inhibition of mTOR (TORC1) was accomplished with rapamycin to examine the role of this kinase in regulating the expression of the target miRNAs.
The role of mTOR (TORC1) in the insulin-mediated increase of miRNA-132 and -212 levels was examined using rapamycin. Inhibition of mTOR (TORC1) with rapamycin significantly abrogated the insulin-mediated increase in either miR-132 or -212 expression by ∼50% at 1 and 10 nM insulin relative to the respective insulin-treated cells and decreased the levels to those present in untreated cells.(Fig. 5, A and B). Thus, inhibition of mTOR (TORC1) completely abrogated the insulin-mediated increase in miR-132 and -212 levels, decreasing the insulin-mediated increase in miR-132 and -212 to the level present in controls, demonstrating that insulin signaling through the PI3-K, Akt, and mTOR pathway regulates expression of the miRNA-132/-212 cluster.

The role of mTOR (TORC1) in the insulin-mediated elevation of miRs in primary cultured rat hepatocytes was examined using the TORC1 inhibitor rapamycin at the concentration of 500 nM in the absence and presence of 0.1, 1.0, and 10 nM insulin. miR expression was monitored as described in Materials and Methods. (A) Rapamycin effects on the insulin-mediated elevation in miR-132 expression. (B) Rapamycin effects on the insulin-mediated elevation in miR-212 expression. (C) Rapamycin effects on the insulin-mediated elevation of miR-122 expression. (D) Rapamycin effects on the insulin-mediated elevation of miR-181a expression. (E) Rapamycin effects on miR let-7a. Inhibition of mTOR (TORC1) produced a significant decrease in miR-132, - 212, and -122 and a marginal decrease in miR-181a, which was not statistically significant. Statistically significant at *P < 0.05; **P < 0.01; ***P < 0.001. Statistically significant relative to 0.1 nM insulin-treated cells: #P < 0.1; ##P < 0.01; ###P < 0.001. INS, insulin; UT, untreated.
The role of mTOR (TORC1) in the insulin-mediated elevation of miRNA-122 expression was examined using rapamycin. Treatment of cells with rapamycin resulted in suppression of the insulin-mediated increase in miR-122 expression. Comparison of miR-122 expression in cells containing insulin, and insulin plus rapamycin, revealed a significant 33 and 50% inhibition of miR-122 expression at 1 and 10 nM insulin, respectively, relative to the respective insulin-treated cells (Fig. 5C). In summary, inhibition of mTOR appeared to decrease the insulin-mediated increase in miR-122 levels to those present in controls (untreated cells), suggesting that insulin signaling through PI3-K, Akt, and mTOR regulates miR-122 expression.
Inhibition of mTOR (TORC1) with rapamycin, however, failed to have a significant effect on miR-181a expression (Fig. 5D), suggesting that mTOR may not play a major role in modulating the effect of insulin on miR-181a expression. Although rapamycin treatment appeared to decrease miR-181a levels slightly, this decrease was not statistically significant for any of the concentrations of insulin examined. Thus, PI3-K and Akt, but not mTOR, appear to play a role in the insulin-mediated increase in miR-181a levels.
Inhibition of mTOR on miR let-7a expression, however, revealed no inhibitory effect (Fig. 5E). These results show that miR let-7a expression is unaffected by mTOR (TORC1).
Discussion
The miRNAs have emerged as a new class of regulatory RNAs that appear to be ubiquitously distributed and involved in a variety of cellular processes (Murakami et al., 2006). Insulin is a major hormone involved in a multitude of biologic responses, including gluconeogenesis, cell proliferation, differentiation, and metabolism. Although miRNAs have been implicated in many liver-specific activities, including glucose regulation and cell-cycle control, insulin’s potential to regulate these miRNAs has never been examined in primary hepatocytes. In human skeletal muscle cells, insulin treatment has been shown to influence the expression of multiple miRNAs, as determined from miRNA profiling, many of which contained putative target genes known to be relevant to insulin signaling. The present study used the sensitive and specific qRT-PCR assay to examine the expression of four microRNAs that were selected based on their role in regulating hepatic metabolism and disease and because of predicted targeting of CYP2E1 mRNA. Selective inhibition of the insulin signaling components PI3-K, Akt, and mTOR was accomplished to examine the role of the individual kinases in regulating the expression of the individual miRs. We used a luciferase reporter assay to establish the repression of rat CYP2E1 by two of the microRNAs that were induced by insulin.
The regulation of CYP2E1expression is perhaps the most complex of the cytochromes P450, encompassing gene transcription, mRNA translation (Kim and Novak, 1990; Woodcroft et al., 2002), and post-translational events. CYP2E1 is upregulated in diabetes, starvation, and through chemical inducers, including alcohols (Woodcroft et al., 2002; Yokoi and Nakajima, 2011) and nitrogen heterocycles, such as pyridine (Kim and Novak, 1990). Induction appears to occur through translational control based on polysomal distribution and half-life studies of CYP2E1 mRNA (Kim and Novak, 1990; Abdelmegeed et al., 2005). Additional studies have established a role for insulin regulation of CYP2E1 expression through both transcriptional and translational mechanisms and that proceed through PI3-K and mTOR signaling, with no or low insulin elevating CYP2E1 mRNA in primary cultured hepatocytes, whereas normal or supraphysiologic levels of insulin markedly decrease CYP2E1 mRNA levels in primary cultured hepatocytes. Additional studies examining the various arms of the insulin signaling pathway revealed that the Ras-Raf, Erk-Mek, MAP (Mitogen-activated protein kinase) kinase pathway had no role in the insulin-mediated effects on CYP2E1 expression. In view of the regulatory effects of insulin and insulin signaling through PI3-K, Akt, and mTOR and the potential for miRs that target CYP2E1 to play an important regulatory role, we hypothesized that insulin indeed might also regulate the expression of these miRs.
The possibility that microRNAs may be involved in the post-transcriptional regulation of human CYP2E1 has been established. Human CYP2E1 expression is regulated by miR-378, mainly via translational repression (Mohri et al., 2010). The current studies focused on examination of miRs, which have been implicated in the regulation of hepatic metabolism and disease and in the regulation of CYP2E1, which has been shown to be downregulated by insulin through the PI3-K, Akt, mTOR arm of the insulin signaling pathway. Several of these miRs have been identified as biomarkers of disease and can be detected in the blood.
miR-122 is the most highly expressed miRNA in the liver. It has been shown to be involved in diverse liver-specific processes, including lipid metabolism and hepatocyte proliferation, as well as hepatocellular carcinoma and chronic hepatitis (Ji and Wang, 2009). Additionally, miR-122 expression is significantly altered in models of diabetes (Han et al., 2007; Xu et al., 2011). The miRNA-132/-212 cluster is a family of miRNAs containing both miRNA-132 and miR-212. These miRNAs are located at the same genetic locus, and their transcriptional control appears to be concerted. Since they have identical seed regions, it is believed that these two microRNAs regulate a largely overlapping set of transcripts (Wanet et al., 2012). In addition, miR-132 and -212 have been shown to be upregulated in isolated pancreatic islets in the obese phenotypes of both the diabetes-resistant and diabetes-susceptible mouse models (Zhao et al., 2009). Both miRNAs have been shown to play an important role in neuronal processes and angiogenesis, among other biologic activities.
Elevation of the miR-132/-212 cluster and miR-122 by insulin was shown to be dependent on PI3-K and Akt/mTOR signaling, and its expression patterns in response to insulin treatment (dose-dependent) may contribute, in part, to the mechanism by which insulin regulates CYP2E1 expression in an inverse dose-relationship manner. Using an in vitro luciferase reporter assay, we demonstrated that rat CYP2E1 expression is regulated by rno-miR-132 and -212. Thus, we conclude that of the miRs examined, expressions of the miR-132/-212 cluster and miR-122 were the most responsive, whereas miR-181a was less responsive, to insulin and to inhibitors of the PI3-K, Akt, and mTOR kinases. We also conclude that rat CYP2E1 is one of the direct targets of the miR-132/-212 cluster.
miR let-7a was the first discovered miR and is reported to play a role in cellular differentiation and proliferation (Boyerinas et al., 2010). However, miR let-7a has not been not identified as an miR that targets CYP2E1. Let-7a expression was not elevated in response to insulin, nor was miR let-7a expression decreased by inhibition of PI3-K, Akt, or mTOR.
Whether insulin alters the levels or activities of the various proteins involved in miR production (e.g., dicer) or the cellular localization and storage of miRs remains to be established.
In summary, we provide seminal evidence for selective insulin regulation of miR expression in primary cultured hepatocytes through PI3-K, Akt, and mTOR (TORC1). We anticipate that subsequent in vivo studies will characterize more fully the role of this pathway in hepatic microRNA regulation and metabolic diseases. We hypothesize that PI3-K, Akt, and mTOR are involved in regulating the expression of insulin-responsive miRs because of the regulatory role that this pathway plays in the storage and translation of mRNAs.
Acknowledgments
The authors thank Deepa Kanakapalli for assistance and Jennifer Ortwine for assistance in the preparation of figures.
Authorship Contributions
Participated in research design: Shukla, Tumma, Gratsch, Novak.
Conducted experiments: Shukla, Tumma, Gratsch.
Performed data analysis: Shukla, Tumma, Dombkowski.
Wrote or contributed to the writing of the manuscript: Shukla,Tumma, Dombkowski, Novak.
Footnotes
- Received May 15, 2013.
- Accepted August 2, 2013.
This work was supported by the National Institutes of Health National Institute of Environmental Health Sciences [Grant ES 03656].
Abbreviations
- A-443654
- (2s)-1-(1h-Indol-3-Yl)-3-{[5-(3-Methyl-1h-Indazol-5-Yl)pyridin-3-Yl]oxy}propan-2-Amine
- Akt
- protein kinase B
- CT
- cycle threshold
- LY294002
- 2-morpholin-4-yl-8-phenylchromen-4-one
- MAP
- mitogen-activated protein kinase
- miRNA
- microRNA
- mTOR
- mammalian target of rapamycin
- P13-K
- phosphatidylinositol 3-kinase
- pre-miRNA/pre-miR
- precursor microRNA
- PITA
- probability of interaction by target accessibility
- qRT-PCR
- quantitative real-time polymerase chain reaction
- TORC1
- target of rapamycin complex 1
- UTR
- untranslated region
- Copyright © 2013 by The American Society for Pharmacology and Experimental Therapeutics


