


Abstract
1-Aminobenzotriazole (ABT) is regularly used in vivo as a nonspecific and irreversible cytochrome P450 inhibitor to elucidate the role of metabolism on the pharmacokinetic profile of xenobiotics. However, few reports have considered the recent findings that ABT can alter drug absorption or have investigated the possible differential inhibition of ABT on intestinal and hepatic metabolism. To address these uncertainties, pharmacokinetic studies under well controlled and defined ABT pretreatment conditions (50 mg/kg, 1 hour ABT i.v. and 16 hours ABT p.o.) were conducted prior to the oral administration of metoprolol, a permeable P450 probe that undergoes extensive intestinal and hepatic metabolism. The pharmacokinetic profile of metoprolol was affected differently by the two ABT pretreatments. An increase in area under the curve of 16-fold with ABT p.o. and 6.5-fold with ABT i.v. was observed compared with control. Based on in vitro studies, this difference could not be attributed to a differential inhibition of intestinal and hepatic metabolism. In the ABT i.v. pretreatment group, the increase in area under the curve was also associated with a prolonged time at maximal concentration (24-fold versus control), suggesting a delay in absorption. This was further confirmed by the administration of a charcoal meal, which resulted in a 7-fold increase in stomach weights in the 1-hour ABT pretreated groups compared with the untreated or 16-hour ABT pretreated rats. Based on these results, we recommend pretreating rats with ABT p.o. 16 hours before the administration of a test compound to preserve the inhibitory effect on intestinal and hepatic metabolism and avoid the confounding effect on drug absorption.
Introduction
1-Aminobenzotriazole (ABT) is an irreversible and nonspecific inhibitor of the major cytochrome P450 enzymes responsible for the metabolism of many xenobiotics (Balani et al., 2002). Upon oxidation, ABT forms a reactive benzyne intermediate that inactivates cytochrome P450 (P450) by alkylation of the protesthetic heme (Mico et al., 1988). Since ABT is highly soluble, has a good in vivo bioavailability, low clearance (Town et al., 1993), and good safety profile at doses of up to 100 mg/kg in rats (Meschter et al., 1994), it is used to understand the role of metabolism on the pharmacokinetics (PK) of drugs in preclinical species. For example, it has been reported that ABT can be used to discriminate between poor absorption and extensive CYP-mediated metabolism for poorly bioavailable compounds (Caldwell et al., 2005). It can also be valuable in distinguishing between the toxicity mediated by the parent drug and its metabolites (Subramanian et al., 2014). There is even some evidence that the route of administration of ABT could provide insights on the contribution of hepatic versus intestinal metabolism to the first-pass effect. This assumption is predicated on the fact that the bioavailability of midazolam was not affected by treatment with ABT i.v., whereas there was a significant increase when ABT was given orally. Since midazolam is known to be highly metabolized in the gut, the authors concluded that ABT i.v. did not inhibit gut enzymes in comparison with ABT p.o. (Strelevitz et al., 2006).
Although there are numerous studies demonstrating the ability of ABT to block metabolism in vivo, there is a lack of consistent methodologies in these studies (Table 1) and therefore it is difficult to extrapolate conclusions from one study to another. In addition, most studies report changes in the pharmacokinetic profiles of the probe substrates but few have examined the corresponding changes in the pharmacokinetic profiles of the circulating metabolites. This may lead to misinterpretation of the impact of ABT on in vivo metabolism in light of the recent report that ABT may also affect intestinal transit time (Stringer et al., 2014). Finally, none of these studies have undertaken a systematic approach to measure the impact of ABT pretreatment on the role of gut and liver metabolism.
Dosing regimen of ABT across different studies
The aim of the present study is to define the best pretreatment conditions for the use of ABT in rats to avoid any disturbance in the gastrointestinal tract while maintaining its P450 inactivation. Metoprolol was selected as the P450 probe for these studies. Metoprolol is completely absorbed but exhibits very poor bioavailability (bioavailability of 4%) due to high first-pass metabolism (Borg et al., 1975b) in the intestine and liver (Yoon et al., 2011). The metabolic pathways of metoprolol are represented in Fig. 1. Pharmacokinetic studies with metoprolol were conducted in rats treated with ABT under well controlled and defined dosing conditions (50 mg/kg, 1-hour ABT i.v. pretreatment and 16-hour p.o. pretreatment). To obtain the complete absorption and metabolic profile of metoprolol, the plasma levels of three major circulating metabolites of metoprolol [α-hydroxy-metoprolol (OHM), O-desmethyl-metoprolol (ODM), and metoprolol acid (MA) (Borg et al., 1975a)] were also measured. In addition, to put into perspective the impact of ABT on metoprolol intestinal and hepatic metabolism, in vitro metabolic studies using intestinal and hepatic microsomes prepared from ABT pretreated rats were conducted. Finally, the impact of ABT on the gastric emptying and intestinal transit time was assessed using the charcoal method. Based on our results, we provide recommendations for the future use of ABT in pharmacokinetics studies.

Metabolic pathway of metoprolol in rats (Borg et al., 1975a; Boralli et al., 2009).
Materials and Methods
Drugs and Chemicals.
Metoprolol tartrate salt, labetalol hydrochloride, activated charcoal, and reduced β-NADPH sodium salt were purchased from Sigma Aldrich (St. Louis, MO). MA, OHM, and ODM were obtained from Toronto Research Chemicals (Toronto, ON, Canada). All other reagents meets or exceeds purity standards set by American Chemical Society (ACS).
Animals.
Male Sprague-Dawley rats weighing 200–250 g were obtained from Charles River (St-Constant, QC, Canada) and were housed in a temperature-controlled room with a 12-hour light/dark cycle. All rats were fasted for 15 to 16 hours prior to the experiments, and water was available ad libitum. Oral administrations were performed by delivering a bolus of the drug in a solution directly into the stomach using a syringe with a flexible gavage needle. All i.v. administrations were made by injecting a bolus of the drug solution via a tail vein. For pharmacokinetic studies, standard rat chow was provided 2 hours postadministration of the drug. All the experiments were approved by an ethical committee and were conducted according to the Canadian Council on Animal Care guidelines for the care and use of laboratory animals.
Pharmacokinetics Studies.
To assess the impact of ABT on the pharmacokinetics of metoprolol, metoprolol was formulated in water and dosed p.o. at 10 mg/kg in control rats and rats pretreated for 1 hour with ABT i.v. (50 mg/kg in saline, 1 ml/kg) or 16 hours with ABT p.o. (50 mg/kg in saline, 5 ml/kg) (n = 5 per group; see Table 2 for specific conditions). Blood was collected from the jugular vein at 0.25, 0.5, 1, 2, 4, 9, 8, and 24 hours postdosing. Samples were immediately transferred into tubes containing EDTA K3, and plasma was obtained following centrifugation at 1620g for 10 minutes at 4°C. The plasma samples were stored at −30°C until analysis.
ABT pretreatment conditions prior to metoprolol dosing
Preparation of Hepatic and Intestinal Microsomes.
To determine the effect of ABT on hepatic and intestinal enzymes, untreated as well as ABT i.v. and p.o. pretreated rats (see Table 2 for details) were anesthetized with isoflurane and sacrificed by cervical dislocation (n = 3 per group). The livers were immediately collected, cut into pieces of 1–5 mm2, and frozen in liquid nitrogen. The small intestine was removed, and the first 2/3, starting from the pyloric valve, was placed in ice-cold phosphate-buffered saline.
Liver tissues were homogenized, and hepatic microsomes were prepared by differential centrifugation using standard methods (Cinti et al., 1972). The preparation of intestinal microsomes was performed using a previously reported protocol (Leblond et al., 2002). Briefly, enterocytes were isolated from the first 2/3 of the small intestine by elution with an EDTA containing solution. Then, the cells were lysed and microsomes were prepared using two differential centrifugations at 12,000g and 100,000g. The pellets containing the microsomes were resuspended in 0.1 M Tris (pH 7.4), 20% glycerol, and 0.15 M NaCl, and the microsomes obtained from each dose group were pooled. A protein concentration of hepatic and intestinal preparations was measured using bicinchoninic acid as previously described (Smith et al., 1985).
Measurement of the Intrinsic Clearance in Intestinal and Hepatic Microsomes.
Metoprolol was incubated at a final concentration of between 0.5 and 200 μM for 30 minutes in 100 mM phosphate buffer (pH 7.4) containing 1.5 mM NADPH using 1 mg/ml of intestinal microsomes or 0.5 mg/ml of hepatic microsomes obtained from controls and ABT i.v. and p.o. pretreated rats. These conditions were optimized to be under linear turnover conditions (results not shown). The reaction was terminated by the addition of acetonitrile containing 0.1 μg/ml of the internal standard labetalol.
Gastric Emptying and Intestinal Transit Time Study.
The charcoal meal technique was used to evaluate the impact of ABT on gastric emptying and the intestinal transit time. The protocol was designed based on published methods (Mittelstadt et al., 2005; Prior et al., 2012). Untreated rats and ABT i.v. and p.o. pretreated rats (see Table 2 for details) were used for this experiment (n = 4 per group). A control group pretreated 1 hour before with ABT p.o. was incorporated in the study to distinguish between the time of administration and the route of administration. A volume of 2 ml of charcoal meal [5% (w/v) of activated charcoal in 2% (w/v) of caboxymethyl cellulose] was administered to the animals, and 30 minutes later, the rats were anesthetized with isoflurane, sacrificed by cervical dislocation, and the stomachs and the small intestines were collected. The full stomach was weighted, and its contents were removed by washing in phosphate-buffered saline and then sponging with gauze. The resulting empty stomachs were then weighted. The full length of the small intestine, from the pyloric valve to the ileocecal junction, and the maximal distance traveled by the charcoal from the pyloric valve to the last visible charcoal were measured.
Sample Preparation and Analytical Methods.
To determine the concentration of metoprolol and its major metabolites in plasma and microsomal incubates, samples were extracted by the addition of six volumes of acetonitrile containing the internal standard labetalol (0.1 μg/ml). The samples were vortexed and centrifuged at 2500g for 11 minutes at 4°C. The resulting supernatants were diluted 1:1 with water and analyzed using liquid chromatography–tamdem mass spectrometry.
Liquid chromatography–tamdem mass spectrometry analysis was performed using a Thermo Fisher Scientific system composed of a TSQ Vantage mass spectrometer coupled with Accela U-HPLC system (Thermo Fisher, Waltham, MA). Chromatographic separation was achieved on an ACE 3 C18-PFP column (50 × 4.6 mm; Advanced Chromatography Technologies Ltd, Aberdeen, UK) using a linear gradient at 0.9 ml/min. Mobile phase A consisted of 0.1% acetic acid in water, and mobile phase B consisted of acetonitrile. A gradient program was initiated starting at 5% B, which was held for 0.3 minutes, and then ramped from 5 to 90% B in 2.2 minutes. After holding at 90% B for an additional 1.2 minutes, the program changed back to 5% B. The column was equilibrated with 5% B for 1.2 minutes before the next injection. The mass spectrometer was operated in the positive mode with electrospray ionization. The following transition, along with their collision energy (CE), were used: 268.2 → 159.2 (CE: 20 V) for metoprolol, 254.1 → 177.1 (CE: 17 V) for ODM, 284.0 → 91.1 (CE: 38 V) for OHM, 268.2 → 145.2 (CE: 21 V) for MA, and 329.1 → 311.2 (CE: 12 V) for labetalol.
Data Analysis.
Pharmacokinetic parameters were determined by the noncompartmental method using Watson (Thermo Scientific, Waltham, MA), a purpose-built laboratory information management system designed to support drug metabolism and pharmacokinetic studies. The area under the plasma concentration time curve (AUC) from time 0 to the last time point with a measurable concentration (AUC0–T) was calculated by the trapezoidal method. The maximal plasma concentration (Cmax), half-life, and time to reach Cmax (Tmax) were obtained from the observed data.
The kinetic constants the concentration at half the maximal activity (Km) and Vmax (the maximal velocity) were determined for each metabolite by fitting the data with the software GraphPad Prism (GraphPad Software, La Jolla, CA) using the nonlinear regression analysis. The intrinsic clearance (CLint) for each metabolite was calculated by dividing the Vmax by the Km.
Gastric emptying was evaluated by the weight of the stomach content, which is equal to the difference between the weight of the full stomach and the weight of the empty stomach. Intestinal transit time was measured by the percentage of the small intestine traveled by the charcoal and was calculated as follows: (distance traveled by the charcoal/small intestine length) × 100.
For a group comparison, the statistical significance of the difference between mean values was calculated using analysis of variance, with the Tukey-Kramer test used for multiple comparisons. Differences with a P value of less than 0.05 were considered to be statistically significant.
Results
Effect of ABT on Metoprolol Oral Pharmacokinetics in Rats.
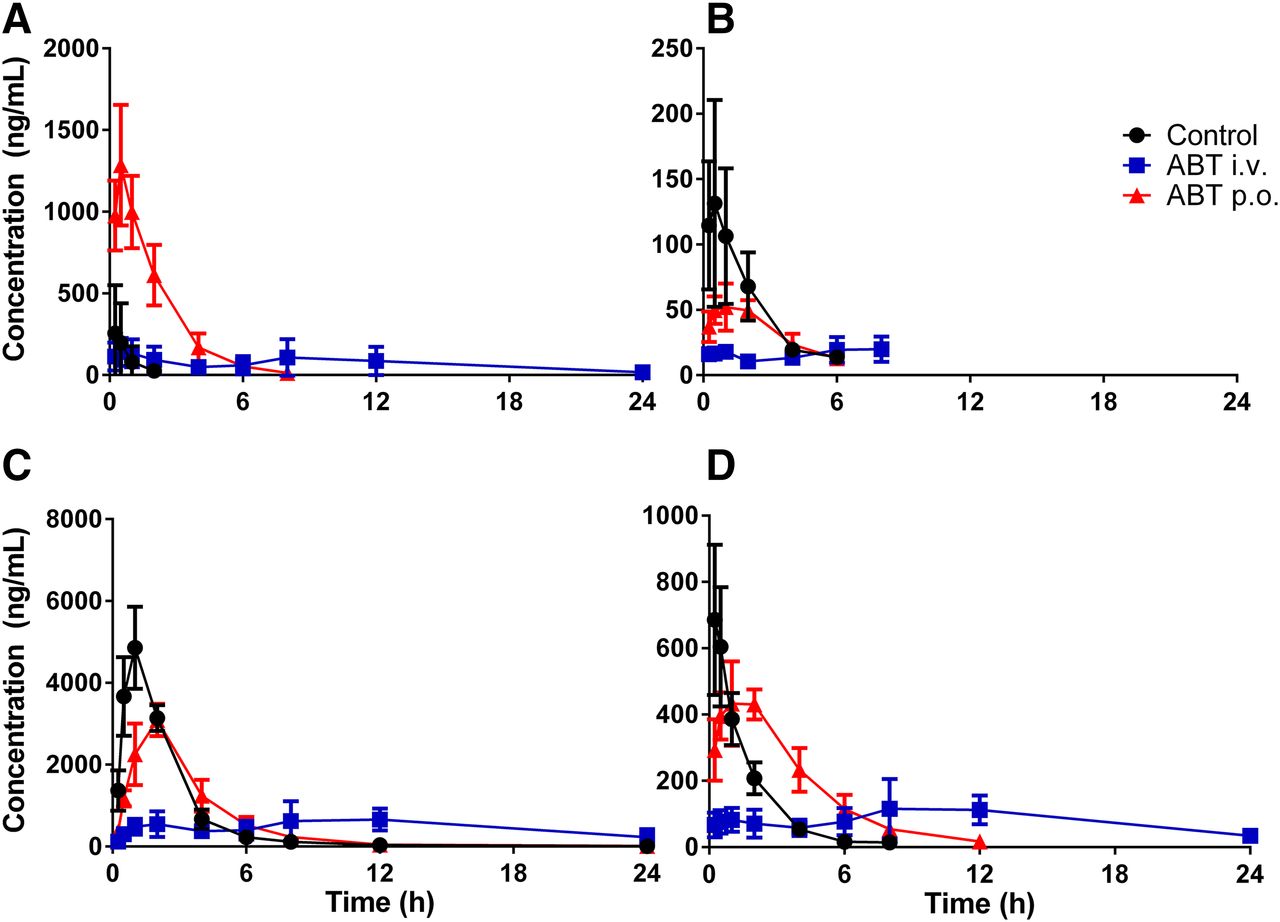
To evaluate the effect of pretreatment of ABT on the oral pharmacokinetics of metoprolol in rats, oral PK studies with metoprolol (10 mg/kg) were performed in control and ABT-treated rats. The PK profiles of metoprolol and its major metabolites are represented in Fig. 2 and the main PK parameters are shown in Table 3. Pretreatment with ABT p.o. significantly affected the PK of metoprolol as it increased the AUC by 16-fold and the Cmax by 5-fold versus the untreated animals. In contrast to these findings, pretreatment with ABT i.v. resulted in a moderate increase in AUC (6.5-fold) and no effect on the Cmax of metoprolol. The inhibition of metoprolol metabolism by ABT is also confirmed by a decrease in the production of metabolites, as measured by the ratio of the total AUC of the metabolites divided by the AUC of the parent, compared with the controls (from 81.2 in the controls to 12.2 for ABT i.v. and 5.0 for ABT p.o.).

Plasmatic concentration of metoprolol (A), O-desmethyl-metoprolol (B), metoprolol acid (C), and α-hydroxy-metoprolol (D), following the administration of 10 mg/kg of metoprolol in untreated rats and in 50 mg/kg ABT i.v. 1-hour or ABT p.o. 16-hour pretreated rats. Data are the mean and standard deviations of five rats.
Effect of ABT on the PK parameters of metoprolol and its metabolites in rats
PK parameter after p.o. administration of 10 mg/kg of metoprolol in control or ABT-treated rats. Data are the mean and standard deviation of five rats.
For the metabolites, both groups pretreated with ABT increased the AUC of OHM and only ABT i.v. decreased the AUC of ODM. However, we found a significant reduction in the Cmax of the three metabolites following ABT pretreatment (i.v. and p.o.) compared with control, in line with a decrease in first-pass metabolism. The decrease in the Cmax is more important in the ABT i.v. group than in the ABT p.o. group for OHM and MA.
Moreover, a significant delay in absorption was observed in the ABT i.v. pretreated group (Tmax of 5.9 hours) when compared with controls or ABT p.o. pretreated rats (0.25 and 0.5 hours, respectively). This also translated to a delayed Tmax (up to 17-fold) of the three metabolites in the ABT i.v. pretreated group.
Effect of ABT on Intestinal and Liver Metabolic Enzymes.
To further put into perspective the PK data and elucidate the impact of pretreatment of ABT i.v. and p.o. on liver and intestinal metabolism, microsomes were prepared from the liver and the intestine of untreated and ABT-treated animals. The metabolic activity was assessed by measuring the CLint of metoprolol in the microsomal preparation with the Km and Vmax method. The results are shown in Fig. 3. In summary, ABT given orally or i.v. significantly inhibits, and to a similar extent, the metabolism in intestinal and hepatic microsomes (5- and 3-fold, respectively). It is also worth mentioning that differences in metabolic pathways were observed in hepatic and intestinal microsomal incubations. Indeed, hepatic microsomes converted metoprolol mostly to MA and OHM, whereas the intestinal microsomes produced mostly ODM.

Intrinsic clearance of metoprolol in hepatic (A) and intestinal (B) microsomes of untreated rats or ABT i.v. 1-hour and ABT p.o. 16-hour pretreated rats.
Effect of ABT on Gastric Emptying and Intestinal Transit Time.
To elucidate the potential effect of ABT i.v. and p.o. on delaying absorption, gastric emptying and intestinal transit time were measured using the charcoal meal method. Four groups were studied: untreated, ABT i.v. 1 hour before charcoal, ABT p.o. 16 hours before charcoal, and ABT p.o. 1 hour before charcoal. The results are shown in Table 4. It is clear that pretreatment of 1 hour with ABT i.v. or p.o. significantly affects gastric emptying in rats, as it increases by 7-fold the weight of the stomach content, whereas pretreatment of 16 hours with ABT p.o. has no effect. Furthermore, no effect of ABT on intestinal transit was observed for all groups.
Effect of ABT on stomach content and intestinal transit in rats dosed with a charcoal meal
The stomach content (g) and the intestinal transit (percentage of the small intestine traveled by the charcoal) were measured 30 minutes after the administration of 2 ml of activated charcoal in control or 50 mg/kg ABT-treated rats. Data are the mean and standard deviation of four rats.
Discussion
The goal of the present study was to characterize the role of ABT in drug-drug interaction studies by looking at its impact on absorption as well as its effect on intestinal and hepatic metabolism. This was achieved by conducting pharmacokinetics studies with metoprolol under two well defined ABT pretreatments. The three main metabolites of metoprolol were also monitored to corroborate the data obtained with the parent drug.
The oral pretreatment with ABT (16 hours predosing) resulted in a large increase in the AUC and Cmax of metoprolol, whereas ABT i.v. (1 hour predosing) caused an increase in the AUC, with no impact on Cmax (Table 3). In addition, the Cmax of the metabolites decreased compared with control. These results suggest that the inhibition of first-pass metabolism is important under both ABT pretreatment conditions (i.v. and p.o.), with a stronger effect observed in the oral pretreatment group. These data could suggest that additional inhibition of intestinal enzymes is occurring when ABT is given orally, as proposed by Strelevitz et al. (2006). However, careful examination of the results may not support this hypothesis. Indeed, the decrease in the Cmax of the metabolites is more important in the ABT i.v. group, even though the AUC of metoprolol increased less in this group compared with the oral ABT group. Moreover, in the ABT i.v. group, the Tmax of metoprolol and its three metabolites are considerably delayed compared with the control or ABT p.o. pretreated group, suggesting a delayed absorption. Since the absorption is only delayed in the ABT i.v. group, it is difficult then to conclude that the differences observed in the i.v. and p.o. groups is due exclusively to metabolism.
To clarify whether ABT i.v. inhibits intestinal metabolism, intestinal and hepatic microsomes were prepared from control and ABT-pretreated rats. The CLint of metoprolol measured in these microsomes is decreased similarly in the two pretreatment groups (5- and 3-fold in intestinal and hepatic microsomes, respectively) (Fig. 3). These results clearly indicate that ABT cannot be used to discriminate between intestinal and liver first-pass metabolism. In fact, based on the in vitro studies, both treatments inhibited the intestine more than the liver. In addition, it is not unusual to observe such an effect when a drug is dosed i.v. since the intestine is highly perfused (Dimich et al., 1991; Nakase et al., 2001)
Some differences were observed between the in vitro metabolism of metoprolol in rat intestinal and hepatic microsomes. Intestinal microsomes metabolize metoprolol almost exclusively in ODM, whereas hepatic microsomes preferentially produced MA, followed by OHM and ODM. This difference can be explained by the specificity of cytochrome P450 isoforms as drug-drug interaction studies with ketoconazole, cimetidine, and quinidine performed in rats demonstrated that OHM and MA are produced by CYP2D and ODM is produced by CYP3A (Boralli et al., 2009). As the rat intestine contains higher quantities of CYP3A versus CYP2D (Mitschke et al., 2008), this difference in expression levels will likely favor the formation of ODM in intestinal microsomes. This may explain the importance of the ODM and MA pathway in untreated rats as the intestine possibly produces a high amount of ODM that is later converted in MA by the liver. This can also explain the significant increase in the AUC of OHM following ABT p.o. pretreatment compared with control (Table 3). The intestine probably contributes less to the metabolism of metoprolol in ABT p.o. pretreated rats since it is more inhibited than the liver (Fig. 3) and can only metabolize the drug during the first pass and not the elimination process. However, as the impact of ABT on the elimination of the metabolites themselves is unknown, a precise interpretation of these results remains unclear.
Since the inhibition of the intestine and the liver metabolism is similar in vitro for the ABT p.o. and i.v. groups, we speculated that the delayed absorption observed in the ABT i.v. pretreated group may, in part, explain the difference in the PK of metoprolol between the ABT p.o. and i.v. groups. To better understand the impact of ABT on absorption, we evaluated gastric emptying and intestinal transit time with the charcoal meal technique (Table 4). A 1-hour pretreatment with ABT (i.v. or p.o.) significantly inhibited gastric emptying in rats. This effect is only temporary since no effect is in the 16-hour pretreatment with ABT. In addition, it is worth noting that the charcoal meal technique can quickly and clearly distinguish between an effect on gastric emptying or intestinal transit. Indeed, in the experiment with ABT, no effect on intestinal transit was observed.
These results are consistent with the study of Stringer et al. (2014), who demonstrates with a fluorescent marker that ABT inhibits the gastric emptying when dosed p.o. or intraperitoneally 2 hours before the test meal. They observed no significant difference when ABT was dosed 15 hours before the test meal in fasted male Wistar rats. Therefore, we can conclude that ABT affects gastric emptying when dosed 1 to 2 hours before the experiment, regardless of the route of administration, and that this effect fades in time, with no significant effect after 15 to 16 hours.
The change in the absorption is of high importance considering that if the drug is liberated slowly from the stomach, the absorption will be delayed, the Cmax will be lowered, and the Tmax will be delayed. Since less drug enters the circulation, the first-pass extraction may also be increased. This is exactly what we observed in the present study: less metoprolol reaches the systemic circulation in the early time points in the i.v. ABT group, likely due to the altered gastric emptying (Fig. 2). This gives the false impression that the intestinal first-pass metabolism is selectively inhibited in the ABT p.o. group. However, this is not the case, as demonstrated by the in vitro studies where both p.o. and i.v. pretreatments gave a similar reduced intestinal metabolic activity when compared with controls (Fig. 3). Moreover, fewer metabolites also enter in the ABT i.v. group compared with the ABT p.o. group during the early time points, which supports the conclusion that the absorption is altered (Fig. 2). Thus, it is not possible to make conclusions about metabolism when using ABT if the rate of absorption is affected.
In conclusion, this study demonstrates that ABT cannot be used to distinguish between intestinal and hepatic first-pass metabolism. Also, we have clearly shown that ABT can affect gastric emptying when rats are dosed 1 to 2 hours prior to a pharmacokinetic study. For future studies, we recommend ABT to be dosed 15 to 16 hours before the experiment (50 mg/kg p.o.). These conditions are sufficient for the inhibition of intestinal and hepatic metabolic enzymes and do not affect the absorption phase. Therefore, ABT can still be a useful tool to determine if the cause of low oral bioavailability is due to phase I first-pass metabolism or poor absorption if it is correctly used.
Acknowledgments
The authors thank the in vivo team from Vertex Pharmaceuticals for their participation in the experiments.
Authorship Contributions
Participated in research design: Boily, Chauret, Pichette, Laterreur, Leblond, Lévesque, Ste-Marie.
Conducted experiments: Boily, Boudreau, Duquet.
Performed data analysis: Boily.
Wrote or contributed to the writing of the manuscript: Boily, Chauret, Pichette, Laterreur.
Footnotes
- Received July 16, 2015.
- Accepted October 2, 2015.
This work was supported by the Canadian Institute of Health Research (CIHR) and the Hôpital Maisonneuve-Rosemont Foundation through the event La Nephrologie et son Impact.
Abbreviations
- ABT
- 1-aminobenzotriazole
- AUC
- area under the curve
- Cmax
- maximal concentration
- CE
- collision energy
- CLint
- intrinsic clearance
- Km
- concentration at half the maximal velocity
- MA
- metoprolol acid
- ODM
- O-desmethyl-metoprolol
- OHM
- α-hydroxy-metoprolol
- P450
- cytochrome P450
- PK
- pharmacokinetics
- Tmax
- time at maximal concentration
- Copyright © 2015 by The American Society for Pharmacology and Experimental Therapeutics


