


Abstract
Correction for the nonspecific binding (NSB) of drugs to liver microsomes is essential for the accurate measurement of the kinetic parameters Km and Ki, and hence in vitro–in vivo extrapolation to predict hepatic clearance and drug–drug interaction potential. Although a number of computational approaches for the estimation of drug microsomal NSB have been published, they generally rely on compound lipophilicity and charge state at the expense of other physicochemical and chemical properties. In this work, we report the development of a fragment-based hologram quantitative structure activity relationship (HQSAR) approach for the prediction of NSB using a database of 132 compounds. The model has excellent predictivity, with a noncross-validated r2 of 0.966 and cross-validated r2 of 0.680, with a predictive r2 of 0.748 for an external test set comprising 34 drugs. The HQSAR method reliably predicted the fraction unbound in incubations of 95% of the training and test set drugs, excluding compounds with a steroid or morphinan 4,5-epoxide nucleus. Using the same data set of compounds, performance of the HQSAR method was superior to a model based on logP/D as the sole descriptor (predictive r2 for the test set compounds, 0.534). Thus, the HQSAR method provides an alternative approach to laboratory-based procedures for the prediction of the NSB of drugs to liver microsomes, irrespective of the drug charge state (acid, base, or neutral).
Introduction
Human liver microsomes (HLM) are used widely as the enzyme source for the reaction phenotyping and kinetic characterization of drug metabolism and inhibitory drug–drug interaction potential of both established therapeutic agents and new chemical entities (Houston, 1994; Miners et al., 1994, 2010; Obach, 1999; Rostami-Hodjegan and Tucker, 2007). However, it is well established that numerous drugs and other xenobiotics may partition into the microsomal membrane during incubations with HLM and rat liver microsomes (RLM) (Herbette et al., 1983; Nussio et al., 2007; McLure et al., 2011; Nagar and Korzekwa, 2012). Nonspecific binding (NSB) to the microsomal membrane generally occurs to the greatest extent with lipophilic organic bases, with lesser binding of neutral and acidic compounds (Austin et al., 2002; Sykes et al., 2006; McLure et al., 2011).
As a result of NSB to HLM, and indeed other enzyme sources used for in vitro drug metabolism studies, the free concentration of the compound present in incubations is lower than the added concentration. Failure to account for NSB results in overestimation of key kinetic parameters (viz. Km, S50, and Ki) and hence underprediction of in vitro intrinsic clearance and drug–drug interaction potential (Obach, 1999; McLure et al., 2000; Margolis and Obach, 2003; Grime and Riley, 2006; Miners et al., 2006, 2010). NSB, measured as the fraction unbound in the incubation medium (fumic), is determined experimentally by a range of techniques, including equilibrium dialysis (conventional and rapid equilibrium dialysis devices) and ultrafiltration. However, both techniques are time-consuming, requiring measurement of the drug concentration in each compartment of the dialysis apparatus or, in the case of ultrafiltration, in the reservoir and filtrate. Solubility is also a problem for highly lipophilic compounds (Burns et al., 2015). Given the broad dependence of NSB on lipophilicity and charge state, several algorithms based on these properties have been developed to predict fumic, thereby circumventing the need for experimental methods (Austin et al., 2002; Hallifax and Houston, 2006; Sykes et al., 2006; SimCYP calculator).
It is clear, however, that physicochemical and chemical properties other than charge and lipophilicity determine NSB and hence fumic. For example, we and others have reported that molecular mass, polar surface area, charge distribution, the number of hydrogen bond donors/acceptors, and the presence of halogen atoms (especially the trifluoromethyl group) may all influence NSB (Gao et al., 2008; Li et al., 2009; McLure et al., 2011; Burns et al., 2015). Moreover, we demonstrated recently that algorithms commonly used to calculate logP gave widely discrepant values of this parameter, differing by as much as a factor of 2 (i.e., 2 log units) (Burns et al., 2015). Perhaps not surprisingly, we observed that the published algorithms that use logP (or logD for acids) and charge state poorly predicted the fumic values of a series of protein kinase inhibitors (Burns et al., 2015).
We describe in this study a hologram-based approach for the computational prediction of the NSB of drugs to hepatic microsomes. Hologram quantitative structure activity relationship (HQSAR) is a technique that employs fragment fingerprints (molecular holograms) as predictive variables of biologic activity or structural data. Each molecule in the data set of interest is fragmented into structural components to generate a molecular hologram that provides a count of the number of times a specific component is identified. Partial least squares analysis is then used to generate a statistical model that relates the molecular holograms (descriptor variables) to a measured property [viz. log([1 − fumic]/fumic) in this study] (Wold et al., 1984). HQSAR has been applied to the prediction of several biologic variables, including inhibition/antagonism of different drug targets, toxicity prediction, drug oral bioavailability, and identification of novel chemical scaffolds (Tong et al., 1998; Moda et al., 2007; Nair et al., 2008; Nair and Sobhia, 2008a,b). In the current study, a database of 132 drugs with a broad range of physicochemical properties was collated to establish quantitative relationships between fumic and the molecular fragments. Models generated were evaluated using an independent set of test drugs. The models show excellent discrimination between high, intermediate, and low microsomal binders, with a high predictive power.
Materials and Methods
Data Set for Analysis.
The fumic values of 98 drugs from studies with HLM were collated from published data (Obach, 1999; McLure et al., 2000, 2011; Naritomi et al., 2001; Gertz et al., 2008; Gao et al., 2008; Kilford et al., 2008; Raungrut et al., 2010; Uchaipichat et al., 2011; Wattanachai et al., 2011; Burns et al., 2015; Pattanawongsa et al., 2015) (Supplemental Tables 1 and 2). Because fumic does not differ appreciably between HLM and RLM (Obach, 1997; Zhang et al., 2010), fumic values for the binding of 34 drugs to RLM were additionally incorporated into the data set (Obach, 1997; Austin et al., 2002). Thus, the data set in total contained 132 compounds, comprising 28 acidic, 55 neutral, and 49 basic drugs. The classification of acids (pKa for the formation of an anion <7.4) and bases (pKa for the formation of a cation >7.4) was as defined previously (Austin et al., 2002; Sykes et al., 2006). The data set molecules were randomly segregated into 82 training and 34 test set molecules, with 16 compounds excluded as outliers (see Results and Discussion). Based on the UNITY fingerprint (generated using SYBYLX-2.1, Tripos International, Certara, St Louis, MO; Supplemental Fig. 1), training and test set compounds exhibited an acceptable balance of similarity/dissimilarity. Where fumic values were determined at microsomal concentrations other than 0.25 and 1 mg/ml, data were normalized to 0.25 mg/ml and 1 mg/ml, using the expression (Austin et al., 2002):

where fu1 is the fraction unbound obtained at particular microsomal concentration C1, fu2 is the normalized fumic at concentration C2 (0.25 mg/ml or 1 mg/ml). The fumic values were transformed as log[(1 − fumic)/fumic], given the similarity of this expression to an equilibrium constant (Austin et al., 2002; Sykes et al., 2006). Values of fumic ≥ 1 were rounded to 0.99, for the ease of calculation and to prevent exclusion of data.
Molecular Modeling and HQSAR Model Development.
Molecular modeling studies were performed using the molecular modeling package SYBYL-X 2.1 installed on a Macintosh Workstation running on OS X 10.9.5 operating system (SYBYL-X 2.1). The structural coordinates of drug molecules were obtained from the Pubchem server (https://pubchem.ncbi.nlm.nih.gov/) and imported into SYBYL.
Molecular fragments were generated with different atom counts (see Table 1) and were hashed into 85 bins (i.e., bins 1–85) of the fingerprint. The molecular hologram contains information about the number of fragments hashed into each bin. The optimal HQSAR model was derived from screening through the hologram lengths, set as 12 prime numbers ranging from 53 to 401 (SYBYL-X 2.1). Model development involved generation of a range of fragment sizes together with fragment features. Fragment size refers to the minimum and maximum size of the fragment in a hologram fingerprint. Fragment features include an atom feature (based on elemental atom types) and bonds and connections, which consider bond orders and hybridization states within fragments, respectively (SYBYL-X 2.1). The models shown in Table 1 were obtained based on atoms, bonds, and connection features (default parameters) of the molecule. Individual models were evaluated statistically using the r2cv, r2ncv, and S.E. (Table 1).
Statistical parameters obtained for different models with different atom counts
Model C highlighted in bold was the best model in the current analysis for both microsomal concentrations.
The best model (model C; Table 1) was further validated by predicting the log[(1 − fumic)/fumic] for an external set of test molecules and calculating the predictive r2, defined as:

where SD is the sum of the squared deviations between the measured fumic values [viz. log([1 − fumic]/fumic)] of molecules in the test set and the mean measured log[(1 − fumic)/fumic] values of the training set molecules, and PRESS is the sum of the squared deviations between predicted and actual activity values for all molecules in the test set (Waller et al., 1993; Nair et al., 2008; Nair and Sobhia, 2008b).
Results and Discussion
Currently available models [including quantitative structure activity relationship (QSAR)] for the prediction of drug NSB generally rely on, or at least incorporate, logP/D, charge state, or structural similarity. As noted earlier, we have recently demonstrated that approaches based on logP and charge state may be unreliable due to variation in the logP values between algorithms and the contribution of other physicochemical and chemical features to NSB (McLure et al., 2011; Burns et al., 2015). Thus, a hologram fragment approach was used in this study to develop a QSAR model based on published fumic values for 132 drugs. Published fumic values employed for model generation ranged from 0.002 to 0.99.
Several models were generated using various HQSAR parameters. Evaluation of the training set molecules across a range of atom counts (fragment size) (Table 1) and atoms, bonds, and connection parameters demonstrated significant correlations with NSB. The quality of the model is assessed from statistical parameters that include noncross-validated r2ncv, cross-validated r2cv by leave-one-out, predicted r2pred, and S.E. During model development, it was noted that the correlation improves as the atom count is increased from 1–4 to 3–6. However, beyond atom counts 4–7 the predictive power of the model decreased, as shown by a lower r2cv and higher S.E. The best model (C; Table 1) was obtained with atom counts 3–6, giving a r2ncv = 0.966 and r2cv = 0.680 (F = 1545, P = 1.58 × 10−54). Incorporation of additional features, namely chirality, hydrogen atoms, and hydrogen bond donor or acceptor features, resulted in poor predictive and statistically less significant models (data not shown). These models were not considered further.
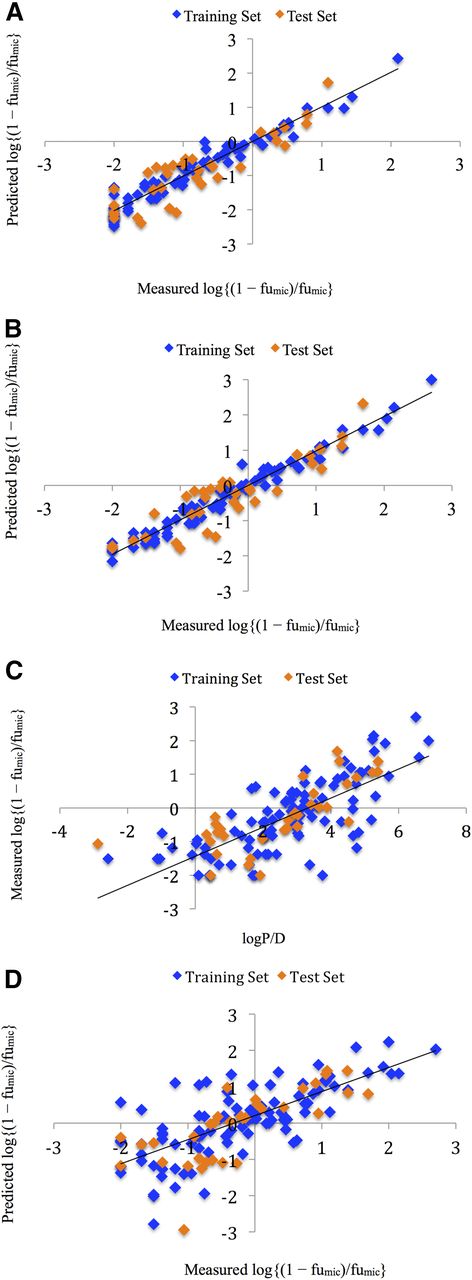
Earlier studies investigating the NSB of drugs were generally measured at a HLM (or RLM) concentration of 1 mg/ml. However, in vitro metabolism and inhibition studies are now often performed at lower HLM concentrations (≤0.25 mg/ml). To examine the predictivity of the hologram QSAR approach, fumic values obtained at two (0.25 mg/ml and 1 mg/ml) microsomal concentrations were considered. If the generated fragments truly determine NSB (and fumic), then similar prediction is expected irrespective of the microsome concentration. Importantly, the models generated in this work (A–F, Table 1) show identical correlations at both microsomal concentrations for the same training and test set compounds with near identical predictivity (Fig. 1, A and B). With respect to Fig. 1, it should be noted that log[(1 − fumic)/fumic] values in the range −0.95 to −2.00 represent compounds with an fumic > 0.9, whereas log[(1 − fumic)/fumic] values >2.00 represent compounds with a fumic < 0.01 (for 1 mg/ml microsomal concentrations).

(A and B) Plots of measured versus HQSAR predicted log[(1 − fumic)/fumic] of the training and test set molecules for microsome concentrations of 0.25 mg/ml (A) and 1 mg/ml (B). (C) Plot of measured log[(1 − fumic)/fumic] versus logP/D. (D) Plot of measured log[(1 − fumic)/fumic] versus predicted log[(1 − fumic)/fumic] for the logP/D model. The training set and test set molecules are shown as blue and orange squares, respectively.
The training set is comprised of 82 drugs: 18 acids, 31 bases, and 33 neutral molecules. The fumic values of drugs in the training set ranged from 0.002 (very high binders) to 0.99 (essentially unbound), all of which were predicted with high accuracy (Fig. 1; Supplemental Table 1). Notably, the hologram method is not biased toward a specific physicochemical class, and predicts the binding of acids, bases, and neutral compounds with high accuracy (Fig. 1). This contrasts to models based on logP and charge state where poorer correlations were noted for acidic and neutral drugs compared with bases, and hence for a combined database of acids, bases, and neutral compounds (Austin et al., 2002; Sykes et al., 2006). The QSAR model of Li et al. (2009) similarly predicted the fumic values of acidic drugs poorly.
The robustness of the HQSAR model is apparent from the test set predictivity, reflected by the predictive r2 (r2pred) value. Like the r2cv, the r2pred can assume a negative value reflecting a complete lack of predictive ability of the training set (Cramer et al., 1988). The test set of 34 drugs is comprised of 10 acids, 11 bases, and 13 neutral compounds with diverse chemical structures and fumic values ranging from 0.02 to 0.99. The fumic values of the drugs in each class were predicted well (Fig. 1), with r2pred = 0.748. In particular, the model accurately predicted high binders (84–98% binding at a microsome concentration of 1 mg/ml) in the test set, including ezlopitant (fumic = 0.02), sorafenib (fumic = 0.04), nicardipine (fumic = 0.04), chloropromazine (fumic = 0.08), lapatinib (fumic = 0.08), saquinavir (fumic = 0.10), promethazine (fumic = 0.11), and imipramine (fumic = 0.16) (Supplemental Table 2). Overall, the HQSAR method predicted the fumic values of all data set compounds (excluding outliers), within 1 log units (at a HLM concentration of 0.25 mg/ml), and 88% within 0.50 log units of the transformed fumic data.
The model of Austin et al. (2002) excluded compounds with a fumic > 0.90, as these compounds may be difficult to discriminate using equilibrium dialysis. In the current study, compounds with a fumic > 0.90 were included to examine the predictivity of the hologram approach, and the majority were predicted well. However, predicted transformed values [i.e., log([1 − fumic]/fumic)] for a number of compounds deviated from the measured values. Overall, of the 132 data set molecules, 16 were predicted with a deviation >±1 in the log[(1 − fumic)/fumic], and these were excluded from the training and test sets. Inclusion of the outliers in the training set reduced the r2 and q2 values to 0.833 and 0.401, respectively. Notably, 10 of these outliers possess either a steroid (aldosterone, androstenedione, β-estradiol cortisol, progesterone, and testosterone—all neutral molecules) or a morphinan nucleus incorporating a 4,5-epoxy ring system (buprenorphine, codeine, morphine, and naloxone—all bases), suggesting that the HQSAR approach is not consistently predictive for these structural classes. (Dextromethorphan and levallorphan, which contain the morphinan nucleus without the 4,5-epoxide, and dexamethasone and prednisone, were, however, correctly predicted as low binders, with a fumic > 0.90.) Atenolol, mibefradil, simvastatin, tacrolimus, tamoxifen, and trametinib were the other molecules with a deviation >±1 in log[(1 − fumic)/fumic]. Although the deviation in logarithmic transformed [i.e., log([1 − fumic]/fumic)] data is >1 for atenolol, the difference between measured and predicted fumic is relatively small (0.99 versus 0.90, respectively; Supplemental Table 1). Experimental error in the determination of fumic or concentration-dependent binding (McLure et al., 2011) may potentially contribute to the poor predictivity observed for mibefradil, simvastatin, tacrolimus, tamoxifen, and trametinib, whose inclusion in the training set significantly decreased overall model predictivity. As we have observed recently, the experimental determination of the NSB of highly lipophilic values can be problematic due to their limited aqueous solubility (Burns et al., 2015).
Our data set was additionally employed to investigate the predictivity of calculated logP/D (logP for bases, logD7.4 for acids and neutrals; see Supplemental Table 3) as the sole descriptor of fumic, as described by Austin et al. (2002). The training set was described by log[(1 − fumic)/fumic] = 0.43logP/D − 1.43 (r2 = 0.540, F = 113, P = 7.03 × 10⁻¹⁸) (Fig. 1C). This expression was subsequently used to predict log[(1 − fumic)/fumic] (Fig. 1D). Compared with the HQSAR, the logP/D model shows lower test set predictivity with a r2pred = 0.534 (cf. 0.748 for the HQSAR model; see above). Exclusion of the outliers from the HQSAR method had minimal effect on the performance of the logP/D model. Consistent with previous data from this laboratory (Sykes et al., 2006), the correlation for acids and neutral molecules was worse than that for bases using the logP/D method. As noted earlier, calculated values of logP/D vary between algorithms, and it is possible that the use of alternative algorithms may result in better (or worse) correlations. Furthermore, logP/D can be combined with other descriptors such as polar surface area, van der Waal donor surface area, connectivity indices, etc., to improve the prediction of fumic (Gao et al., 2008; Li et al., 2009).
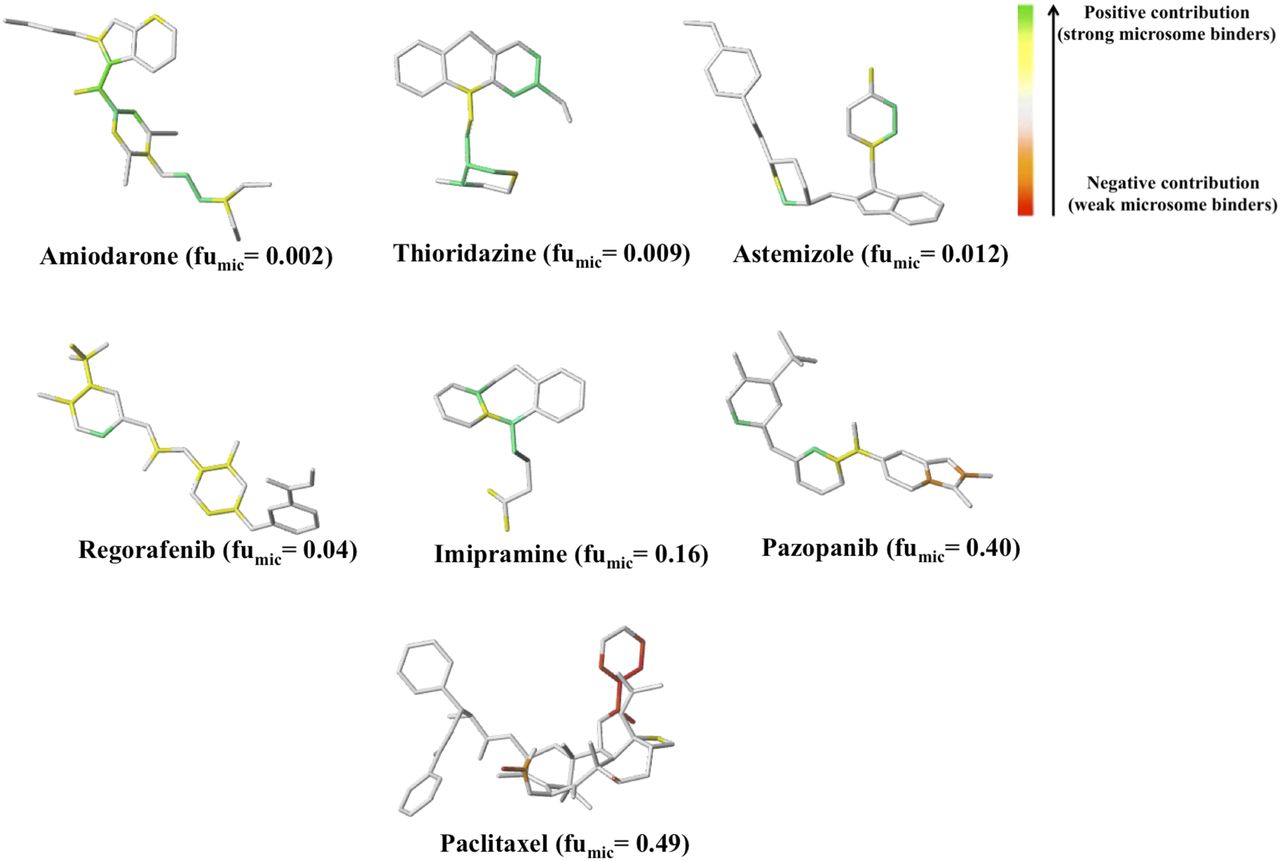
The HQSAR approach further provides insights into the contribution of specific atoms and functional groups toward NSB by atomic color coding. Atoms or groups that lie near green end of the color spectrum (Fig. 2) suggest a favorable contribution to NSB, whereas one toward red end reflects an unfavorable contribution to NSB. Figure 2 shows the color coding for representative drugs of different charge state (base and neutral) and which exhibit a wide a range of fumic values. Generally, drugs that are high binders tend to show more atoms/groups with a positive contribution (noted as green/yellow) toward NSB (e.g., amiodarone, thioridazine, regorafenib), whereas poor binders (e.g., piroxicam, indapamide) show more atoms/groups with a negative contribution (red/orange end of the spectrum) to NSB. Although color coding is qualitative, atomic/molecular features associated with strong microsomal binding can be identified. Features that contribute to NSB include an amine group (e.g., amiodarone, thioridazine, astemizole), a halogen atom (e.g., amiodarone, astemizole, regorafenib, sorafenib), the −CF3 group (e.g., regorafenib, sorafenib), a methylpiperidine ring (e.g., thioridazine), and hydrocarbon features (e.g., amiodarone, imipramine, paclitaxel, thioridazine, regorafenib). By contrast, no features that consistently contribute unfavorably to NSB were highlighted, including the carboxylic acid group, which is the common feature of low-binding organic acids.

Contribution map of selected compounds from HQSAR. The fumic values shown in parentheses are for a microsome concentration of 1 mg/ml.
In conclusion, the HQSAR method reported in this work reliably predicted the fumic values of 114 of 120 (i.e., 95%) training and test set drugs when compounds with a steroid or morphinan 4,5-epoxide nucleus are excluded. Thus, the HQSAR method provides an alternative approach to laboratory-based procedures for the prediction of the NSB of drugs to liver microsomes, irrespective of the drug charge state (acid, base, or neutral). The method would appear to be particularly valuable for assessing the NSB of large data sets of new drug-like molecules.
Authorship Contributions
Participated in research design: Nair, Miners.
Conducted experiments: Nair.
Performed data analysis: Nair, Miners.
Wrote or contributed to the writing of the manuscript: Nair, Miners, McKinnon.
Footnotes
- Received May 29, 2016.
- Accepted August 18, 2016.
This work was supported by Flinders University [fellowship to P.C.N.] and National Health and Medical Research Council of Australia [Project Grant 1044063]. R.A.M. is a recipient of a Beat Cancer Professorial Fellowship from Cancer Council SA.
↵
 This article has supplemental material available at dmd.aspetjournals.org.

Abbreviations
- fumic
- fraction unbound in the incubation medium
- HLM
- human liver microsome
- HQSAR
- hologram QSAR
- NSB
- nonspecific binding
- QSAR
- quantitative structure activity relationship
- RLM
- rat liver microsome
- Copyright © 2016 by The American Society for Pharmacology and Experimental Therapeutics


