


Abstract
Rosuvastatin is a new 3-hydroxy-3-methylglutaryl coenzyme A reductase inhibitor. The liver is the target organ for the lipid-regulating effect of rosuvastatin; therefore liver-selective uptake of this drug is a desirable property. The aim of this study was to investigate, and compare with pravastatin and simvastatin, the tissue-specific distribution of rosuvastatin. Bolus intravenous doses (5 mg/kg) of radiolabeled rosuvastatin, pravastatin, and simvastatin were administered to rats, and initial uptake clearance (CLuptake) in various tissues was calculated. Hepatic CLuptake of rosuvastatin (0.885 ml/min/g tissue) was significantly (p < 0.001) larger than that of pravastatin (0.703 ml/min/g tissue), and rosuvastatin was taken up by the hepatic cells more selectively and efficiently than pravastatin. Hepatic CLuptake of simvastatin (1.24 ml/min/g tissue) was significantly larger than that of rosuvastatin (p< 0.01) and pravastatin (p < 0.001). However, adrenal CLuptake of simvastatin (1.55 ml/min/g tissue) was larger than hepatic CLuptake, and simvastatin was distributed to other tissues more easily than rosuvastatin. Microautoradiography of the liver, spleen, and adrenal was undertaken 5 min after administration of the study drugs; distribution was quantified by counting the number of silver grains. After administration of rosuvastatin and pravastatin, silver grains were distributed selectively in the intracellular space of the liver, but more rosuvastatin (3.3 ± 1.0 × 10⁵particles/mm2) than pravastatin (2.0 ± 0.3 × 10⁵ particles/mm2) tended to distribute to the liver. Simvastatin was less liver-specific (it also distributed to the spleen and adrenal). The results of this study indicated that rosuvastatin was taken up by hepatic cells more selectively and more efficiently than pravastatin and simvastatin.
Rosuvastatin (Crestor), calcium bis[(+)-(3R,5S,6E)-7-[4-(p-fluorophenyl)-6-isopropyl-2-(N-methylmethanesulfonamido)-5-pyrimidinyl]-3,5-dihydroxy-6-heptenoate], is a new and highly effective inhibitor of 3-hydroxy-3-methylglutaryl coenzyme A (HMG-CoA1) reductase (the rate-limiting enzyme in cholesterol biosynthesis). The drug, hereafter referred to as rosuvastatin, which was originally synthesized at Shionogi and Co., Ltd. (Watanabe et al., 1997), has completed phase III clinical development at AstraZeneca for the treatment of patients with dyslipidemia. In clinical trials, rosuvastatin (1 to 80 mg) produced significant dose-dependent reductions in low-density lipoprotein cholesterol (up to 65%), total cholesterol, and apolipoprotein B (Olsson et al., 2001). Reductions in triglycerides and increases in high-density lipoprotein cholesterol were consistently observed with rosuvastatin, and the drug was well tolerated (Olsson et al., 2001).
The liver is the target organ for the lipid-regulating effect of rosuvastatin; therefore liver-selective uptake of this drug is a desirable property. The aim of the present study was to investigate, and compare with pravastatin and simvastatin, the tissue-specific distribution of rosuvastatin in rats.
Experimental Procedures
Materials.
[14C]Rosuvastatin (1.15 MBq/mg), [14C]pravastatin (1.17 MBq/mg), and [14C]simvastatin (1.85 MBq/mg) were synthesized at Shionogi and Co., Ltd. (Osaka, Japan). The radiochemical purities were 99.4, 99.0, and 98.6%, respectively. The chemical structure of these HMG-CoA reductase inhibitors is shown in Fig.1. All other chemicals were of analytical grade and commercially available.

Chemical structures of [14C]rosuvastatin, [14C]pravastatin, and [14C]simvastatin.
The asterisk denotes the labeled position. Molecular weights of rosuvastatin, pravastatin, and simvastatin are 500, 447, and 419, respectively.
Animals.
Male rats of Jcl:Sprague-Dawley strain were purchased from CLEA Japan, Inc. (Osaka, Japan). The rats were 10-weeks old, and their weight ranged between 317 and 405 g. Prior to study, the rats acclimatized for 1 week in the animal room at Shionogi and Co., Ltd. (room temperature 23 ± 1°C; relative humidity 55 ± 10%); free access to water and laboratory food (CA-1; CLEA Japan, Inc.) was permitted.
Preparation of the HMG-CoA Reductase Inhibitors.
Dosing solutions (5 mg/ml) were prepared immediately before administration of the HMG-CoA reductase inhibitors to the rats. [14C]Rosuvastatin and [14C]pravastatin were dissolved in physiological saline. [14C]Simvastatin was dissolved in a mixture of N,N-dimethylacetamide, HCO60 (hydrogenated castor oil 60), and physiological saline (2:1:4, by volume).
In Vivo Experiment.
The rats were anesthetized by intraperitoneal administration of pentobarbital sodium (50 mg/kg) and incised along the abdominal midline. A bolus intravenous dose (5 mg/kg) of [14C]rosuvastatin, [14C]pravastatin, or [14C]simvastatin dosing solution was then administered through the tail vein.
At 15, 30, 45, 60, 90, 120, 150, 180, 240, and 300 s after administration of the HMG-CoA reductase inhibitor, blood (8–10 ml) was drawn from the abdominal vena cava for exactly 60 s. The rats were killed by exsanguination and the following tissues and organs collected: eyeball, cerebrum, cerebellum, thyroid, lung, heart, adrenal, testis, prostate, spleen, kidney, liver, and ileum.
Handling of Samples for Calculation of Uptake Clearance.
Blood samples were centrifuged at 13,000g for 30 s, and the plasma harvested. A 100-μl aliquot of the plasma sample was weighed in a counting vial. Pico-Fluor 40 (PerkinElmer Life Sciences, Boston, MA) 10 ml was then added, and the radioactivity measured by a liquid scintillation counter (Tri-Carb 2200-CA; PerkinElmer Life Sciences).
A sample of each tissue/organ (blotted on filter paper to remove as much blood as possible) was weighed in a counting vial. Soluene-350 (2 ml; PerkinElmer Life Sciences) was added to solubilize the sample, which was then bleached with 200 μl of hydrogen peroxide solution. Pico-fluor 40 (10 ml) was added, and the radioactivity measured by a liquid scintillation counter (Tri-Carb 2200-CA).
Calculation of Uptake Clearance.
The uptake clearance was calculated according to the following differential equation (Kim et al., 1988; Yanai et al., 1990). where Xtissue,t denotes the tissue concentration of total radioactivity at time t, CLuptake denotes uptake clearance, andCp,t denotes the plasma concentration of the total radioactivity at time t.
By integrating eq. 1 with time and dividing both sides of the equation by Cp,t, eq. 2 is obtained. The slope of the linear line obtained by plotting AUC0-t/Cp,tagainstXtissuet/Cp,t(an integration plot) corresponds to CLuptake(Kim et al., 1988, Yanai et al., 1990). Thus, the AUC0-t value was calculated by the trapezoidal rule, and the AUC0-t/Cp,tvalues were plotted against theXtissue,t/Cp,tvalues. The CLuptake value was then calculated by linear regression analysis. The data points actually employed in the calculation of the CLuptake values occurred 15–240 s after administration of the HMG-CoA reductase inhibitor. If the number of data points on the line was small, saturation of tissue uptake was considered to have occurred early after administration.
Handling of Samples for Microautoradiography.
Samples of the liver and spleen and the whole adrenal were excised and rapidly frozen by liquid nitrogen. Sections (10 μm) were then prepared, lyophilized, and mounted on glass slides coated with photosensitive emulsion (NTB-3; Kodak, Rochester, NY). After exposure in a shaded box for 1 month at 4°C, the glass slides were developed for 2 min at 17°C with Dektol (Kodak) and stained with methyleneblue-basic fuchsin for microscopic observation.
Quantitative Microautoradiography.
Input of image data and software for imaging analysis
For quantitative measurement, three different visible fields of the tissue picture (170 × 220 μm2 in size; object lens, ×40) were taken using a digital camera (HC-2000; Fuji Photo Film Co., Ltd., Tokyo, Japan) connected to a light microscope. For imaging analysis, Optimas version 6 (Optimas Corporation, Bothell, WA) software was used.
Measurement of the outer and inner areas of cell.
The unstained area was regarded as the outer area of the cell (cellular interstitial part and blood vessel). By setting the threshold level of the stained color, separation of the outer area of the cell from the inner area of the cell was achieved and each area (Scell) was measured.
Measurement of the total area of silver grains.
To discriminate the silver grains, the threshold level of the color was set again for each area (outer and inner) of the cell, and the total area of silver grains (Sgtotal) in each was measured.
Measurement of the mean area of each silver grain.
In the case that more than two particles of silver grains are present as a mass, this mass is counted as one particle. Therefore, the mean area of each silver grain (Sgmean) was calculated according to the following procedure.
Using the outer area of the liver cells showing good separation of each silver grain and having negligible mass of silver grains, the total number of the silver grains (Ntotal) present in the outer parts of the cells as well as Sgtotal were measured, and Sgmean was calculated according to eq. 3.
Measurement of the number of silver grains in each unit area of the outer and inner parts of the cell.
The number of silver grains in each unit area (N) was calculated (particles/mm2) for the outer and inner parts of the cell according to eq. 4.
Statistical Analysis.
An analysis of variance was performed to determine the statistical significance between groups using Bartlett's test. Significant differences between the means were examined using Tukey's method. Comparison of regression lines was performed by calculating the standard error of the difference in slope according to Student'st test. Statistical significance between observed data and data calculated by linear regression were determined by Pearson's method, which is used to estimate the significance for the linear correlation.
Results
Uptake Clearance.
Figure 2 shows the integration plots for uptake by the liver, kidney, spleen, and adrenal following administration of [14C]rosuvastatin (Fig. 2A), [14C]pravastatin (Fig. 2B), and [14C]simvastatin (Fig. 2C). The CLuptake values (i.e., the slopes of the integration plots) are summarized in Fig.3. The linear correlation was statistically significant in all tissues examined except for kidney for pravastatin, in which the correlation coefficient was relatively low (r = 0.767).

Integration plots of [14C]rosuvastatin (plot A), [14C]pravastatin (plot B), and [14C]simvastatin (plot C).
The data points are from single animals. Closed circle, liver; open circle, kidney; triangle, spleen; square, adrenal. The statistical significance of the linear correlation was determined as follows: plot A, p < 0.01 (liver, kidney, and adrenal),p < 0.05 (spleen); plot B, p< 0.01 (liver, spleen, and adrenal); plot C; p < 0.01 (all tissues).

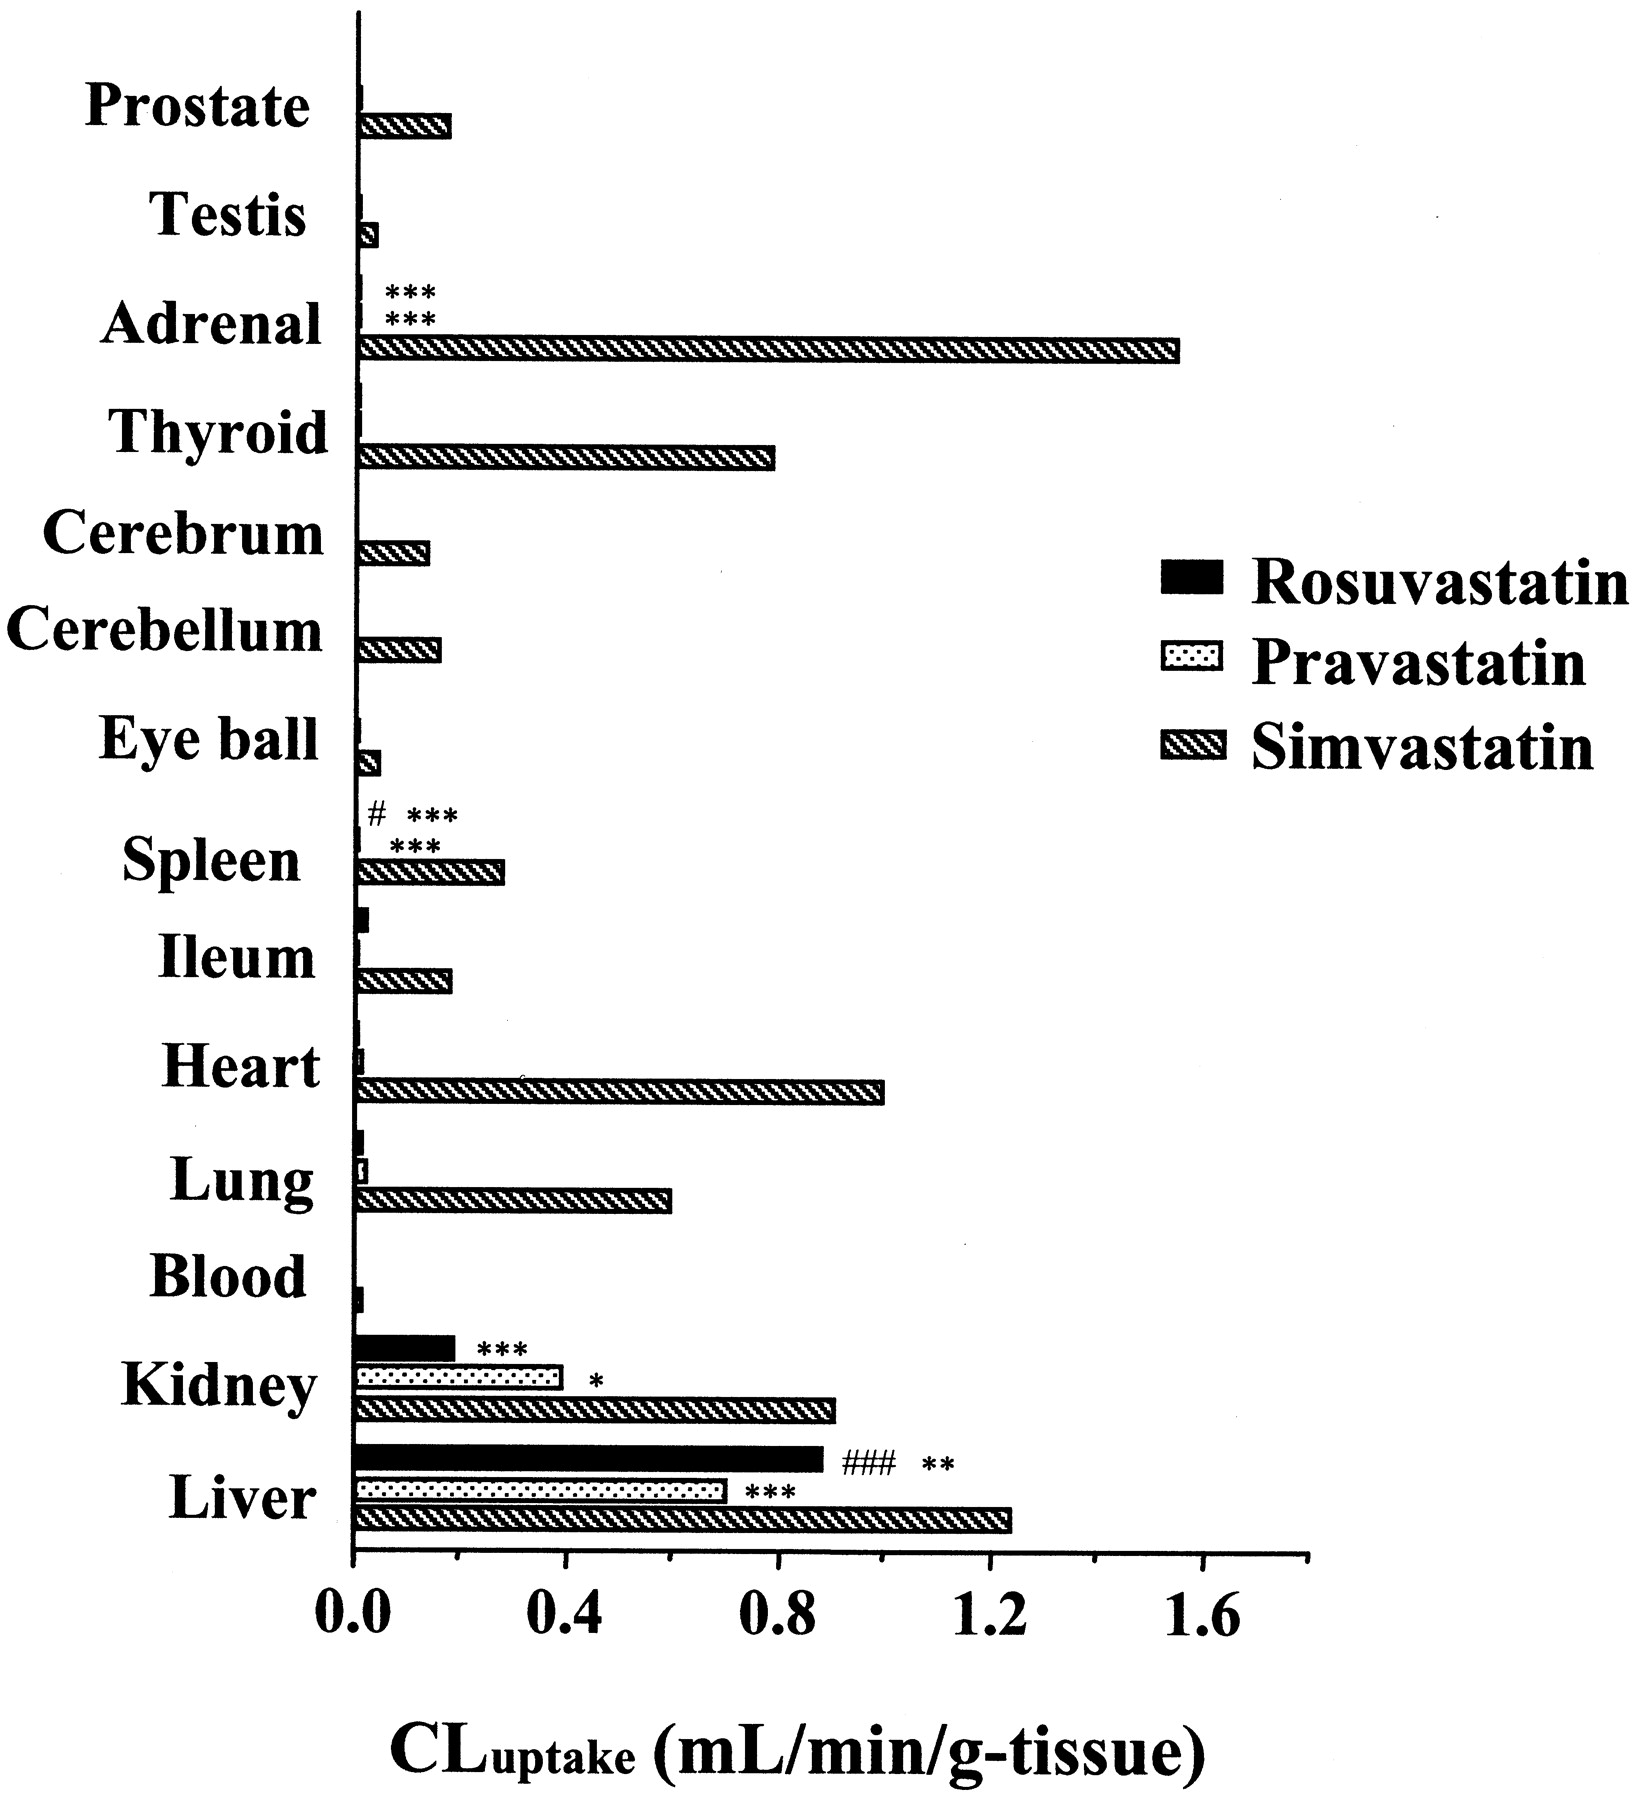
Comparison of uptake clearance (CLuptake) in tissues and organs after intravenous administration of [14C]rosuvastatin, [14C]pravastatin, and [14C]simvastatin.
Statistical significance was examined in liver, kidney, spleen, and adrenal. #, significantly different from pravastatin (#,p < 0.05; ###, p < 0.001); ∗, significantly different from simvastatin (∗,p < 0.05; ∗∗, p < 0.01; ∗∗∗, p < 0.001).
Following administration of [14C]rosuvastatin, the liver showed the highest CLuptake value (0.885 ml/min/g tissue). The kidney showed the second highest CLuptake value (0.186 ml/min/g tissue; approximately 20% of that in the liver), followed by the ileum (0.021 ml/min/g tissue; approximately 2% of that in the liver). CLuptake values for the lung and heart were 0.012 and 0.010 ml/min/g tissue, respectively (approximately 1% of that in the liver). CLuptake values for other tissues and organs were extremely low (<0.5% of that in the liver). These results demonstrate that uptake of rosuvastatin by the liver was very selective.
Following administration of [14C]pravastatin, the liver showed the highest CLuptake value (0.703 ml/min/g tissue). The kidney showed the second highest CLuptake value (0.390 ml/min/g tissue; approximately 55% of that in the liver), followed by the lung (0.022 ml/min/g tissue; approximately 3% of that in the liver) and the heart (0.013 ml/min/g tissue; approximately 2% of that in the liver). CLuptake values for other tissues and organs were very low (<2% of that in the liver).
Following administration of [14C]simvastatin, the adrenal showed the highest CLuptake value (1.55 ml/min/g tissue; approximately 25% higher than that in the liver). The liver showed the second highest CLuptake value (1.24 ml/min/g tissue) followed by the heart, kidney, thyroid, and lung (0.995, 0.911, 0.785, and 0.598 ml/min/g tissue, respectively; approximately 80–50% of that in the liver). The CLuptake values for other tissues and organs were low (<25% of that in the liver).
Microautoradiography.
The microautoradiograms obtained from the liver, spleen, and adrenal are shown in Fig. 4. In the liver (Fig.4a), a large number of silver grains were observed for all drugs. In the spleen (Fig. 4b), silver grains were only observed for simvastatin. In the adrenal (Fig. 4c), silver grains were also only observed for simvastatin (to at least the same extent as in the liver). The number of silver grains distributed to each tissue is shown in Table1.

Microautoradiograms of [14C]rosuvastatin (A), [14C]pravastatin (B), and [14C]simvastatin (C) in rat liver (a), spleen (b), and adrenal (c).
Arrows indicate some of the silver grains.
Distribution of silver grains in rat tissues following intravenous administration of [14C]rosuvastatin, [14C]pravastatin, and [14C]simvastatin
In the intracellular space of the liver there were 3.3 ± 1.0 × 10⁵ particles/mm2 for rosuvastatin, 2.0 ± 0.3 × 10⁵particles/mm2 for pravastatin, and 3.1 ± 0.9 × 10⁵particles/mm2 for simvastatin. Thus the number of silver grains distributed to the liver following administration of rosuvastatin and simvastatin tended to be greater than that following administration of pravastatin, although it was not statistically significant. In the extracellular space of the liver, there was no difference in the number of silver grains between the drugs.
In the spleen there were almost no silver grains in the inner or outer parts of the cell following administration of rosuvastatin and pravastatin. However, there were a number of silver grains (1.8 ± 0.2 × 10⁵particles/mm2) in the inner part of the cell following administration of simvastatin.
In the adrenal there were almost no silver grains in the inner or outer parts of the cell following administration of rosuvastatin and pravastatin. However, the number of silver grains in both the inner and outer parts of the cell was marked following administration of simvastatin. The number of silver grains in the inner part of the cell was 5.8 ± 0.5 × 10⁵particles/mm2, which was the highest value of all the tissues investigated.
Discussion
The liver is the target organ for the lipid-regulating effect of HMG-CoA reductase inhibitors; therefore liver-selective uptake of these drugs is a desirable property. In the present study, we investigated, and compared with pravastatin and simvastatin, the tissue-specific distribution of rosuvastatin in rats.
The hepatic CLuptake of rosuvastatin (0.885 ml/min/g tissue) was significantly (p < 0.001) larger than that of pravastatin (0.703 ml/min/g tissue). [The hepatic CLuptake value for pravastatin is comparable to values reported previously, 0.44 ml/min/g tissue (Yamazaki et al., 1993) and 0.59 ml/min/g tissue (Yamazaki et al., 1996).] Furthermore, the CLuptake values of pravastatin in the kidney, testis, thyroid, eyeball, prostate, and spleen were 2- to 4-times larger than those of rosuvastatin, indicating that rosuvastatin was taken up by the hepatic cells more selectively and more efficiently than pravastatin. The microautoradiographic data showed that both rosuvastatin and pravastatin were distributed selectively in the intracellular space of the liver, but more rosuvastatin than pravastatin tended to distribute to the liver.
The hepatic CLuptake of simvastatin (1.24 ml/min/g tissue) was significantly larger than that of rosuvastatin (p < 0.01) and pravastatin (p < 0.001). However, the CLuptake values of simvastatin in the other tissues were much larger than those of rosuvastatin, indicating that simvastatin distributed to other tissues more easily than rosuvastatin. The microautoradiographic data also showed that simvastatin distributed to several tissues and was less liver-specific.
The results of this study support the previous finding that pravastatin has a higher liver-selectivity than simvastatin (Koga et al., 1995; van Vliet et al., 1995). However, the number of silver grains in the spleen following administration of pravastatin was much less than that of simvastatin, and this differs from previous findings (Koga et al., 1992). Transport of pravastatin to hepatocytes is proposed to occur mainly via a Na+-independent anion transporter in the sinusoidal membrane, due to the negative charge and hydrophilicity of pravastatin (Komai et al., 1992; Yamazaki et al., 1993). In contrast, passive diffusion may contribute largely to the transport of simvastatin because of its high lipophilicity (Komai et al., 1992). Therefore, pravastatin might be distributed less than simvastatin to tissues/organs without that putative transport mechanism (e.g., the spleen). The results of this study highlighted quite large differences in distribution to the extrahepatic tissues between these two compounds.
It has been speculated that rosuvastatin is selectively taken up by the liver via the organic anion transport system (possibly a Na+-independent anion transporter), due to the negative charge of rosuvastatin. A recent study involving oocytes expressing OATP-C or OATP-A suggested that rosuvastatin is a substrate for OATP-C but not for OATP-A (Brown et al., 2001).
The n-octanol-water partition coefficient of rosuvastatin is 1.46 at pH 7.0, which is closer to that of pravastatin (0.59) than that of simvastatin (48400) (Serajuddin et al., 1991). The high lipophilicity of simvastatin has been linked with side effects such as myopathy (Pierno et al., 1999). Furthermore, compared with pravastatin, a hydrophilic compound, the risk of myopathy with simvastatin was shown to be higher when using a urethane infusion method (Matsuyama et al., 2002). Generally, the specific distribution of drugs to the target organ contributes to the increase of clinical effect and the decrease of toxicity in the other organs. In the clinical dose-ranging trial (1–80 mg) of rosuvastatin for 6 weeks, myopathy, which can be associated with elevated creatine kinase levels, is relatively infrequent (Olsson et al., 2001). However, there are serious events associated with statin therapy that appear to be more common at higher doses of the other statins (Maron et al., 2000). The high hydrophilicity of rosuvastatin may explain the minor nonspecific distribution to extrahepatic tissues and may be consistent with low toxicity.
In the clinical trial for 12-week dosing, 5 and 10 mg of rosuvastatin reduced low-density lipoprotein cholesterol by 42 and 49%, respectively, compared with a 28% reduction with 20 mg of pravastatin and 37% with 20 mg of simvastatin, and the effect of rosuvastatin was significantly larger than either pravastatin or simvastatin (Paoletti et al., 2001). It has been reported that rosuvastatin exhibited inhibition of cholesterol synthesis with an IC50 of 0.16 nM in rat hepatocytes and was significantly more potent than both pravastatin and simvastatin (McTaggart et al., 2001). In addition to this higher potency, our findings, the more selective distribution to the liver, also contribute to a greater clinical effect of rosuvastatin over both pravastatin and simvastatin.
In conclusion, the results of this study indicated that rosuvastatin was taken up by the hepatic cells more selectively and more efficiently than pravastatin and simvastatin.
Acknowledgments
We thank T. Nagasaki, Y. Katsuyama, and M. Segawa for synthesizing and purifying [14C]rosuvastatin, [14C]pravastatin, and [14C]simvastatin.
Footnotes
- Abbreviations used are::
- HMG-CoA
- 3-hydroxy-3-methylglutaryl coenzyme A
- CLuptake
- clearance uptake
- Cp,t
- plasma concentration of total radioactivity at time t
- AUC
- area under the curve
- Sgtotal
- total area of silver grains
- Sgmean
- mean area of each silver grain
- OATP
- organic anion transporters
- Received March 3, 2002.
- Accepted July 31, 2002.
- The American Society for Pharmacology and Experimental Therapeutics


