


Abstract
The benzyloxy-substituted lactone cyclooxygenase-2 inhibitor DFB [3-[(3,4-difluorobenzyl)oxy]-5,5-dimethyl-4-[4-(methylsulfonyl)phenyl]furan-2(5H)-one] is metabolized in human and rat liver microsomal incubations and hepatocytes to a fluorescent metabolite, DFH [3-hydroxy-5,5-dimethyl-4-[4-(methylsulfonyl)phenyl]furan-2(5H)-one]. This process is CYP3A-mediated in both species, as demonstrated by incubations with recombinant CYP3A enzymes and experiments with inhibitory antibodies. Measurement of DFH fluorescence can be used as a rapid readout of CYP3A activity following microsomal or cultured hepatocyte incubations. In rat and human hepatocytes treated with prototypical inducers, the formation of DFH was linear for the first 30 min, with no secondary metabolism of DFH, such as phase II glucuronidation, observed at early time points. Using a panel of four prototypical inducers (phenobarbital, dexamethasone, phenytoin, and rifampicin), the correlation between testosterone 6β-hydroxylation in cultured human hepatocytes and CYP3A enzyme level in cell lysate was confirmed. DFB debenzylation was then shown to correlate well with testosterone 6β-hydroxylation in hepatocytes treated with these four inducers. Primary cultured rat and human hepatocyte induction assays were optimized for 24- and 96-well plates, respectively. Controls were established to evaluate whether test compounds demonstrate time-dependent CYP3A inhibition to avoid false negative results. Thus, the use of DFB, a fluorogenic CYP3A-selective probe substrate, affords a fast, efficient, and robust assay for the measurement of CYP3A induction in both rat and human cultured primary hepatocytes.
Cytochrome P450 (P450) enzymes form a gene superfamily that is involved in the metabolism of a variety of chemically diverse substances ranging from endogenous compounds to xenobiotics, including drugs, carcinogens, and environmental pollutants (Guengerich, 1991). CYP3A is regarded as one of the most important P450s due to its abundance, comprising ∼30% of total cytochrome P450 in human liver (Shimada et al., 1994). In the mid 1990s, it was recognized that CYP3A contributed to the metabolism of more than 50% of marketed drugs (Harris et al., 1995). Unfortunately, CYP3A is induced by many drugs (Whitlock and Denison, 1995), and this may give rise to drug-drug interactions as a result of increased drug metabolism or to increased clearance of the drug by autoinduction. Therefore, it is clearly advantageous for the pharmaceutical industry to develop new drugs that are free of CYP3A-inducing properties, and the value of conducting these studies at the discovery stage is recognized.
Several in vitro models have been proposed to assess the potential for new drug candidates to induce CYP3A (Maurel, 1996; Silva et al., 1998; Kostrubsky et al., 1999; LeCluyse, 2001). Although the discovery of the pregnane X receptor (PXR), a mediator of drug-induced expression of CYP3A4 (Kliewer et al., 1998; Lehmann et al., 1998), has led to the development of PXR reporter gene assays (Moore et al., 2000; El-Sankary et al., 2001; Luo et al., 2002), the primary cultured human hepatocyte model is still regarded as the gold standard for predicting human P450 induction. Several groups have demonstrated a good correlation between CYP3A induction in vitro with that observed in vivo (Pichard et al., 1990; Silva et al., 1998; LeCluyse et al., 2000; LeCluyse, 2001).
In the past, induction of CYP3A in human primary hepatocytes was determined by Western blot analysis of microsomes or cellular homogenate prepared from treated cells (Silva et al., 1998). These methods are not only labor intensive, but because they require large numbers of cells, they are also not compatible with a 96-well plate format. Hence, the next challenge in the development of this model was to make it compatible with higher throughput formats.
The measurement of P450 mRNA induction (Burczynski et al., 2001) and enzyme activity (Kostrubsky et al., 1999) is a method that is readily amenable to a 96-well plate format. mRNA levels may not always correlate with protein activity since, during induction, the increase in mRNA is a much earlier event than the increase in enzyme activity (Silva and Nicoll-Griffith, 2002). In terms of probe substrates, the measurement of testosterone 6β-hydroxylase activity is well accepted for CYP3A activity (Kostrubsky et al., 1999); however, it requires analysis involving chromatographic separation, which can be time-consuming. For example, analysis by HPLC/MS could take 3 min per sample; thus, a 96-well plate would require almost 5 h of analysis time in addition to sample preparation. The use of fluorogenic probe substrates as an activity readout is much faster. For example, a typical 96-well plate takes approximately 1 min to read in modern spectrophotometers, and little to no sample preparation is required.
Fluorogenic probes are used for measuring CYP1A and 2B induction in human and rat hepatocytes (Donato et al., 1993). Several fluorescent probes, such as 7-benzyloxy-4-trifluoromethylcoumarin (BFC) and 7-benzyloxyquinoline, are metabolized by CYP3A, which makes them very useful for enzyme inhibition assays with recombinant enzymes (Renwick et al., 2000; Stresser et al., 2002). However, they are also metabolized by CYP1A2, making them unsuitable for CYP3A measurements in intact cells where multiple P450 isozymes are present. More recently, an analog of BFC, 2,5-bis(trifluoromethyl)-7-benzyl-4-trifluoromethylcoumarin, was described to be selectively metabolized by CYP3A to the fluorescent metabolite 7-hydroxy-4-trifluoromethylcoumarin (Renwick et al., 2001). Unfortunately, the turnover rate is approximately 170-fold lower than BFC, which limits its utility as a probe (Renwick et al., 2001).
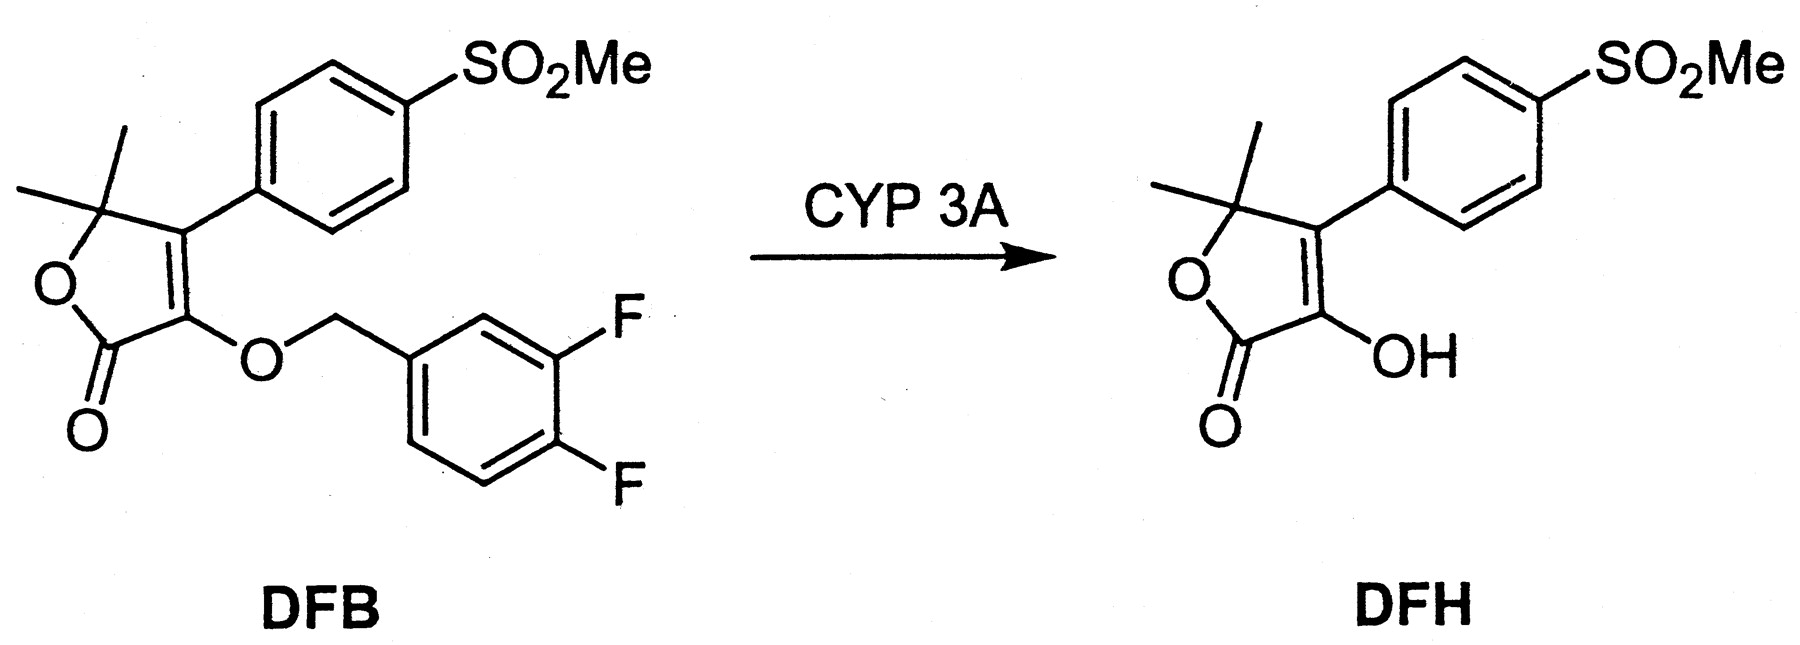
It was previously demonstrated that an isopropyl-substituted COX-2 inhibitor, designated DFP, is dealkylated selectively by CYP3A in the rat (Nicoll-Griffith et al., 2001) and that the product, DFH, is fluorescent (Chauret et al., 1999). A closely related benzyloxy analog of DFP, DFB (Fig. 1), is more rapidly and selectively metabolized by human CYP3A to DFH (Chauret et al., 1999). We show that the measurement of DFB debenzylation in hepatocyte culture media affords a fluorescence-based enzyme activity assay for rat and human CYP3A induction in primary cultured hepatocytes that is amenable to 24- and 96-well plate formats. The assay is efficient in the use of hepatocytes, gives a rapid readout, and is robust.

Metabolic pathway for DFB.
Materials and Methods
Materials. Williams' E media, dexamethasone, phenobarbital, phenytoin, and rifampicin were obtained from Sigma-Aldrich (St. Louis, MO). Waymouth 752 media and penicillin G/streptomycin were obtained from Invitrogen (Carlsbad, CA). Horseradish peroxidase-conjugated goat anti-rabbit antibody was purchased from Amersham Biosciences Inc. (Piscataway, NJ). DFB, DFH (Chauret et al., 1999), and compound 1 (D. Dubé, L. Dubé, M. Gallant, P. Lacombe, D. Deschenes, and D. MacDonald, patent application submitted for publication) were synthesized at Merck Frosst (Pointe-Claire-Dorval, QC, Canada). Stock solutions of DFB were typically prepared in acetonitrile. Rat liver microsomes were prepared as previously described (Lu and Levin, 1972). Hi5 insect cell microsomes containing recombinant rat P450 enzymes, coexpressed cytochrome P450 reductase and cytochrome-b5 (for CYP3A enzymes), and rabbit anti-rat CYP3A2 inhibitory antibody were obtained from BD Biosciences (Franklin Lakes, NJ). Collagenase type I was purchased from Worthington Biochemicals (Freehold, NJ). Matrigel, dispase, and type I collagen-coated dishes were purchased from BD Biosciences Discovery Labware (Bedford, MA). Testosterone and 6β-hydroxytestosterone were obtained from Steraloids (Newport, RI). All other chemicals were of high-purity grade and purchased from commercial sources.
Rat Hepatocyte Isolation and Culture. Rat hepatocytes were isolated from male Sprague-Dawley rats (weighing 200-250 g) by a two-step collagenase perfusion method (Moldeus et al., 1978). Only hepatocyte preparations attaining a cell viability of >85%, as assessed by trypan blue exclusion (0.2% trypan blue), were used. Hepatocytes were suspended in Williams' E medium (1 × 10⁶ cells/ml) containing 10-7 M dexamethasone and 10-6 M insulin and seeded on 24- (3 × 10⁵ cells/well) or 96-well plates (5 × 10⁴ cells/well) previously coated with Matrigel. For the 24-well plates, ice-cold Matrigel (30 μl/well) was spread and incubated in a humidified incubator at 37°C for 30 min to allow for gel formation. For the 96-well plate, Matrigel was diluted 1:15 in culture media, added to each well (100 μl/well), and incubated at 37°C for at least 60 min to allow for a thin layer of Matrigel to coat the bottom of the well. The remaining supernatant was then removed before adding the cells. Culture dishes containing hepatocytes were then placed in a humidified incubator saturated with a gas mixture of 6% CO2 and 94% air at 37°C. Cells were allowed 2 h to attach, at which time the medium was changed to remove unattached cells. Fresh media were replenished on a daily basis.
Human Hepatocyte Isolation and Culture. Fresh human liver tissue was obtained from consenting donors undergoing partial hepatectomies. Tissue samples were transported from the operating room in ice-cold University of Wisconsin (Madison, WI) solution. Hepatocyte isolation was conducted by a two-step collagenase perfusion of the liver sample as previously described (Li et al., 1992). Freshly isolated hepatocytes were suspended (1 × 10⁶ cells/ml) in Waymouth 752/liter medium supplemented as previously described (Li et al., 1992). The cells were then cultured in 24- and 96-well plates as described above for rat.
DFB Debenzylation and DFH Metabolism in Cultured Cells. Hepatocytes were washed with Krebs-Henseleit buffer containing 12.5 mM HEPES, pH 7.4, and DFB was incubated with the cells in Krebs-Henseleit at a final concentration of 60 μM. This corresponds to ∼2× the Km as the apparent Km for DFB turnover in human liver microsomes is ∼26 μM (Chauret et al., 1999). After specific incubation periods conducted at 37°C, aliquots (75 μl) were removed and transferred to a 96-well polystyrene plate (Costar black, flat bottom; Fisher Scientific, Ottawa, ON, Canada). An equal amount of 60% acetonitrile in TRIZMA base buffer (0.05 M, pH 10) was added. DFH was quantified using a fluorescent plate reader (Cytofluor II version 4.1 or 4.2; Applied Biosystems, Foster City, CA) at selected wavelengths (excitation and emission wavelengths of 360 and 440 nm, respectively). Selected aliquots were also analyzed by HPLC/UV and HPLC/fluorescence to evaluate whether the fluorescence signal obtained by the plate reader was due to DFH and to investigate the potential formation of other metabolites. Metabolic studies in cultured hepatocytes were also performed on DFH under conditions similar to those described above at a concentration of 5 μM. After specific incubation times (0,5, 15, 30, and 60 min), an aliquot was taken and treated as described above for fluorescence readout. In addition, selected aliquots were analyzed by HPLC/UV or HPLC/MS to evaluate the metabolic profile of DFH.
HPLC Instrumentation. The HPLC/UV system consisted of a Waters 600S controller, Waters 717 Plus autosampler, Waters 996 photodiode array detector (Waters, Milford, MA), and Shimadzu fluorescence detector (RF-551; Shimadzu, Kyoto, Japan). HPLC/MS analysis was performed on a PE Sciex API 2000 system (PerkinElmerSciex Instruments, Boston, MA).
HPLC Conditions for Analysis of DFB Incubations. DFH and DFB were analyzed using a reverse-phase C-18 column (Zorbax C-18, 150 × 4.6 mm; Chromatographic Specialties, Brockville, ON, Canada) with detection by UV (280 nm) or fluorescence (excitation, 360 nm; emission, 440 nm). MS analysis was achieved by electrospray in the negative ion mode. A typical gradient consisted of an initial composition of 90:10 solvent A (20 mM ammonium acetate buffer) and B (methanol), which was brought to a composition of 25:75 in 25 min at a flow rate of 1 ml/min. Under these conditions, DFH and DFB eluted around 11 and 22 min, respectively.
Characterization of Rat CYP3A Involvement in DFB Metabolism. Incubations with rat hepatic microsomes (0.25 mg of protein) or microsomes made from cell lines expressing rat CYP3A1 and CYP3A2 (10 pmol of P450) were performed in the presence and absence of a CYP3A2 inhibitory antibody. This antibody is reported by the manufacturer (Daiichi Pure Chemicals Co. Ltd., Tokyo, Japan) to be specific for CYP3A2 versus CYP1A1, 1A2, 2B1, 2B2, 2C11, 2E1, and 4A1. The microsomes were preincubated in phosphate buffer for 15 min with 10 μl of the antibody at room temperature before 50 μM DFB (methanol stock solution; final concentration, 0.5%) and 1 mM NADPH were added (total incubation volume, 500 μl). Incubations containing rabbit serum instead of the antibody were used as controls. Incubations using hepatic microsomal fractions were stopped at 15 min, and those with recombinant P450s were stopped at 20 min, by quenching the incubation mixture with an equal volume of acetonitrile. The precipitated proteins were separated by centrifugation for 10 min at 15,000 rpm in an Eppendorf centrifuge. The supernatants were diluted 1:1 with deionized water before analysis.
CYP3A Activity Measurement. CYP3A activity is reported as picomoles of product formed/(minutes × well) for the formation of 6β-hydroxytestosterone or DFH, as described below.
Testosterone 6β-Hydroxylation. Hepatocytes were washed two times with Krebs-Henseleit buffer containing 12.5 mM HEPES, pH 7.4, and incubated with the same buffer containing 100 μM testosterone at 37°C for 30 min. For 24-well plates, a total of 300 μl/well was added, whereas 100 μl/well was added for a 96-well plate. An aliquot of the media was then removed and diluted with an equal volume of acetonitrile. Testosterone and 6β-hydroxytestosterone were chromatographed similarly to a reported procedure (Sonderfan et al., 1987) using a Supelcosil LC-18 column (4.6 × 150 mm; Supelco, Bellefonte, PA) and UV detection at 254 nm. A gradient mobile phase consisting initially of 90:10 solvent A (methanol/water/acetonitrile, 39:60:1) and B (methanol/water/acetonitrile, 80:18:2) was brought to a composition of 10:90 in 15 min and held for 5 min, all at a flow rate of 1 ml/min. Under these conditions, 6β-hydroxytestosterone and testosterone eluted at 9 and 16 min, respectively. The retention time of 6β-hydroxytestosterone was confirmed with an authentic standard; however, quantification was made using an external standard curve of testosterone.
CYP3A Protein Measurement by Western Blot Analysis. Cultured hepatocytes (24-well plate) were harvested by incubating the cells with 25% dispase (400 μl/well) for approximately 15 min at 37°C followed by the addition of ice-cold phosphate-buffered saline (1 ml) containing 5 mM EDTA. Cells were then transferred to Eppendorf tubes and sedimented by centrifugation at 50g for 2 min. Cell pellets were resuspended in 100 μl of ice-cold 0.1 M potassium phosphate, pH 7.4. The pellet was homogenized by sonication on ice with 2 × 3-s bursts at minimum intensity (4710 series Ultrasonic Homogenizer; Cole-Parmer Instrument Co., Vernon Hills, IL). The cell homogenate was then used directly for Western blot analysis as previously described (Laemmli, 1970; Silva et al., 1998). Protein concentration was determined by the Bradford method using bovine serum albumin as the standard (Bradford, 1976).
96-Well Plate Design and Assay Protocol for Human CYP3A Induction. Human hepatocytes are first allowed 48 h to adapt to culture conditions followed by exposure to inducers for an additional 48 h, as previously described (Silva et al., 1998). Inducers are dissolved in dimethyl sulfoxide and added to cultures at a final concentration not exceeding 0.1%. Figure 2 illustrates the template for the 96-well human hepatocyte P450 induction assay. The top row of wells is reserved for the controls: blank (white), no cells; rifampicin (10 μM)-treated (yellow), maximum; and vehicle-treated (gray), minimum. The next four wells in each column are dosed with a given concentration of each test compound. Each compound is tested at three concentrations, 0.4, 2, and 10 μM, making it possible to test four compounds per plate, with four replicate measurements.

Description of the template for the 96-well plate incubation (see Materials and Methods).
The remaining three wells in each column (red) are also treated with rifampicin (10 μM) for 48 h, but they are then used to evaluate preincubation (time)-dependent CYP3A inhibitory properties of the compounds being tested. Two hours prior to the CYP3A activity analysis, the three wells at the bottom of each column (red) are washed with fresh warm media. Then, fresh media containing the drug being tested in that column are added to these wells. Two hours later, CYP3A activity is analyzed in each well by adding 100 μl of 60 μM DFB in Krebs-Henseleit buffer. After a 20-min incubation, 75-μl aliquots are transferred to a new 96-well plate, and 75 μl of 60% acetonitrile in TRIZMA base buffer (0.05 M, pH 10) is added. The plate is read on a spectrophotometer as described above.
On some occasions, some cells were also probed with testosterone before DFB. In these double-probe experiments, the cells were washed two times with warm Krebs-Henseleit buffer after the initial incubation with testosterone before probing again with DFB.
Calculation of CYP3A Induction. CYP3A induction was defined as a percentage of the positive control (dexamethasone or rifampicin) as described by % induction = (drug - vehicle-treated) × 100/(rifampicin at 10 μM - vehicle-treated).
CYP3A Preincubation (Time)-Dependent Inhibition in Human Liver Microsomes. Test compounds were evaluated for their potential to cause preincubation-dependent CYP3A inhibition. The method used DFB as a probe and was adapted from a published procedure (Chauret et al., 1999). Briefly, the test compounds present at various concentrations were preincubated for 0 min (nonpreincubation assay) or 30 min (preincubation assay) at 37°C in a 96-well plate in human liver microsomes (0.25 mg/ml) supplemented with NADPH (1 mM) before DFB (500 μM) was added and incubated for an additional 15 min. Incubations were stopped as previously reported (Chauret et al., 1999), and CYP3A activity was measured via the fluorescence of DFH. The potency for CYP3A inhibition (IC50) obtained in this preincubation assay versus the nonpreincubation assay was then compared to evaluate whether the compound was a preincubation-dependent CYP3A inhibitor.
Results
Metabolism of DFB and DFH in Primary Cultured Hepatocytes.Figure 3 shows that the fluorescent signal obtained following incubation of DFB in cultured rat hepatocytes induced with dexamethasone was linear within the first 30 min of incubation. A similar observation was made in human hepatocytes in both vehicle- and rifampicin-treated cultures (Fig. 4). Analysis of the incubates by HPLC/fluorescence indicated that the fluorescent signal corresponded mainly to DFH. A minor fluorescent signal, similar to what had been observed in microsomes (Chauret et al., 1999), could be observed at the HPLC solvent front (data not shown).

Formation of DFH in dexamethasone (0.4, 2, and 10 μM)-treated rat hepatocytes incubated with 60 μM DFB in a 96-well plate format. Error bars indicate standard deviation (n = 4).

Formation of DFH in rifampicin (10 μM)- and vehicle-treated human hepatocytes incubated with DFB (60 μM). Errors bars indicate standard deviation (n = 4).
HPLC analysis of DFB human hepatocyte incubates revealed the presence of an early metabolite that started to become detectable at the 30-min time point (Fig. 5A). When analyzed by LC/MS, the m/z of this new peak corresponded to 176 atomic mass units higher than DFH, consistent with a DFH glucuronide. Further experiments showed that this metabolite had the same retention time and LC/MS characteristics as the glucuronide of DFH prepared according to a standard procedure using human liver microsomes supplemented with UDP-glucuronic acid (Li et al., 2000). In cultured human hepatocytes, incubation of DFH also showed formation of this glucuronide metabolite (Fig. 5B). A stability study of DFH with cultured rat and human hepatocytes at a concentration similar to that formed during typical induction experiments (5 μM) demonstrated that the fluorescence readout was not significantly diminished at early time points (e.g., 20 min), but by 60 min there was an approximately 20% loss of signal.

Typical chromatograms of (A) 60 μM DFB incubated in a rifampicin-treated culture of human hepatocytes for 60 min and (B) 10 μM DFH incubated in a rifampicin-treated culture of human hepatocytes for 60 min.
Evidence for CYP3A-Mediated DFB Debenzylation in Rat. Incubation of DFB with microsomes isolated from cells expressing only CYP3A1 or 3A2 demonstrated that DFB is debenzylated by both CYP3A isoforms [5 and 8 pmol of DFH formed/(picomoles of P450 × minutes) for CYP3A1 and CYP3A2, respectively]. The addition of an anti-rat CYP3A2 inhibitory antibody to the recombinant enzyme incubations resulted in an 80% or greater inhibition of DFB metabolism (Table 1). The CYP3A2 antibody also significantly inhibited DFB debenzylation in rat liver microsomal incubations (95% inhibition).
Inhibition of DFB turnover in recombinant rat CYP3A1 and 3A2 microsomes and in rat liver microsomes by anti-rat CYP3A2 inhibitory antibody
Optimization of Multiwell Assay Conditions. Amounts of DFH formed after a 30-min incubation of DFB with dexamethasone-treated rat hepatocytes cultured in 24- and 96-well plates are shown in Fig. 6. Whereas the dexamethasone-treated cells showed a good florescent signal in cells cultured on both 24- and 96-well plates, formation of DFH in vehicle-treated 96-well plate cultured cells was below the detection limit (∼100 nM). In human hepatocytes, the rates of DFH formation in the rifampicin-treated cells were ∼6-fold higher compared with vehicle-treated cells (Fig. 4). At 30 min, vehicle-treated cells gave a signal above the detection limit.

Formation of DFH in 30-min incubations of control- and dexamethasone-treated (10 μM) rat hepatocytes cultured on 24- or 96-well plates with 60 μM DFB. Error bars indicate standard deviation (n = 4).
Correlation of Human CYP3A Induction Measured by Activity Probes and Western Blot. Human hepatocytes were cultured in 24-well plates and treated with a panel of compounds that differed in their potential to induce CYP3A, including rifampicin, phenytoin, dexamethasone, phenobarbital, and β-naphthoflavone (Pichard et al., 1990). CYP3A protein levels were then assessed by measuring testosterone 6β-hydroxylation, followed by isolation of the cells and measurement of CYP3A levels by Western blot densitometry readings. Figure 7 shows the good correlation obtained (r2 = 0.9908).

Correlation between testosterone 6β-hydroxylation and CYP3A protein levels, as determined by Western blot, in human hepatocytes cultured in 24-well plates and incubated with several prototypical inducers at 10 μM.
Human hepatocytes cultured on 96-well plates were treated with the same panel of inducers. After 48 h, CYP3A activity was assessed by measuring testosterone 6β-hydroxylation, followed by a second probing for DFB debenzylation. A high correlation (r2 = 0.999) was obtained, as shown in Fig. 8.
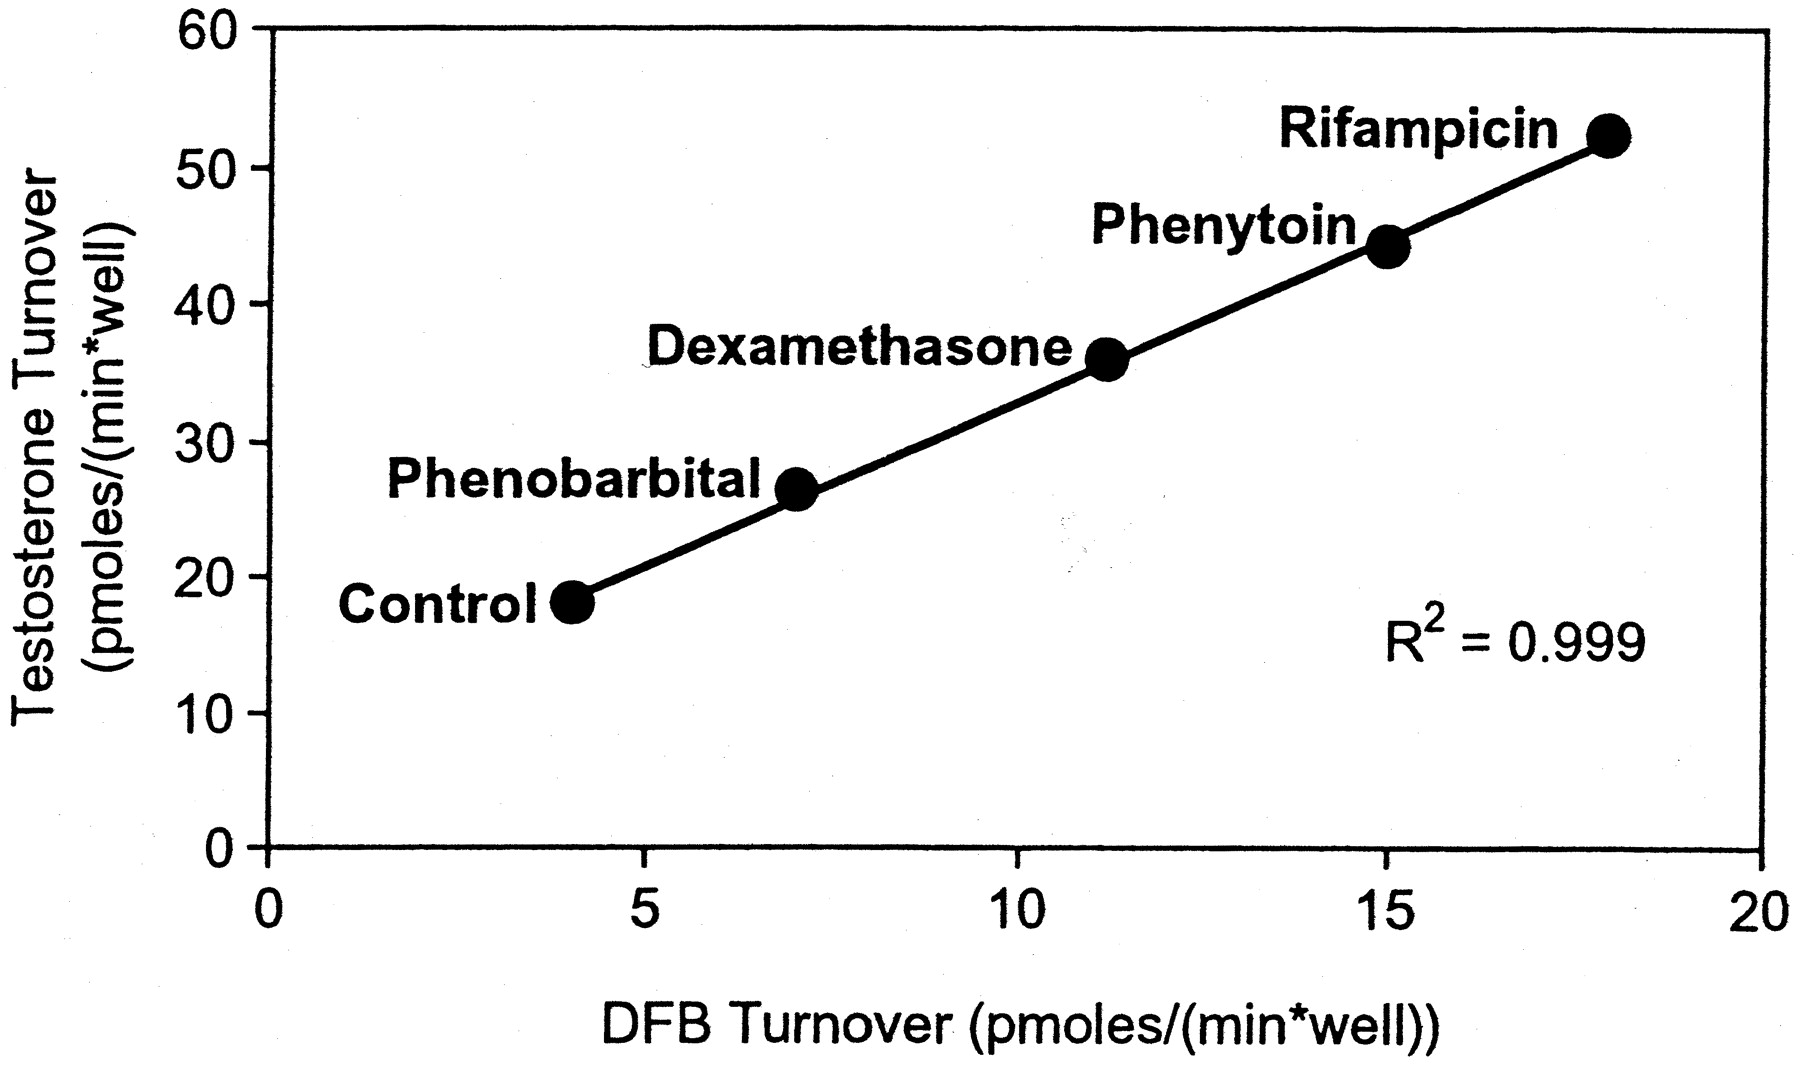
Correlation between testosterone 6β-hydroxylation and DFB debenzylation in human hepatocytes cultured in 96-well plates and treated with several prototypical inducers at 10 μM.
Inhibition of CYP3A Activity by Test Compounds. As shown in Fig. 9, the Western blot from human hepatocytes treated with 10 μM compound 1 demonstrated a marked increase in CYP3A protein over vehicle-treated cells. In contrast, CYP3A activity, as measured by DFH formation, was below that measured in vehicle-treated cells (results not shown). When this compound was incubated for 2 h at 10 μM with rifampicin-treated cells, the formation of DFH in these CYP3A-induced cells was decreased by 91 ± 12% (n = 3). Incubation of compound 1 with human liver microsomes confirmed that it is a preincubation-dependent CYP3A inhibitor with an IC50 of 1.8 μM in the preincubation assay versus an IC50 of >200 μM in the nonpreincubation assay.

Structure of compound 1 and immunoblot analysis of CYP3A protein in human hepatocytes treated with compound 1 (10 μM) compared with vehicle- and rifampicin-treated cells.
Discussion
In this study, we describe the use of a selective fluorogenic probe, designated DFB, for investigating CYP3A induction in hepatocytes. DFB is selectively metabolized by human CYP3A to a fluorescent metabolite, and it is currently used to evaluate CYP3A inhibition by drug candidates in human liver microsomes (Chauret et al., 1999). Previous studies in rat primary cultured hepatocytes with the isopropyl analog of DFB, designated DFP, indicated that this series of COX-2 inhibitors could be used as activity probes for the CYP3A enzyme in hepatocytes (Nicoll-Griffith et al., 2001). The dealkylation of DFP correlated well with testosterone 6β-hydroxylation and Western blot analyses in rat primary cultured hepatocytes treated with the inducer dexamethasone. Unfortunately, the dealkylation of DFP is too slow for quantitative assays (Chauret et al., 1999). In addition, DFP has two sites of oxidation, and the dealkylation involves both CYP3A and CYP1A in humans, making it unsuitable as a selective human CYP3A probe (Silva and Nicoll-Griffith, 2002). The benzyloxy analog DFB is superior to the isopropyl analog DFP. The turnover is higher; consistent with benzylic methylene protons being more prone to abstraction than methine protons. It has only one pathway of oxidation and is selectively metabolized by CYP3A in humans (Chauret et al., 1999).
Incubation of DFB with cultured human and rat hepatocytes resulted in one major metabolite, identified as the fluorescent dealkylated metabolite DFH (Fig. 5A). Phase II metabolism of DFH, such as glucuronidation, was minimal in cultured hepatocytes under the experimental conditions used for induction studies. The absence of significant phase II metabolism is important because such metabolites do not have fluorescent properties. At longer incubation times, this pathway became more detectable and, indeed, when DFH was incubated in cultured hepatocytes, the fluorescence signal was reduced by 20% at 60 min, presumably due to this pathway. Therefore, long incubation times of DFB could lead to an underestimation of the amount of DFH formed from DFB. In a similar assay paradigm using 7-ethoxyresorufin and 7-pentoxyresorufin as probes for CYP1A1 and 2B, respectively, the fluorescent dealkylated metabolite resorufin is formed along with considerable amounts of O-conjugated products, which are not fluorescent (Donato et al., 1993). To hydrolyze the resorufin conjugates to regain the full fluorescent signal, these researchers incubate media samples with β-glucuronidase and arylsulfatase. For DFB, under the assay conditions described herein, such a hydrolysis step is not required.
It has been demonstrated that DFB is selectively metabolized by CYP3A in human liver microsomes (Chauret et al., 1999). To confirm this in human hepatocytes, cross-validation was made with testosterone 6β-hydroxylation since this is a well accepted probe for CYP3A activity in hepatocytes (Kostrubsky et al., 1999; Luo et al., 2002). Kostrubsky et al. (1999) showed that CYP3A activity could be assessed by adding testosterone to intact cells and measuring the formation of 6β-hydroxytestosterone in the extracellular media. We confirmed this by demonstrating a good correlation between 6β-hydroxytestosterone formation and levels of immunoreactive CYP3A protein in human hepatocytes treated with a panel of compounds that differ in their potential to induce CYP3A (Fig. 7). The cells were cultured on 24-well plates to have sufficient protein for Western blot analysis. With this correlation in hand, testosterone 6β-hydroxylase activity was used to compare with DFB debenzylation in the 96-well plate format, with excellent results (Fig. 8).
Previous work with DFP in the rat (Nicoll-Griffith et al., 2001) and DFB in the rabbit (Fradette et al., 2002; Chauret et al., 2003) indicates that these COX-2 inhibitor analogs are satisfactory probes for induction in preclinical animal models. The current study, showing complete inhibition of DFH formation in rat liver microsomes in the presence of a selective CYP3A antibody, provides additional evidence that CYP3A plays the predominant role of DFB debenzylation in rat and thus supports the validity of the rat hepatocyte assay for CYP3A induction.
From experiments described herein and previously reported work with DFB, it was determined that incubations should be conducted with 60 μM DFB (∼2× the Km) for 20 to 30 min. This gives sufficient debenzylation of DFB for a robust fluorescent signal but minimizes the loss of sensitivity caused by further metabolism of DFH. The addition of base (60% acetonitrile in TRIZMA base buffer) is necessary to realize the optimal fluorescence properties of DFH (Chauret et al., 1999).
In agreement with previous findings demonstrating a higher activity of CYP3A in human compared with that in rat hepatocytes (Cheng and Schenkman, 1982), we found that the production of DFH in control cells was considerably less in rat, so much so that it precluded the detection of a fluorescent signal in vehicle-treated rat cells cultured in 96-well plates (Fig. 6). In contrast, rat hepatocytes cultured on 24-well plates metabolized DFB at rates easily measured with a fluorescence plate reader. Thus, optimal conditions involve 24- and 96-well plates for rat and human assays, respectively. Because of the calculation involving subtracting the control baseline value from the drug-treated cells, being able to measure the control cell activity is very important. Under the current experimental conditions, human hepatocytes exposed to rifampicin for 48 h were found to have a corresponding induction in CYP3A activity (∼6-fold increase), as demonstrated by the increase in the production of DFH. Exposure of the rat hepatocytes to dexamethasone resulted in a concomitant increase in DFH production (∼10-fold increase).
A major concern of using an activity assay to determine CYP3A4 induction is the possibility that the compound being investigated also exhibits P450 inhibition properties. An example of such a compound is ritonavir. LeCluyse (2001) reported that ritonavir activates PXR and causes an increase in CYP3A protein levels in human hepatocytes while inhibiting CYP3A activity. Even though the cells are washed to remove test compound from the media and cells prior to probing for P450 activity and therefore reduce the risk for competitive inhibition, mechanism-based inhibitors will still inhibit activity. In addition, highly lipophilic compounds may not be easily washed from the cells. If these compounds are CYP3A inhibitors, they may also give rise to false negative results for CYP3A induction. It is recommended that induction by any compounds that inhibit CYP3A activity should be analyzed by Western blot.
To evaluate the inhibitory properties of drug candidates, several wells serve as controls in the 96-well plate design. The cells in these wells are first treated with rifampicin to maximize the level of CYP3A protein. Then they are exposed to the test compounds for 2 h prior to activity probing. This period will not result in de novo synthesis of P450 protein (Silva et al., 1998). An example of a test compound that exhibited both inhibition and induction is exemplified by compound 1 from our drug discovery program. This compound was a demonstrated preincubation inhibitor in human liver microsomes. The IC50 was 1.8 μM following a 30-min preincubation paradigm compared with >200 μM with no preincubation. Using the 96-well plate design described above, we were able to determine that this compound was a potent CYP3A inducer and preincubation-dependent inhibitor, as evidenced by the marked increase in CYP3A immunoreactive protein shown in Fig. 9 but 91% inhibition of activity (data not shown).
The use of activity probes, such as testosterone or DFB, allows one to monitor CYP3A activity as well as other enzymatic parameters of interest in the same cells over many time points, because the cell culture does not need to be terminated for activity measurement. Ferrini et al. (1997) described culture conditions for maintaining P450-inducible primary human hepatocytes in culture for several weeks. It may therefore be possible to use the same cells to screen for P450 induction with several compounds after appropriate washout periods.
In summary, this study demonstrates that DFB is a selective probe for determining CYP3A activity in rat and human cultured hepatocytes, and experimental protocols are presented for both species. This probe substrate is an attractive alternative to using testosterone, because the analysis of time by fluorescent 96-well plate readout is only 1 min, compared with 32 h for the HPLC/UV method employed herein for quantification of 6β-hydroxytestosterone. Also, the use of a 96-well plate format optimizes the use of precious human hepatocytes, and the ability to reprobe gives the option of assessing multiple enzymes in each well. This assay has been used routinely in our laboratories for several years now and has afforded a rapid and robust methodology for the assessment of CYP3A induction in drug discovery.
Acknowledgments
We thank Dr. Marc Bilodeau (Hôpital St. Luc, Montreal, QC, Canada) and Québec Transplant (Montreal, QC, Canada) for human liver tissue and Dr. Michel Gallant (Medicinal Chemistry, Merck Frosst Centre for Therapeutic Research) for the synthesis of compound 1.
Footnotes
-
↵1 Current address: Preclinical Drug Evaluation, Johnson & Johnson PRD, Raritan, NJ.
-
ABBREVIATIONS: P450, cytochrome P450; PXR, pregnane X receptor; HPLC, high-performance liquid chromatography; MS, mass spectometry; BFC, 7-benzyloxy-4-trifluoromethylcoumarin; COX, cyclooxygenase; DFP, 3-isopropoxy-5,5-dimethyl-4-[4-(methylsulfonyl)phenyl]furan-2(5H)one; DFH, 3-hydroxy-5,5-dimethyl-4-[4-(methylsulfonyl)phenyl]furan-2(5H)-one; DFB, 3-[(3,4-difluorobenzyl)oxy]-5,5-dimethyl-4-[4-(methylsulfonyl)phenyl]furan-2(5H)-one; LC/MS, liquid chromatography/mass spectometry.
- Received March 16, 2004.
- Accepted August 17, 2004.
- The American Society for Pharmacology and Experimental Therapeutics


