


Abstract
Drug metabolism in humans is essentially performed by three cytochrome P450 (P450) families (1 to 3), including 23 isoforms. The expression of these P450s is highly variable, and the rate and nature of the metabolites produced depend on the nature and the concentration of individual isoforms. P450 expression pattern is therefore a necessary tool to evaluate the effects of a given drug on P450 expression, its potential toxicity, and eventual interference with other drugs administered concomitantly. This pattern provides a general outline of the induction/repression effects of drugs leading to further mechanistic studies. A real-time quantitative reverse transcription-polymerase chain reaction (RT-PCR) assay was developed to evaluate the overall P450 expression pattern and measure human CYP1 to CYP3 mRNAs involved in drug metabolism. Our RT-PCR-based P450 mRNA assay enables us to quantify P450s rapidly with high specificity, a single annealing temperature, and low amounts of biological sample. All 23 single assays were validated by assessing the effects (induction or repression) of known inducers (ethanol, 3-methylcholanthrene, rifampicin, dexamethasone, phenobarbital) on P450 expression in human primary hepatocytes. Since this method may be used to determine human P450 expression in any human tissue or cell culture, it is a valuable tool for reliable prediction of drug safety, drug toxicity, and drug-drug interference.
Cytochromes P450 (P450s) metabolize xenobiotics (i.e., low molecular weight molecules such as drugs, smoke compounds, atmospheric pollutants, or food compounds) (Spatzenegger and Jaeger, 1995; Wrighton et al., 1996). P450s belong to a superfamily of enzymes, located on the membrane of the endoplasmic reticulum. They catalyze monooxygenation in the presence of NADPH and molecular oxygen. They are classified in the same family (symbolized by an Arabic number) when their amino acid sequence similarity is greater than 40% and to the same subfamily (symbolized by an upper case letter) when their amino acid sequence similarity is above 55% (http://drnelson.utmem.edu/cytochromeCYP.html, http://www.icgeb.org/∼p450srv/CEP450s.html). Up to now, three main P450 families (1, 2, and 3) have been identified as involved in xenobiotic metabolism and 14 isoforms have been extensively studied (CYP1A1, 1A2, 1B1, 2A6, 2B6, 2C8, 2C9, 2C18, 2C19, 2D6, 2E1, 3A4, 3A5, and 3A7). However, the whole human genome sequence (Lander et al., 2001) has allowed identification of 23 human isoforms in P450 families 1 to 3 (Table 1).
List of the 23 selected P450 genes For each gene, amplicon sizes and locations are indicated.
P450 expression is highly variable due to tissue specificity and to physiopathological, genetic, and environmental factors. The rates at which the xenobiotics are metabolized by P450s and the nature of the metabolites produced partly depend on the nature and concentration of individual P450 isoenzymes. Therefore, P450 expression pattern is a major indicator of how a compound would be metabolized by an organism, tissue, or cell. Furthermore, it is a very valuable tool to evaluate the efficacy/toxicity of a product and to predict drug interference. For instance, intake of rifampicin, an antibiotic inducer of CYP3A4, decreases plasma concentration and efficiency of coadministered drugs metabolized by CYP3A4, such as oral contraceptives, cyclosporine, glucocorticoids, and verapamil, among others (Strayhorn et al., 1997). Conversely, grapefruit juice contains very strong CYP3A4 inhibitors and may enhance the effectiveness of its substrates such as the HIV-protease inhibitor saquinavir by increasing its bioavailability (Kupferschmidt et al., 1998).
Appropriate means for evaluating the expression of such a large panel of P450s are currently lacking. Gene expression can be quantified at the mRNA, protein, or enzyme activity level, yet quantification at the mRNA level offers the best isoform specificity due to the lack of specific antibodies and/or enzymatic activities. An ideal assay should be sensitive, isoform-specific, and fast, and should have a low intra-assay variability. Real-time quantitative RT-PCR, which is far more specific, reproducible, and quantitative than cDNA microarrays, was thus chosen. Indeed, most P450 genes in a subfamily are organized in clusters within the same chromosomal region, and their nucleic sequences show considerable homology. Real-time RT-PCR allows selection of primer pairs that are unique when compared with the sequences of the closely related family member genes. It is important to study these highly homologous genes separately because they frequently code for enzymes with a wide substrate selectivity.
Predicting the ability of a drug to modulate P450 expression at an early stage of its discovery and development may reduce the risk of therapeutic failure and, more importantly, may allow the identification of alternative modulating chemical structures. A better knowledge of the global induction capacity of commercial drugs or environmental xenobiotics may also shed light on adverse drug reactions or drug-drug interference in humans.
In vivo experiments on animals are currently used for proper evaluation of drug effects. However, results from animal experiments cannot be directly extrapolated to humans since animal enzymes and their human counterparts differ in substrate specificity, and the regulation of biotransformation enzymes often differs between animals and humans (Kocarek et al., 1995; Silva et al., 1998; Xie et al., 2000). Consequently, primary cultures of human hepatocytes, known to be responsive to P450 inducers, are frequently used for drug metabolism studies (Li et al., 1997; Silva et al., 1998; Meunier et al., 2000; Gerbal-Chaloin et al., 2001). They contain the appropriate receptors, drug response elements, and transcriptional factors (Honkakoski et al., 2003; Wang and Negishi, 2003; Dickins, 2004).
The aim of our study was to develop a global RT-PCR-based P450 mRNA assay for all the family 1 to 3 human P450s involved in drug metabolism. Our collection of individual P450 mRNA assays yielded P450 quantification with high specificity, high efficiency, the same annealing temperature, and low quantities of biological sample. Moreover, the use of well known P450 inducers in human primary hepatocytes confirmed the relevance of our method.
Materials and Methods
Isolation and Culture of Human Hepatocytes. Human hepatocytes were isolated from surgical waste by the two-step dissociation method (Guguen-Guillouzo and Guillouzo, 1986). Human material corresponded to nontumoral portions of tissue resected for primary or secondary tumors. Human liver samples were used in compliance with National Ethics laws. Hepatocyte viability was assessed by the trypan blue exclusion test. Hepatocytes were seeded in Williams E medium containing Glutamax (Invitrogen, Carlsbad, CA), with 10% (v/v) fetal calf serum (Invitrogen), 100 IU/ml penicillin, 100 μg/ml streptomycin (Invitrogen), 4 μg/ml bovine insulin (Sigma-Aldrich, St Louis, MO) on collagen I-coated 24-well plates at a density of 0.19 million cells per cm2. One day later, the medium was changed and replaced either by a short-term culture medium composed of Williams E medium with added glutamine, 100 IU/ml penicillin, 100 μg/ml streptomycin, 4 μg/ml bovine insulin, 5 × 10⁻⁵ M hydrocortisone hemisuccinate (Sigma-Aldrich), and inducers for subject 1, or by a long-term (LT) culture medium (Ferrini et al., 1997) for subjects 2 and 3. The LT culture medium consists of Williams E medium (Sigma-Aldrich) supplemented with the following reagents: 15.4 μM linoleic acid, 10 mg/l insulin, 1 mg/l glucagon, 200 mg/l bovine serum albumin, 5 mg/l transferrin, 50 μg/l epidermal growth factor, 20 μg/l liver growth factor, 5 μM cyclic AMP, 10 IU/l prolactin, 1.25 μM ethanolamine, 2 mM glutamine, 2g/l glucose, 0.25 mM sodium pyruvate, 0.1 μM dexamethasone (DEXA), 0.1 μM selenium, 100,000 IU/l penicillin/streptomycin, and 0.75 mg/l fungizone.
For long-term culture, cells were maintained in the LT medium for 2 to 4 weeks; renewal of medium occurred every 2 days before addition of inducers. Subject 1 was a male, 74 years old with a hepatocarcinoma, subject 2 a female, 60 years old with a colon cancer with metastasis, and subject 3 a female, 33 years old with a liver steatosis.
Treatment of Cultures. Human hepatocytes were incubated with inducers for 48 h. Ethanol (EtOH) was prepared as an aqueous solution and added directly to cultures at 90 mM final concentration. 3-Methylcholanthrene (3-MC), rifampicin (RIF), DEXA, and phenobarbital (PB) were dissolved in DMSO and added to culture medium to give a final concentration of 2.5 μM, 50 μM, 50 μM, and 2 mM, respectively. DMSO concentration in culture medium was 0.5% (v/v). The medium was renewed every day with fresh inducers.
Isolation and Purification of Total RNA from Cell Cultures. Total RNA was isolated from six wells for each treatment using the RNeasy Midi kit (QIAGEN, Valencia, CA) and RNase-free DNase set (QIAGEN) according to the supplier's recommendations. The amount of RNA was estimated by the absorbance ratio at 260/280 nm. The quality of the RNA samples was determined by electrophoresis through denaturing agarose gels and staining with ethidium bromide. The 18S and 28S ribosomal RNA subunits were visualized under ultraviolet light.
Real-Time RT-PCR.Theoretical Basis. The precise amount of total RNA added to each reaction mix (based on optical density) and its quality (i.e., lack of extensive degradation) are both difficult to assess. We therefore also quantified transcripts of the TBP gene (coding for the TATA box-binding protein, a component of the DNA-binding protein complex TFIID) as the endogenous control (Girault et al., 2002). Each sample was normalized on the basis of its TBP content.
Results, expressed as N-fold differences in P450 gene expression relative to the TBP gene, termed “NCYP,” were determined by the formula: NCYP = 2ΔCtsample, where the ΔCt value of the sample was determined by subtracting the average Ct value (duplicate) of the target gene from the average Ct value (duplicate) of the TBP gene.
The NCYP values of the samples treated by 3-MC, RIF, DEXA, and PB were subsequently normalized such that the NCYP value of the control samples treated by the DMSO (drug vehicle) would equal a value of 1. DMSO- and ethanol-treated samples were normalized likewise such that the NCYP value of the control T sample would equal a value of 1.
NCYP values were determined for samples with a P450 gene Ct lower than 35. Target genes were considered to be detected (but not quantifiable) when the Ct value was between 35 and 38, whereas those with Ct values above 38 were considered undetected, i.e., unexpressed.
As regards the relative expression of P450 mRNAs in human hepatocytes, the amount of each P450 transcript (NCYP) in the three human hepatocyte samples was normalized on the basis of the TBP content and subsequently normalized to a basal mRNA level, i.e., the smallest amount of P450 gene mRNA detectable and quantifiable (P450 gene Ct value = 35; NCYP value = 1). Each NCYP value mean (from the three human hepatocyte controls) was finally normalized such that the sum of the 23 means of the NCYP values was 100%. To ensure the validity of the comparison between the 23 P450 mRNA expressions, efficiency of PCR (E) was checked and ranged from 90 to 100% for the 23 P450 gene RT-PCR assays.
P450 gene mRNA levels were confirmed by using two additional endogenous RNA controls for normalization, i.e., the PPIA gene coding for peptidylprolyl isomerase A (Cyclophilin A) (Pidoux et al., 2004) and the RPLP0 gene coding for ribosomal protein P0 (Bieche et al., 2001).
Primers. We examined the 23 genes encoding all known human cytochromes P450 involved in drug metabolism (families 1, 2, and 3) (Table 1). Primers for these 23 P450 genes were chosen using the computer program Oligo 5.0 (National Biosciences, Plymouth, MN). We conducted BLASTN searches against dbEST, htgs, and nr (the nonredundant set of the GenBank, EMBL, and DDBJ database sequences) to confirm the gene specificity of the nucleotide sequences chosen for the primers, and the absence of DNA polymorphisms. In particular, the primer pairs were selected to be unique relative to the sequences of closely related family member genes or of the corresponding retropseudogenes. Alignment of clustered gene sequences was performed by using the Multalin web server (Corpet, 1988). To avoid amplification of contaminating genomic DNA, one of the two primers spanned an exon-exon junction. For each primer pair, we performed no-template control and no-reverse-transcriptase control (RT-negative) assays, which produced negligible signals (usually >40 in Ct value), suggesting that primer-dimer formation and genomic DNA contamination effects were negligible. Amplicons were between 60 and 140 nucleotides long. Gel electrophoresis was performed to verify the size of the specific amplicons and the absence of additional PCR fragment. Nucleotide primer pairs are available from Biopredic International (Rennes, France) (http://www.biopredic.com).
cDNA Synthesis. RNA was reverse-transcribed in a final volume of 20 μl containing 1× RT buffer (500 μM each dNTP, 3 mM MgCl2, 75 mM KCl, 50 mM Tris-HCl, pH 8.3), 20 units of RNasin ribonuclease inhibitor (Promega, Madison, WI), 10 mM dithiothreitol, 100 units of SuperScript II RNase H–reverse transcriptase (Invitrogen), 3 μM random hexamers (Pfizer Inc., New York, NY), and 1 μg of total RNA. The samples were incubated at 20°C for 10 min and 42°C for 30 min, and reverse transcriptase was inactivated by heating at 99°C for 5 min and cooling at 5°C for 5 min.
PCR Amplification. All PCR reactions were performed using an ABI Prism 7700 sequence detection system (Applied Biosystems, Foster City, CA). PCR was performed using the SYBR Green PCR Core Reagents kit (Applied Biosystems). The thermal cycling conditions comprised an initial denaturation step at 95°C for 10 min and 50 cycles at 95°C for 15 s and 65°C for 1 min.
Statistical Analysis. Statistical significance was tested by the distribution-free Wilcoxon paired t test between untreated cells and DMSO- or EtOH-treated cells and between DMSO-treated cells and 3-MC-, RIF-, DEXA-, or PB-treated cells. The minimal level of significance accepted was <0.05.
Results
Availability of the P450 Primer Kit. The primers and the kit allowing RT-PCR have been developed as a collaborative effort between our laboratories and Biopredic International (Rennes, France) (http://www.biopredic.com).
Validation of P450 Real-Time RT-PCR Assays. To validate P450 real-time PCR assays, standard curves were constructed with 4-fold serially diluted reverse-transcribed RNA pools (prepared by mixing identical amounts of total RNAs obtained from various normal tissues). The reaction efficiency (E), calculated as E = 101/m–1, where m is the slope of the calibration curve, was always higher than 90% for TBP, PPIA, and RPLP0 genes and the 23 P450 genes; for example CYP3A4 efficiency was 97% (Fig. 1). For highly expressed P450s, wide dynamic ranges were obtained with strong linear relationship (r2 ≥ 0.99) (5 orders of magnitude for CYP3A4) (Fig. 1).
Specificity Testing. To gain insight into the PCR specificity of one specific set of oligonucleotides for a given P450 against its clustered homolog(s), specific P450 cDNA clones were used as templates: CYP1A1, 1A2, 1B1, 2A6, 2B6, 2C8, 2C9, 2C18, 2C19, 2D6, 2E1, 3A4, 3A5, and 3A7. All these isoforms have been sequenced and expressed in yeast to study their enzyme activities in previous work performed in our laboratory. Real-time PCRs of one specific P450 were performed using its specifically designed primers as well as primers of the related clustered P450(s) (clusters 7q21, 10q24, 15q24, and 19q13). P450 cDNA clones were diluted to yield a reference Ct value close to 22 with their specific primers. When amplifications were observed with primers of the other clustered P450(s), Ct values were always >10 Ct above the reference Ct value and therefore suitable for individual P450 discrimination. Two cDNA clones, CYP2A13 and CYP3A43, were missing. However, we checked that specific primers used to measure CYP2A13 and CYP3A43 expression were unable to amplify other isoforms in CYP2A (2A6, 2A7) and CYP3A (3A4, 3A5, 3A7) subfamilies, respectively.
Relative Expression of P450 mRNAs in Human Hepatocytes. P450 gene expression was studied in independent human hepatocyte cultures from three donors (Fig. 2). Total RNA was obtained from 1.2 million human hepatocytes for parallel quantification of all P450 isoforms from families 1 to 3. For each culture, P450 mRNA expression was calculated with regard to endogenous control TBP mRNA expression and estimated as percentage of the total P450 mRNA expression. CYP2F1 and CYP2W1 were not detected in any culture (Ct >38), and CYP2A13 and CYP2S1 were detectable but remained below the limit of quantification (35 < Ct >38). Some P450s were expressed at low levels, below 1% (CYP3A43, CYP1A1, CYP1B1, CYP2U1, CYP2A7) or between 1 and 5% (CYP2B6, CYP1A2, CYP2R1, CYP2A6, CYP3A7, CYP2D6, CYP2C19, CYP2J2, CYP2E1). Some isoforms were expressed at relatively high levels, between 5 and 15% (CYP3A5, CYP2C8). The main isoforms expressed in human hepatocytes were CYP3A4, CYP2C9, and CYP2C18.
Effect of Different Treatments on P450 mRNA Expression. The effect of treatments on isoform P450 mRNA expression was expressed as fold-induction compared to untreated cells for DMSO and EtOH treatments (Table 2) and to DMSO-treated cells for 3-MC, RIF, DEXA, and PB treatments (Table 3); DMSO was the vehicle of the inducers. Results presented in these tables are means of these fold-induction factors in three independent human hepatocyte cultures. Figure 3 shows the relative expression of P450 mRNAs in human hepatocytes treated by the different inducers. Similar results were obtained in our study with independent real-time PCR performed from the same RT as well as with RT-PCR performed with total RNA extracted from two independent hepatocyte cultures of the same donor (data not shown). None of these treatments at the used concentrations produced any visible toxic effect (i.e., cell death, loss of adhesion) on hepatocytes, as assessed microscopically.
P450 fold-induction in DMSO- and EtOH-treated human hepatocyte cultures compared to untreated cells
Values are average P450 mRNA induction ratios in response to 48-h treatment of 0.5% (v/v) DMSO and 90 mM EtOH in human hepatocyte cultures. The fold-induction is compared to untreated cells.
P450 fold-induction in drug-induced human hepatocyte cultures compared to DMSO-treated cells
Values are the average P450 mRNA induction ratios in response to 48-h treatment of 2.5 μM 3-MC, 50 μM RIF, 50 μM DEXA, and 2 mM PB in human hepatocyte cultures. The fold-induction is compared to DMSO-treated cells.
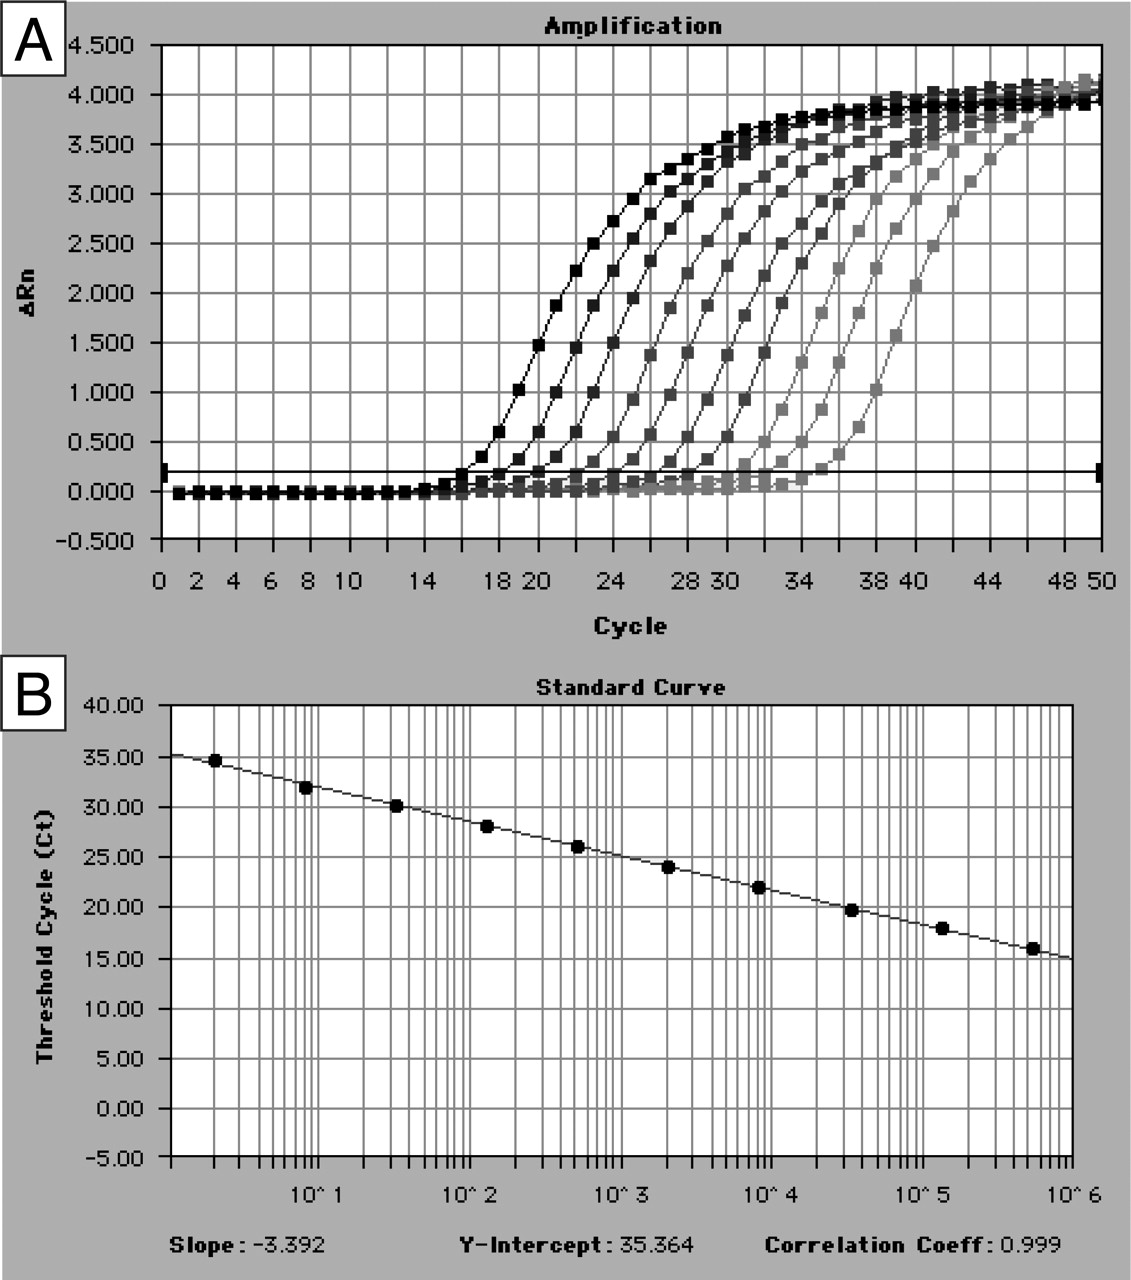
CYP3A4 standard curve obtained by real-time RT-PCR. A, amplification plots for reactions with 10 points from a 4-fold serial dilution of a cDNA from hepatocyte. The cycle number is plotted against changes in the normalized reporter signal (ΔRn). B, standard curve plotting log cDNA copy number (x) against Ct (y) with y =–3.392x + 35.364. Correlation coefficient = 0.999 yielding a PCR efficiency, E = 97%.
DMSO treatment significantly increased CYP2A6, CYP2B6, CYP2C9, CYP2E1, and CYP3A4 isoforms. The only significant effect observed after EtOH treatment was a moderate, but significant, decrease in CYP1B1 expression. 3-MC treatment only increased the CYP1 family expression 442-fold for CYP1A1, 108-fold for CYP1A2, and 47-fold for CYP1B1.
In the CYP3A subfamily, RIF treatment only significantly increased CYP3A4 (15.5-fold) expression. RIF also increased CYP1A1 (5-fold) and CYP2B6 (10-fold) expression, whereas it significantly decreased CYP2E1 expression by 70%. DEXA, at the doses used in this study, was not a major inducer; the expression of only three P450s, CYP1A1, CYP2B6, and CYP3A4, was significantly increased, by a factor 1.5, 3.4, and 2.8, respectively.
In the CYP3A subfamily, only CYP3A4 was increased by a factor of 2.1 after PB treatment. CYP1A1 expression was not modified by PB but CYP1A2 was decreased by 60%. PB treatment significantly increased the expression of CYP2A6 (4.1-fold) and CYP2B6 (8.6-fold), and significantly decreased the expression of CYP2E1 (–90%).
Discussion
In this study, real-time RT-PCR quantification was used to analyze the expression of all P450 isoforms from families 1 to 3 in primary human hepatocytes. The method allows the parallel assessment of multiple P450s in a single extract of total RNA from human hepatocytes.
Primers were selected to fulfill several requirements: identical PCR conditions (including amplification mixes and thermal cycling conditions, in particular, annealing-extension temperatures at 65°C), matching specific regions of each P450, and excluding intronic sequences to minimize the effects of contaminating genomic DNA. Specificity of amplification was checked in subfamilies when several isoforms were present (subfamilies 1A, 2A, 2C, 3A).
So far, several groups have reported P450 mRNA quantification by real-time RT-PCR. However, all the isoforms of P450 families 1 to 3 were not studied as a group, and the RT-PCR assay conditions often varied from one isoform to another. Finally, amplicons were sometimes longer than 300 base pairs, up to 679 base pairs, which is not recommended for a quantitative method (Rodriguez-Antona et al., 2000; Perez et al., 2003).

Relative expression of P450 mRNAs in untreated human hepatocytes. For each culture, P450 mRNA expression was calculated with regard to endogenous control TBP mRNA expression and estimated as percentage of the total P450 mRNA expression. Results presented are means from three independent human hepatocyte cultures.

Effects of 3-MC, RIF, PB, DEXA, and EtOH on relative expression of P450 mRNAs in human hepatocytes. For each treatment, P450 mRNA expression was calculated with regard to endogenous control TBP mRNA expression and estimated as percentage of the total P450 mRNA expression. Results presented are means from three independent human hepatocyte cultures. For each treatment, the relative expression of P450 mRNAs is compared to that of untreated or DMSO-treated cells according to the vehicle used.
Concerning the relative expression of the main P450 mRNAs, and their pattern of induction, our results are, in general, consistent with the available literature (Guengerich and Turvy, 1991; Li et al., 1997; Rodriguez-Antona et al., 2000; Perez et al., 2003). In this paper, additional data are presented on more recently discovered and less studied P450 isoforms.
CYP2W1 (Strausberg et al., 2002) and the lung-specific CYP2F1 (Carr et al., 2003) are not expressed in the liver. CYP2S1 is strongly expressed in skin, trachea, lung, stomach, small intestine, and spleen (Smith et al., 2003) and the respiratory tract-specific CYP2A13 (Su et al., 2000) are barely detectable in human liver.
CYP2U1 highly expressed in human thymus (Strausberg et al., 2002) and the vitamin D25-hydroxylase (CYP2R1) (Cheng et al., 2003) are both expressed at higher levels in liver than the preceding isoforms and comparable to CYP3A43, CYP1A1, CYP1B1, and CYP2A7 (below 1% of total P450).
CYP2J2, expressed primarily in the small intestine and the colon (Zeldin et al., 1997) is detected in the liver at the same level as several other isoforms (1–5% of total P450) (CYP3A7, CYP2C19, CYP1A2, CYP2A6, CYP2B6, CYP2E1, and CYP2D6).
As is already known, CYP3A and CYP2C subfamilies are the major P450s of human liver. Surprisingly, CYP2C18 mRNA is among the main isoforms expressed in the liver. Zaphiropoulos and colleagues (Zaphiropoulos, 1997) showed that CYP2C18 also represented the most abundantly expressed gene of the CYP2C subfamily in human epidermis. However, they demonstrated that this overestimation is due to the presence of various combinations of exons in CYP2C18 RNA transcripts detected in this tissue. Our result could be explained by the location of the CYP2C18-specific amplicon on exons present in different CYP2C18 transcripts. Nevertheless, it is known that CYP2C18, as well as CYP1A1, is not significantly expressed at the protein level in the liver (Gerbal-Chaloin et al., 2001).
As expected, primary cultures of human hepatocytes showed marked sample-to-sample variability in response to P450 enzyme inducers. Although the inducing effect can be generally reproduced from batch to batch, and given that the statistical analysis of the results was only performed in three different cultures, some inducer or repressor effects remain nonsignificant, and it is therefore recommended that the study of induction/repression by a chemical be performed in several preparations of human hepatocytes to minimize the effects of sample intervariability.
Drugs are generally dissolved in water-miscible organic solvents such as DMSO for in vitro induction studies. As previously shown, DMSO (0.5% v/v) increases CYP3A4, CYP2A6, and CYP2E1 (LeCluyse et al., 2000; Nishimura et al., 2003) but also CYP2C9 and CYP2B6 mRNA. Su and Waxman (2004) showed, in rat hepatocytes, that DMSO enhanced expression of nuclear receptors involved in the regulation of several P450s (constitutive androstane receptor and pregnane X receptor) and largely restored hepatic level transcription factors such as hepatic nuclear factor 4 and CCAAT/enhancer-binding protein α; if this is also true in humans, it may explain the increase in basal P450 expression due to DMSO.
EtOH had no inducing effect on any studied P450. At this concentration, the only reported inducing effect of EtOH on CYP2E1 expression has been demonstrated to result either from protein stabilization or increased protein translation (Koop and Tierney, 1990).
Consistent with previous reports, exposure of human cultured hepatocytes to 3-MC resulted in a significant increase in CYP1A1, 1A2, and 1B1 mRNA (Donato et al., 1995; McFadyen et al., 2003).
RIF administration caused an induction of CYP2B6 comparable to that of PB but, as previously shown (Raucy et al., 2002), RIF enhanced CYP3A4 mRNA more than PB treatment did. The similar response of CYP3A4 and CYP2B6 to PB, RIF, and DEXA is consistent with their coregulation through the trans-acting regulatory proteins pregnane X receptor and/or constitutive androstane receptor (Lehmann et al., 1998; Synold et al., 2001). Moreover, as shown in Table 3, in humans, CYP3A4 is inducible by numerous drugs, whereas CYP3A5, CYP3A7, and CYP3A43 are usually not (Schuetz et al., 1993).
PB is not a potent inducer of CYP2C genes, and large concentrations of this compound are required to produce significant induction (Lehmann et al., 1998; Gerbal-Chaloin et al., 2001). It is noteworthy that 14 of the 23 P450s showed no variation of their expression in human hepatocyte cultures treated with six different classical inducers.
This method could be used to quantify P450 expression in human cell cultures from different tissues treated by drugs to be tested. Measurement of P450 expression in biopsies from normal or damaged tissues could allow better drug therapy. It has been recently shown that CYP2S1 expression was significantly higher in lesional psoriatic skin than in adjacent nonlesional skin (Smith et al., 2003). Given that CYP2S1 metabolizes all-trans retinoic acid, a topical drug used to treat psoriasis, and is induced by UV radiation and by all-trans retinoic acid, CYP2S1 seems to play a functional role in the photochemotherapy of this disease. Finally, several novel repressor effects of the different treatments were revealed by this method (i.e., CYP2E1 with RIF and PB and CYP1A2 with PB), which had never been observed in human hepatocytes.
In conclusion, real-time RT-PCR was applied to the investigation of multiple P450 expression in human hepatocyte cultures (CYP1 to CYP3 families). This method allows the quantification of P450 mRNA with great sensitivity and determination of changes in mRNA expression (induction or repression) with known inducers. Although mRNA level and induction do not necessarily reflect active protein concentration, it is much more specific and can be used efficiently as a first approach to study P450 expression in human tissue. Because 96- or 384-well plates are used, several hundred RT-PCR reactions can be performed daily, allowing high throughput screening of large chemical series. In addition, parallel analysis of multiple mRNA species in the same total RNA extract reduces intrasample variation, lowers hepatocyte usage, and permits the profiling of families of genes. From the variations observed in P450 mRNA expression after drug treatment, the identification of the molecular mechanisms involved may lead to a better knowledge of the induction and/or repression processes.
Footnotes
-
This work was supported by the Institut National de la Santé et de la Recherche Médicale, the University Paris 5 René Descartes, the Ligue Nationale contre le Cancer and its Comité Régional des Hauts-de-Seine, and the Association de Recherches contre le Cancer.
-
Article, publication date, and citation information can be found at http://dmd.aspetjournals.org.
-
doi:10.1124/dmd.105.005173.
-
ABBREVIATIONS: P450, cytochrome P450; RT-PCR, reverse transcriptase-polymerase chain reaction; LT, long-term; EtOH, ethanol; 3-MC, 3-methylcholanthrene; RIF, rifampicin; DEXA, dexamethasone; PB, phenobarbital; DMSO, dimethyl sulfoxide; TBP, TATA box-binding protein; NCYP, N-fold differences in P450 gene expression relative to the TBP gene; PPIA, peptidylprolyl isomerase A; RPLP0, ribosomal protein P0.
- Received April 13, 2005.
- Accepted August 15, 2005.
- The American Society for Pharmacology and Experimental Therapeutics


