


Abstract
Pyrethroids are neurotoxic pesticides whose pharmacokinetic behavior plays a role in their potency. This study examined the elimination of esfenvalerate and deltamethrin from rat and human liver microsomes. A parent depletion approach in the presence and absence of NADPH was used to assess species differences in biotransformation pathways, rates of elimination, and intrinsic hepatic clearance. Esfenvalerate was eliminated primarily via NADPH-dependent oxidative metabolism in both rat and human liver microsomes. The intrinsic hepatic clearance (CLINT) of esfenvalerate was estimated to be 3-fold greater in rodents than in humans on a per kilogram body weight basis. Deltamethrin was also eliminated primarily via NADPH-dependent oxidative metabolism in rat liver microsomes; however, in human liver microsomes, deltamethrin was eliminated almost entirely via NADPH-independent hydrolytic metabolism. The CLINT for deltamethrin was estimated to be 2-fold more rapid in humans than in rats on a per kilogram body weight basis. Metabolism by purified rat and human carboxylesterases (CEs) were used to further examine the species differences in hydrolysis of deltamethrin and esfenvalerate. Results of CE metabolism revealed that human carboxylesterase 1 (hCE-1) was markedly more active toward deltamethrin than the class 1 rat CEs hydrolase A and B and the class 2 human CE (hCE-2); however, hydrolase A metabolized esfenvalerate 2-fold faster than hCE-1, whereas hydrolase B and hCE-1 hydrolyzed esfenvalerate at equal rates. These studies demonstrate a significant species difference in the in vitro pathways of biotransformation of deltamethrin in rat and human liver microsomes, which is due in part to differences in the intrinsic activities of rat and human carboxylestersases.
Pyrethroids are synthetic analogs of the natural pyrethrins, the insecticidal components of extracts from the pyrethrum flower (Chrysanthemum cinerariaefolium). The pyrethroids modulate nerve axon sodium channels, resulting in neurotoxic effects (Narahashi, 1985; Smith et al., 1997). The adverse effects produced by pyrethroids due to the parent compounds in that no evidence currently exists pyrethroid metabolites alter sodium channels and are neurotoxic. the limited number of pyrethroids evaluated, the brain concentrations of pesticide appear to correlate with acute neurotoxicity (White et 1976; Rickard and Brodie, 1985). Pharmacokinetic parameters, ticularly clearance of the parent chemical from the blood, will ence the effective concentration in the brain and therefore can have significant influence on their toxic potency.
The metabolic pathway and rate of phase I biotransformation pyrethroids are dependent upon their chemical structure and stereo-chemistry (Ueda et al., 1975; Soderlund and Casida, 1977; Shono al, 1979). In laboratory animals, different metabolic pathways erentially transform cis- and trans-isomers of pyrethroids; trans isomers are typically transformed by the more rapid hydrolytic ways, whereas cis-isomers are preferentially transformed by slower oxidative pathways (Soderlund and Casida, 1977; Shono et al, 1979). This difference correlates with the greater toxicity of several cis-isomers of individual pyrethroids (Soderlund et al., 2002). For example, cismethrin is approximately 50 times more acutely toxic in mice than its trans-isomer, bioresmethrin, based on administered dose. This is due in part to the approximately 10-fold greater rate of metabolism of bioresmethrin than cismethrin (Abernathy and Casida, 1973).

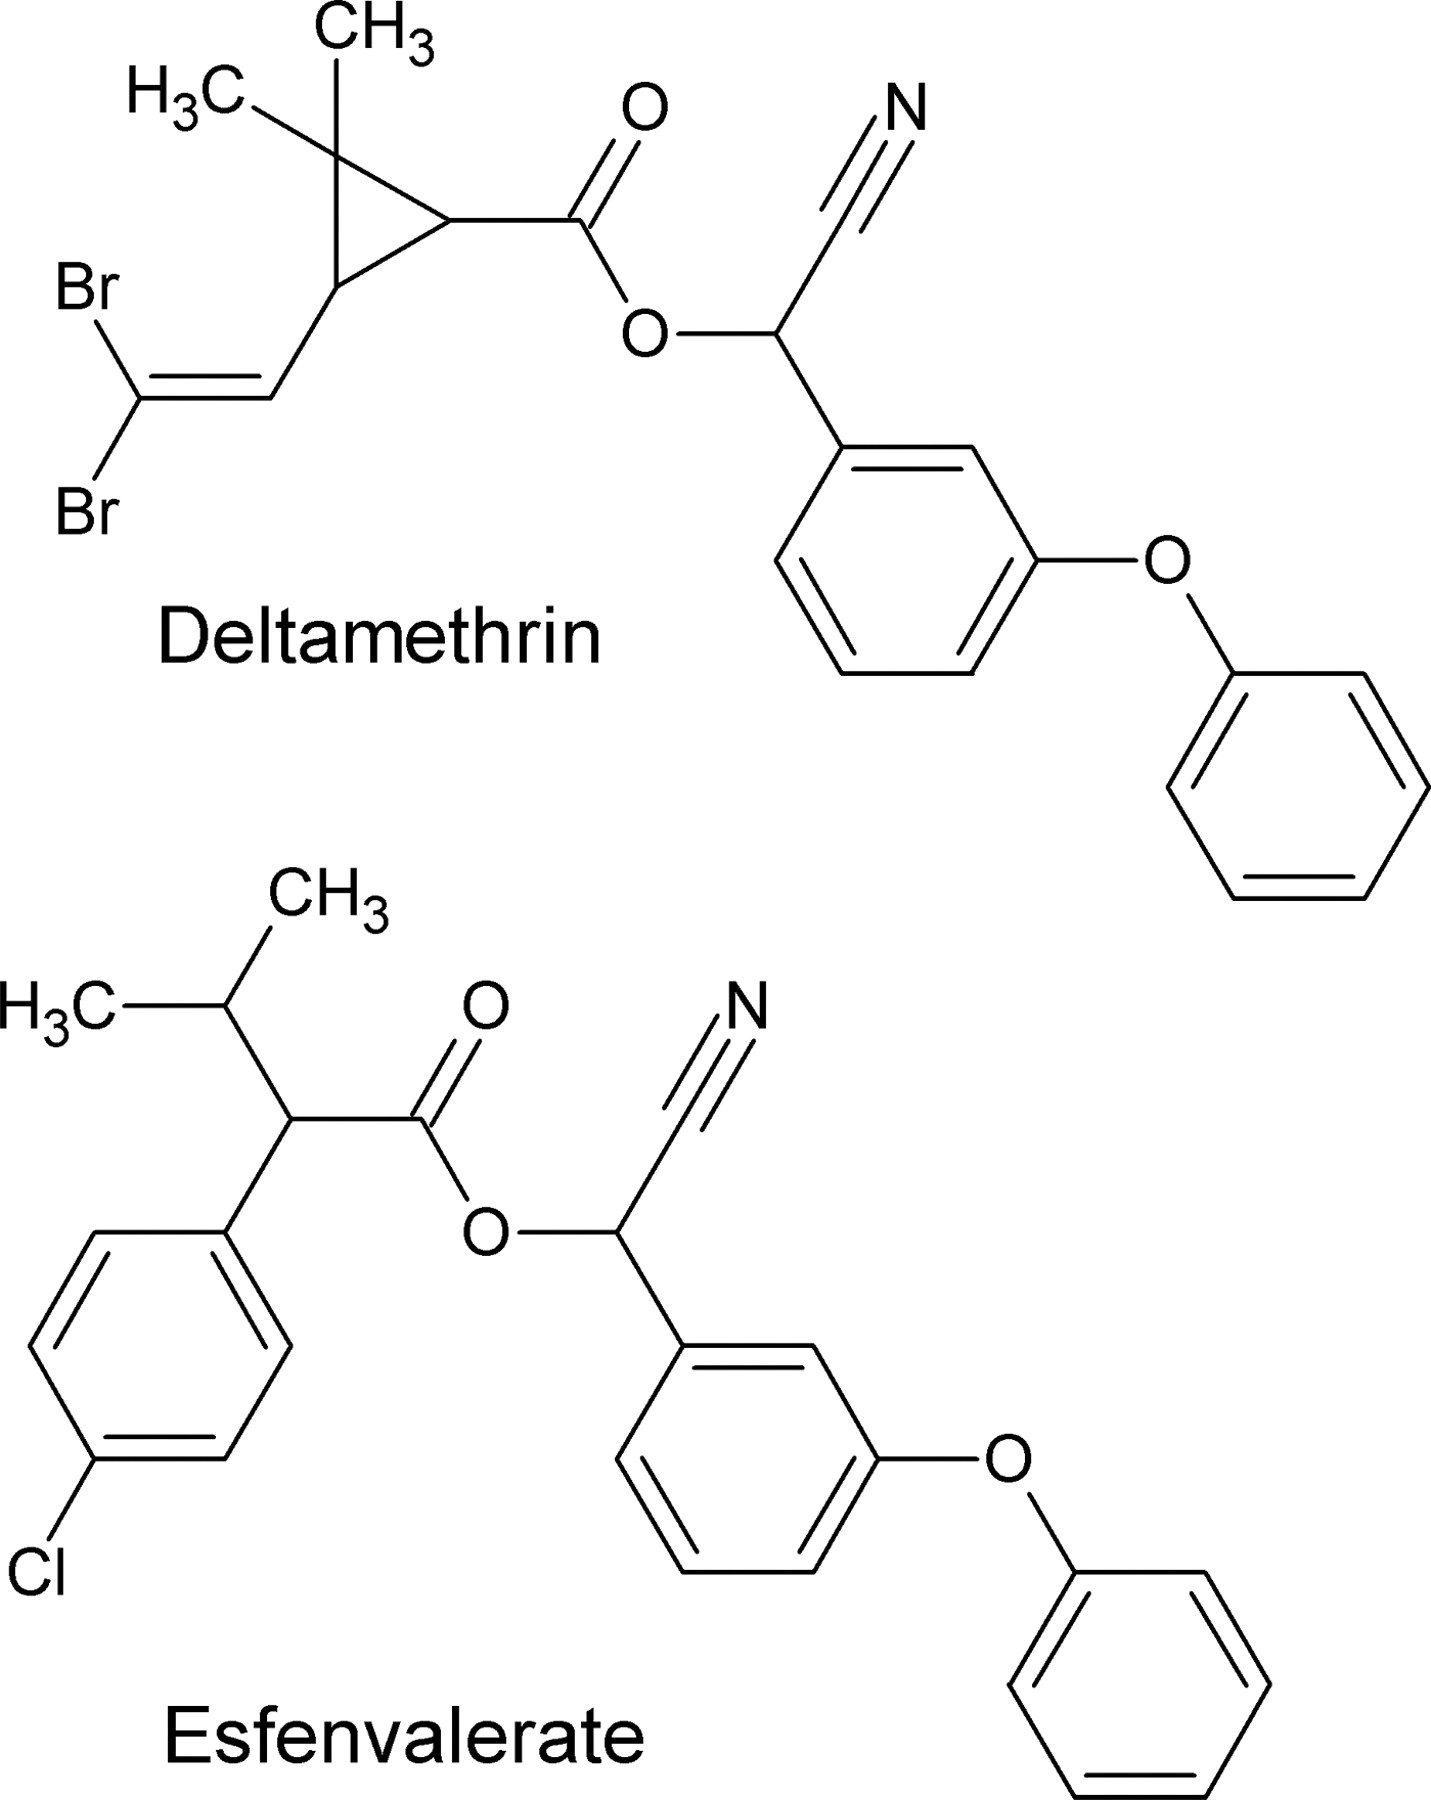
Structures of the pyrethroid pesticides deltamethrin and esfenvalerate.
Species differences in the contributions of hydrolytic and oxidative pathways to the metabolism of pyrethroids exist between mice and rats (Soderlund and Casida, 1977; Shono et al., 1979). For example, trans-permethrin is metabolized predominantly by hydrolytic metabolism in rats. In contrast, both oxidative and hydrolytic pathways contribute to trans-permethrin metabolism in mice (Soderlund and Casida, 1977; Shono et al., 1979). For cis-permethrin, oxidative metabolism is 3- and 8-fold greater than hydrolysis in rats and mice, respectively (Shono et al., 1979). Whereas there are numerous studies that have examined laboratory animal metabolism of pyrethroids, there are relatively few examples of human metabolism of pyrethroids (Choi et al., 2002; Nishi et al., 2006; Ross et al., 2006). In these studies, the extensive hydrolysis of trans-permethrin in rat and mouse liver microsomes (Soderlund and Casida, 1977; Shono et al., 1979) and by mouse carboxylesterases (Stok et al., 2004) was also evident in human liver microsomes (Choi et al., 2002; Ross et al., 2006). For cis-permethrin, however, Choi et al. (2002) reported that there was no detectable oxidative or hydrolytic metabolism in human liver fractions. Ross et al. (2006) observed limited hydrolysis of cis-permethrin in human liver microsomes compared with rat liver microsomes. Ross et al. (2006) and Nishi et al. (2006) also reported limited hydrolysis of cis-permethrin by purified human carboxylesterases. These results with cis-permethrin show that species differences in pyrethroid metabolism may exist between laboratory animals and humans. Differences in pathways or rates of metabolism of pyrethroids between species could lead to altered systemic bioavailability, exposure-dose relationships, and toxic potency for a pyrethroid.
The present study examines the potential for species differences in the phase I biotransformation of two pyrethroids, deltamethrin and esfenvalerate (Fig. 1). Rat and human liver microsomes were used to compare the contribution of oxidative and hydrolytic pathways of metabolism between species. These two pathways are the primary known mechanisms of pyrethroid detoxification; no evidence exists that conjugative or reductive mechanisms of parent pyrethroid are involved. In laboratory animals, there are numerous metabolites (Roberts and Hutson, 1999) of deltamethrin and esfenvalerate, probably produced by a number of enzymes including multiple cytochromes P450 (Dayal et al., 2003; Anand et al., 2006) and esterases (Nishi et al., 2006; Ross et al., 2006). Therefore, liver microsomes represent a simple method of comparing the phase I detoxification step in pyrethroid metabolism between species. Since phase I biotransformation of a pyrethroid is the detoxification step, it allows the use of the parent depletion approach to examine hepatic elimination and estimate intrinsic clearance (Obach, 1999). For the purposes of this article, the term elimination is synonymous with metabolism or biotransformation. Based on results obtained with liver microsomes, purified enzyme preparations of rat and human carboxylesterases were also used in this research to better understand observed differences in rat and human metabolism of these two pyrethroids.
Materials and Methods
Chemicals. Deltamethrin (98.9% purity) [(S)-α-cyano-3-phenoxybenzyl (1R)-cis-3-(2,2-dibromovinyl)-2,2-dimethylcyclopropane carboxylate] was a gift from Bayer Crop Sciences (Research Triangle Park, NC). Esfenvalerate (98.6% purity) [cyano-3-phenoxybenzyl (αS)-2-(4-chlorophenyl)-3-methylbutyrate] was a gift from DuPont (Johnston, IA). These chemicals were used in the microsomal elimination studies. Bifenthrin and tetraethylpyrophosphate (TEPP) were obtained from ChemService Inc. (West Chester, PA). Deltamethrin (>98%) and esfenvalerate (>98%), used for the in vitro carboxylesterase kinetics studies, were obtained from ChemService Inc. Liquid chromatography/mass spectrometry analysis of pyrethroids from the different sources did not reveal any differences in their chemical composition. Chromasolv acetonitrile and methanol for liquid chromatography/mass spectrometry applications were obtained from Riedel-de Haën (Seelze, Germany). Ammonium formate, sucrose, EDTA, KCl, NaHepes, glycerol, dithiothreitol, Trizma-base, β-nicotinamide adenine dinucleotide phosphate reduced form (NADPH), and 3-phenoxybenzaldehyde were purchased from Sigma-Aldrich (St. Louis, MO). Unless otherwise specified chemicals were of the highest grade commercially available.
Animals. All animal procedures were approved by the U.S. Environmental Protection Agency, National Health and Environmental Effects Research Laboratory, Institutional Animal Care and Use Committee. Male Long-Evans rats (70 days old) were obtained from Charles River Laboratories (Raleigh, NC). Animals were allowed to acclimate for a minimum of 4 days in an Association for Assessment and Accreditation of Laboratory Animal Care-approved animal facility before their use. Two animals were housed per plastic cage (45 cm × 24 cm × 20 cm) with heat-treated pine shavings bedding. Animals were maintained at 21 ± 2°C, 50 ± 10% humidity, and a 12-h light/dark photoperiod (6:00 AM to 6:00 PM). Feed (Purina Rodent Chow 5001; Barnes Supply Co., Durham, NC) and tap water were provided ad libitum.
Rat Liver Microsomal Preparation. Animals were anesthetized with CO2 and sacrificed via cardiac puncture. Livers were removed for microsomal preparation according to the method described by DeVito et al. (1996). Three separate pools of rat liver microsomes were prepared. Each pool was prepared from the livers of two rats. From each pool of microsomes, 1.0-ml aliquots were flash-frozen in liquid nitrogen and stored at –80°C until use. Microsomal protein (MSP) content was quantified using the Bio-Rad Bradford protein assay (Bio-Rad, Hercules, CA) standardized with bovine serum albumin.
Human Microsomes. Pooled human liver microsomes were purchased from CellzDirect (Phoenix, AZ; lot number HMMC-PL020), Cedra (Austin, TX; lot number 821-1), and Xenotech (Lenexa, KS; lot number 0310241). These microsomes were stored at –80°C until use.
Determination ofKm Apparent (Km,app) in Rat and Human Liver Microsomes. To ensure that the elimination assays (see below) were performed at concentrations ≪Km,app, estimates of the Km,app for deltamethrin and esfenvalerate elimination in rat and human liver microsomes were determined using a single microsomal sample from each species. The reaction volume was 1.5 ml and consisted of 0.1 M Tris (pH 7.4), 1.0 mg of MSP/ml, and 1.0 mg of NADPH/ml. After preincubation for 10 min at 37°C, the reaction was initiated by the addition of 60 μl of working stock solutions of deltamethrin or esfenvalerate dissolved in 50% acetonitrile solution to obtain final assay concentrations of 1, 2, 5, 7, 10, 20, and 50 μM pyrethroid. Pilot studies demonstrated that this percentage of acetonitrile did not to interfere with oxidative or hydrolytic metabolism in these assays (data not shown). Assays were carried out in duplicate in a shaking water bath, and 250-μl aliquots of the reaction mixture were removed from the reaction vial at 0, 2.5, 5.0, 7.5, and 10.0 min. These time points were previously found to be in a linear range of elimination of deltamethrin and esfenvalerate (data not shown). Aliquots were immediately placed in 1.25-ml cold 50% acetonitrile containing 0.1 mg/ml bifenthrin (internal surrogate of recovery) to stop the reaction. Samples were vortexed for 5 min and centrifuged at approximately 1500g for 10 min. The supernatant was removed and placed in autosampler vials for liquid chromatography/tandem mass spectrometry analyses (see below). Nonenzymatic controls were performed in the Tris buffer in the absence of microsomal protein to ensure that all elimination of chemical was enzymatic. Concentration of substrate was monitored over the time course and converted to moles of substrate remaining. Substrate remaining was converted to product formed and plotted versus time to produce a reaction velocity. Km,app values in rat and human liver microsomes were estimated for deltamethrin with Lineweaver-Burk linear regression analysis from GraphPad Prism (v 4.0; GraphPad Software, San Diego CA). The 50 μM reactions appear to be approaching maximal elimination rates. However, because a clear maximum was not defined, a Lineweaver-Burk analysis was used for deltamethrin analysis. The Km,app values in rat and human microsomes for esfenvalerate were estimated with GraphPad Prism software using Michaelis-Menten nonlinear regression analysis.
Rat and Human Microsomal Elimination Assays. Microsomal elimination assays with deltamethrin and esfenvalerate were carried out using the parent depletion approach described above. In brief, 1 μM pyrethroid was found from kinetic studies to be below the Km,app for both deltamethrin and esfenvalerate elimination from both rat and human liver microsomes. Pyrethroid (1 μM) was incubated from 0 to 10 min in 1.5 ml of 0.1 M Tris containing 1.0 mg of MSP/ml and 1.0 mg of NADPH/ml. NADPH-independent assays were carried out from 0 to 30 min to ensure sufficient elimination to calculate elimination rates. Assays were carried out in duplicate in a shaking water bath at 37°C and 250-μl aliquots were removed at each time point for liquid chromatography/tandem mass spectrometry analysis. Assays were repeated in the presence of 200 μM TEPP to inhibit esterase activity (Soderlund and Casida, 1977). A volume of 10 μl of 30 mM TEPP in methanol was added to the assay before incubating for 10 min at 37°C before the addition of pyrethroid.
Identification, Recovery, and Quantification of Deltamethrin and Esfenvalerate. An Agilent (Palo Alto, CA) 1100 series LC/MSD VL ion trap mass spectrometer and HP Chemstation software were used for identification and quantification of pyrethroid parent chemicals. Isocratic elution of chemicals was accomplished with an Agilent Zorbax Eclipse XDB C18 column (4.6 × 100 mm, 3.5-μm pore size) and XDB C-18 guard column with a mobile phase of 90% methanol and 10% 5 mM ammonium formate at a flow rate of 0.5 ml/min. Deltamethrin identification and quantitation were accomplished by fragmentation of the ammonium-adducted ion [M + NH4]+ (m/z 523) to produce the parent ion [M + H]+ (m/z 506). Esfenvalerate identification and quantitation were accomplished via the ammonium-adducted ion [M + NH4]+ (m/z 437). Bifenthrin was identified and quantified using the ammonium-adduced ion [M + NH4]+ (m/z 440). Recovery of deltamethrin and esfenvalerate from microsomal assays was assessed at all concentrations used in standard curves (0.1, 0.5, 1, 2, 5, 7, 10, 20, and 50 μM) and compared with an equivalent concentration in the absence of microsomal protein. Recovery was found to be greater than 95% at all concentrations. Precision of points on standard curves were calculated to be within 5% of standards in buffer. Quantification was accomplished using the peak area ratios of the analyte and internal surrogate. Standard curves were developed from standards in the reaction buffer containing microsomal protein. Standard curves were linear over the range of concentrations used in the experiments with r2 values of at least 0.99. Accuracy limits of 20% were used for inclusion in standard curves by the Agilent Chemstation software.
Calculation of Elimination Rates, Elimination Rate Constants, and Intrinsic Hepatic Clearance Rates. Elimination rate, elimination rate constants, and estimates of intrinsic hepatic clearance of deltamethrin and esfenvalerate were determined from the elimination of parent chemical from the microsomal assay at a single concentration (1 μM) over a time course of 0 to 10 min. The concentration of the parent chemical was measured at each time point and converted to moles of substrate remaining. Calculation of elimination rates was accomplished by linear regression of substrate remaining versus time plots. First order elimination rate constants (k) were determined from the plot of the ln of the percentage remaining versus time, where the slope of the linear regression line = k (min–1). The 1 μM concentration was found to be below the Km,app for each chemical in both rat and human liver microsomes (Table 1). At substrate concentrations significantly below Km, the clearance of a chemical is constant (Iwatsubo et al., 1997) and can be calculated using the first order elimination rate constant, k (Obach, 1999). Intrinsic clearance (CLINT), on a per kilogram body weight basis, was estimated based on the following equation (Obach et al., 1997; Obach, 1999): CLINT = k (min–1) · ml incubation/mg microsomes · mg microsomes/g liver · g liver/kg body weight.
Km,app and scaled CLINT values for deltamethrin and esfenvalerate in rats and humans
Data are mean ± S.D. (n = 3).
It was assumed that humans and rats have 40 and 25.7 g of liver per kg body weight, respectively (Davies and Morris, 1993). Microsomal content of the livers was assumed to be 52.5 and 45 mg of microsomal protein per g of liver for humans (Iwatsubo et al., 1997) and rats (Houston, 1994), respectively.
Human and Rat Carboxylesterases. The recombinant carboxylesterases, human CE-1 (hCE-1) and CE-2 (hCE-2), were expressed in a Spodoptera frugiperda-derived cell line using baculovirus and purified to homogeneity as described previously (Morton and Potter, 2000). Rat CEs, termed hydrolases A and B (Morgan et al., 1994), were purified to homogeneity from male Sprague-Dawley rat liver by the procedure of Sanghani et al. (2002) with slight modification. This entailed removal of an 80-kDa impurity present in hydrolase A by anion exchange chromatography. The purified rat CEs were digested with trypsin and analyzed by matrix-assisted laser desorption ionization/time of flight mass spectrometry. The proteins were shown to be identical to rat hydrolase A (also termed ES-10) and hydrolase B (termed RL1) (Morgan et al., 1994).
Hydrolysis Reactions Catalyzed by CEs. Hydrolysis of deltamethrin and esfenvalerate by rat and human CEs were performed at a single saturating concentration of pyrethroid (50 μM) to compare the hydrolysis rates of each enzyme (specific activity). Kinetic experiments with deltamethrin were also performed to obtain kcat, Km, and kcat/Km parameters for each CE; these parameters were not obtained for esfenvalerate in this study. Hydrolysis of pyrethroids by rat and human CEs was performed in reaction volumes of 100 μl as described previously (Ross et al., 2006). In the kinetic experiments, varying amounts of deltamethrin (5–100 μM, final concentration) were pre-incubated for 5 min in 50 mM Tris-HCl buffer (pH 7.4) at 37°C. The hydrolytic reactions were initiated by addition of the CE enzyme (2.5 μg per 100-μl reaction), and the reaction was allowed to proceed for 30 min at 37°C. The reactions were quenched by the addition of an equal volume of ice-cold acetonitrile. The samples were centrifuged for 5 min at 13,200g (4°C), and an aliquot was analyzed by HPLC to quantify the hydrolysis products. Nonenzymatic reactions were also performed (i.e., no CE enzyme was added to the buffer/pyrethroid mixture) and found to have negligible rates (data not shown). Specific activity reactions of each CE with deltamethrin and esfenvalerate were performed in the same manner as above, except that a single pyrethroid concentration of 50 μM was used. Substrate concentration-velocity reactions and specific activity reaction were performed by repetitive assays (n = 3 independent experiments). The pyrethroids were added to reaction mixtures from stock solution prepared with acetonitrile, and the organic solvent content in the reactions was kept <1% v/v.
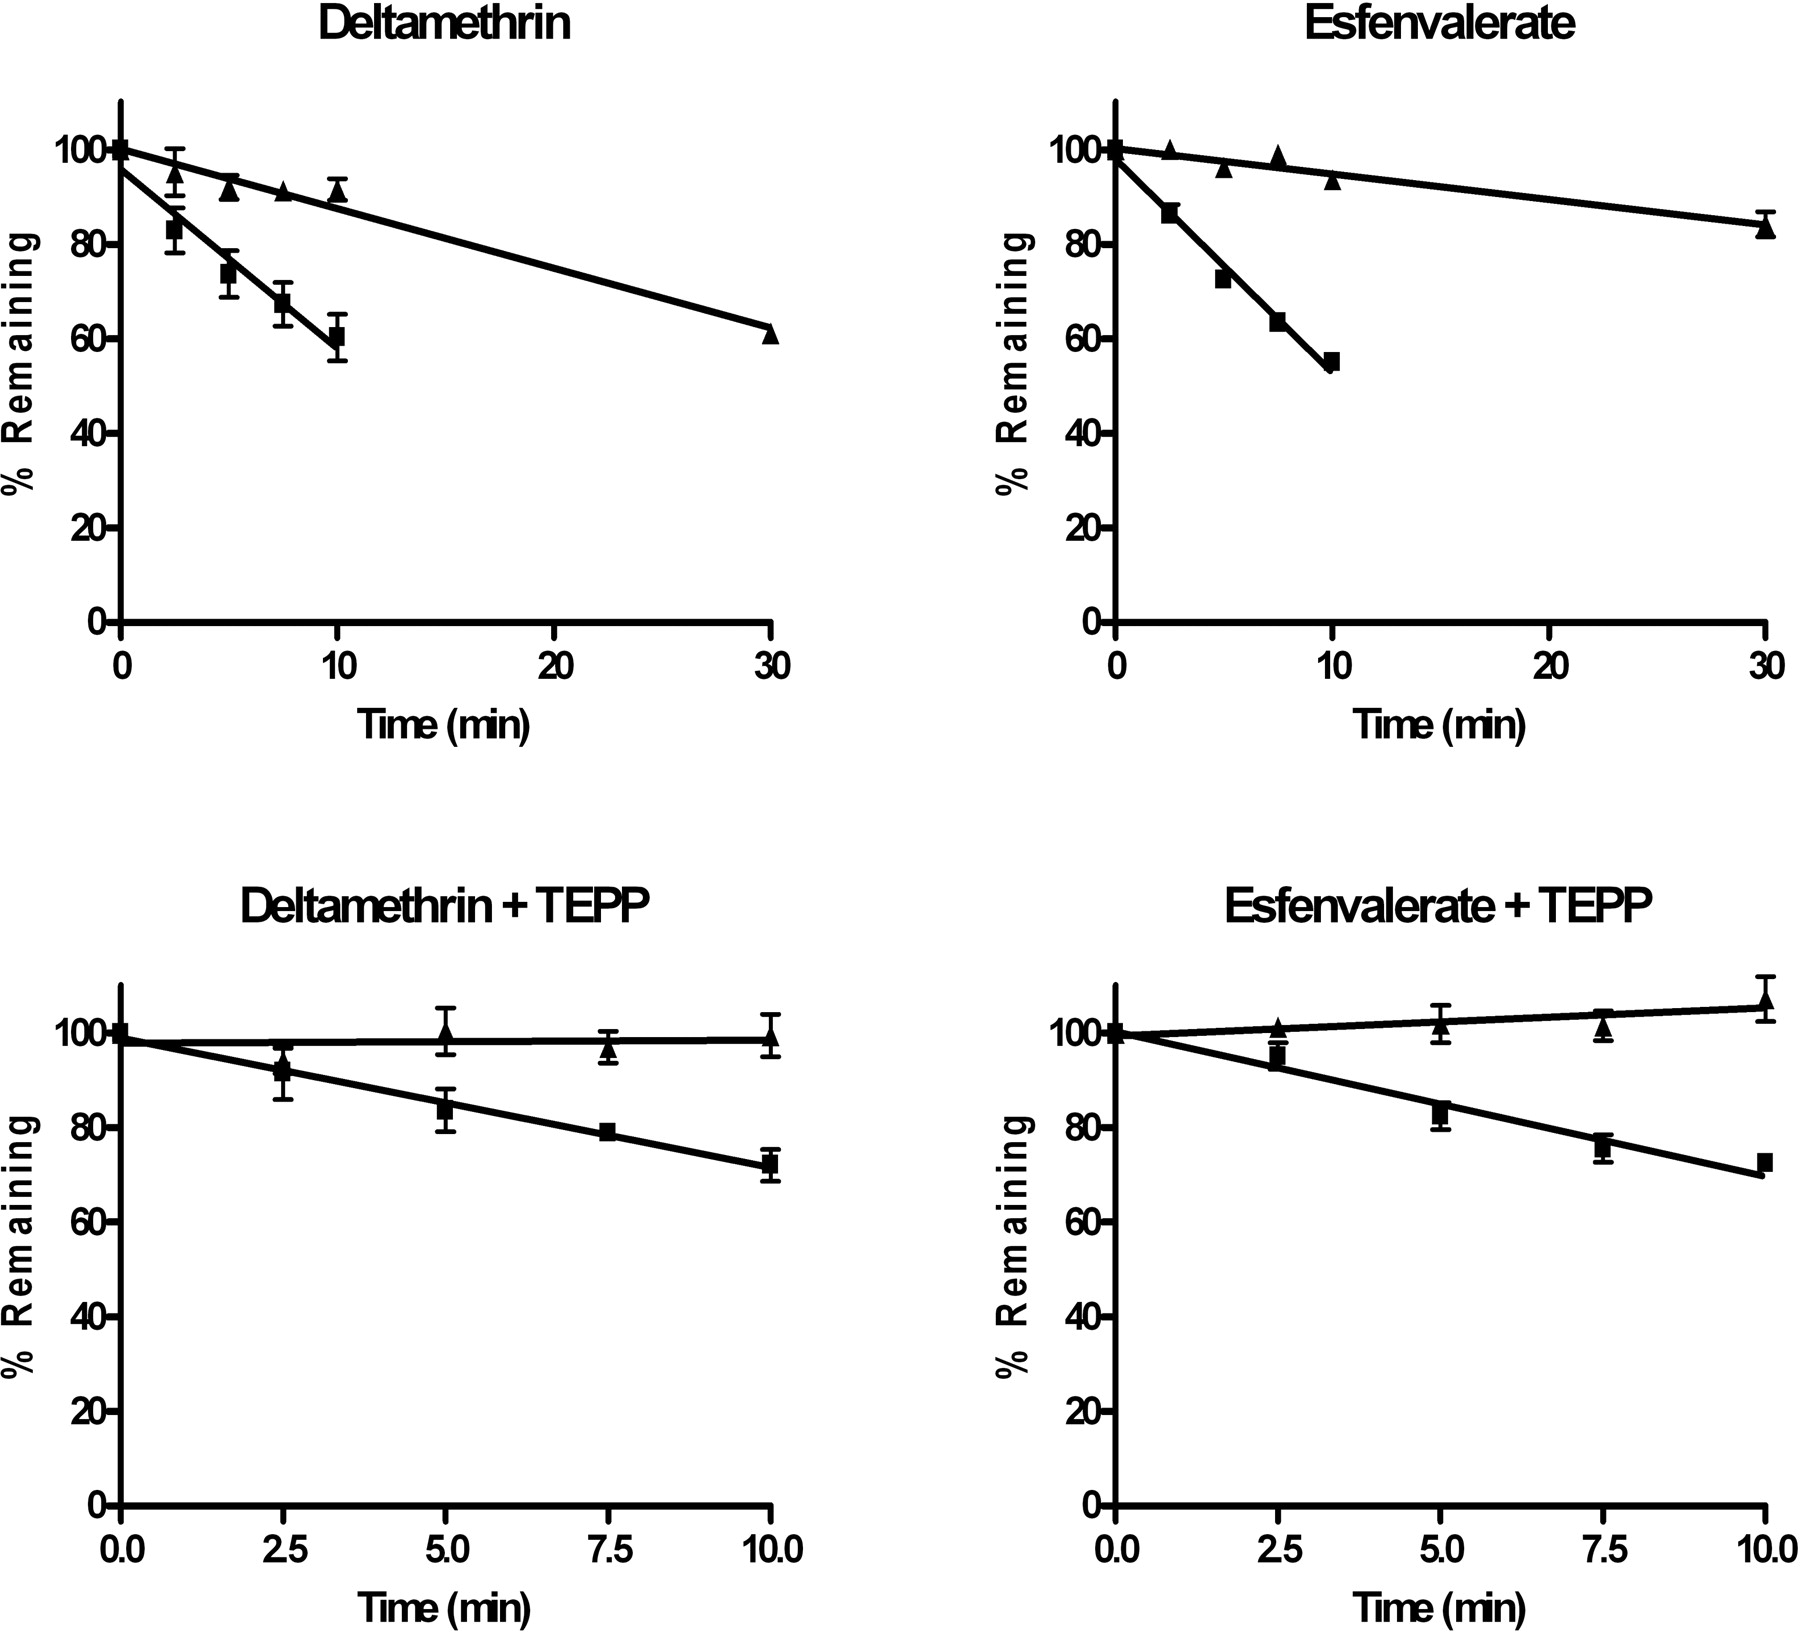
Elimination of deltamethrin and esfenvalerate from rat liver microsomes. Elimination was examined at 1 μM deltamethrin or esfenvalerate in the presence (▪) or absence (▴) of NADPH, with and without TEPP. Line represents linear regression of data points. Data are represented as the mean ± S.D. (n = 3).
Quantitation of CE-Catalyzed Hydrolytic Products by HPLC Analysis. Authentic standards are available for the hydrolysis products of deltamethrin and esfenvalerate. Furthermore, in contrast to the extensive number of hydroxylated pyrethroid metabolites produced by cytochrome P450 metabolism, there are only two hydrolysis products, the acid and alcohol metabolites. Thus, we have detected and quantified the products of the hydrolysis reactions by HPLC analysis. HPLC-UV analysis of pyrethroid hydrolytic products was performed on a Surveyor LC system (Thermo Electron, San Jose, CA) using a reversed-phase HPLC column (2.1 mm × 100 mm, C18; Thermo Electron). The mobile phases used were solvent A (1:1 v/v, water/acetonitrile containing 0.1% v/v acetic acid) and solvent B (100% acetonitrile containing 0.1% v/v acetic acid). The analytes were eluted with the following linear gradient program: 0 min (100% A, 0% B), 6 min (100% A, 0% B), 20 min (50% A, 50% B), 25 min (50% A, 50% B), and 30 min (100% A, 0% B), at a flow rate of 0.2 ml/min. Products were detected at 230 nm. Calibration standards of the hydrolysis products were routinely run along with the samples. For esfenvalerate and deltamethrin, hydrolysis rates were based on the production of 3-phenoxybenzaldehyde, which is spontaneously formed from the cyanohydrin (Wheelock et al., 2003).
Kinetic Analysis and Statistics. Nonlinear regression of substrate concentration versus reaction velocity curves was analyzed using SigmaPlot v. 8.02 software (Systat Software, Inc., Point Richmond, CA) by fitting experimental data to the Michaelis-Menten equation. The kinetic parameters reported for the human and rat CEs are the mean (±S.D.) of three independent kinetic assays. The specific activity data are reported as the mean (±S.D.) of three replicates.
Results
Elimination of Deltamethrin and Esfenvalerate from Rat Liver Microsomes. Both oxidative and hydrolytic pathways mediate the biotransformation of pyrethroids by hepatic microsomes. Initial studies indicate that the Km,app for deltamethrin and esfenvalerate in rat and human liver microsomal incubations ranged between 21 and 75 μM (Table 1). Thus, substrate concentrations of 1 μM were used in the elimination assays to estimate first order rate constants (Obach, 1999). Elimination of deltamethrin and esfenvalerate from rat liver microsomes occurred predominantly via NADPH-dependent metabolic pathways (Fig. 2). The rate of NADPH-independent elimination of deltamethrin was only 20% of the total elimination rate in the presence of NADPH (Table 2). The addition of the esterase inhibitor TEPP completely inhibited the NADPH-independent elimination of deltamethrin (Table 2). TEPP also inhibited elimination of deltamethrin in the presence of NADPH by 20%, which is consistent with the role of esterases in deltamethrin elimination. The rate of NADPH-independent elimination of esfenvalerate was 11% the total elimination (Table 2); however, esfenvalerate elimination in the presence of NADPH was decreased by nearly 50% after addition of TEPP. These results are inconsistent with TEPP inhibiting only esterase metabolism. TEPP is an organophosphate pesticide that is also metabolized by cytochromes P450 (Kulkarni and Hodgson, 1984). Thus, competitive inhibition of cytochrome P450 metabolism of esfenvalerate by TEPP may be occurring in rat liver microsomes. In addition, this did not occur with deltamethrin, indicating differences in the cytochromes P450 metabolizing deltamethrin and esfenvalerate in rat liver microsomes. Esfenvalerate metabolism was completely inhibited by TEPP in the absence of NADPH (Table 1).
Elimination rates for deltamethrin and esfenvalerate from rat and human liver microsomes
Data are mean ± S.D. (n = 3).
Elimination of Deltamethrin and Esfenvalerate from Human Liver Microsomes. The elimination of deltamethrin from human liver microsomes occurs almost entirely by NADPH-independent metabolic pathways (Fig. 3). The rate of elimination of deltamethrin from human liver microsomes was similar in the presence and absence of NADPH. The addition of TEPP into the reaction mixture decreased the total elimination rate by nearly 90% (Table 2). The elimination of esfenvalerate from human liver microsomes occurred predominantly via NADPH-dependent metabolic pathways (Fig. 3). The NADPH-independent elimination rate of esfenvalerate was 12% of the elimination rate in the presence of NADPH (Table 2). In contrast to rat microsomes, TEPP decreased elimination of esfenvalerate in the presence of NADPH by only 10%, consistent with the role of esterases in the elimination of esfenvalerate (Table 2). This may indicate that there are differences in the enzymes metabolizing esfenvalerate or TEPP between species. There was no detectable elimination of esfenvalerate after the addition of TEPP to the reaction mixture in the absence of NADPH.
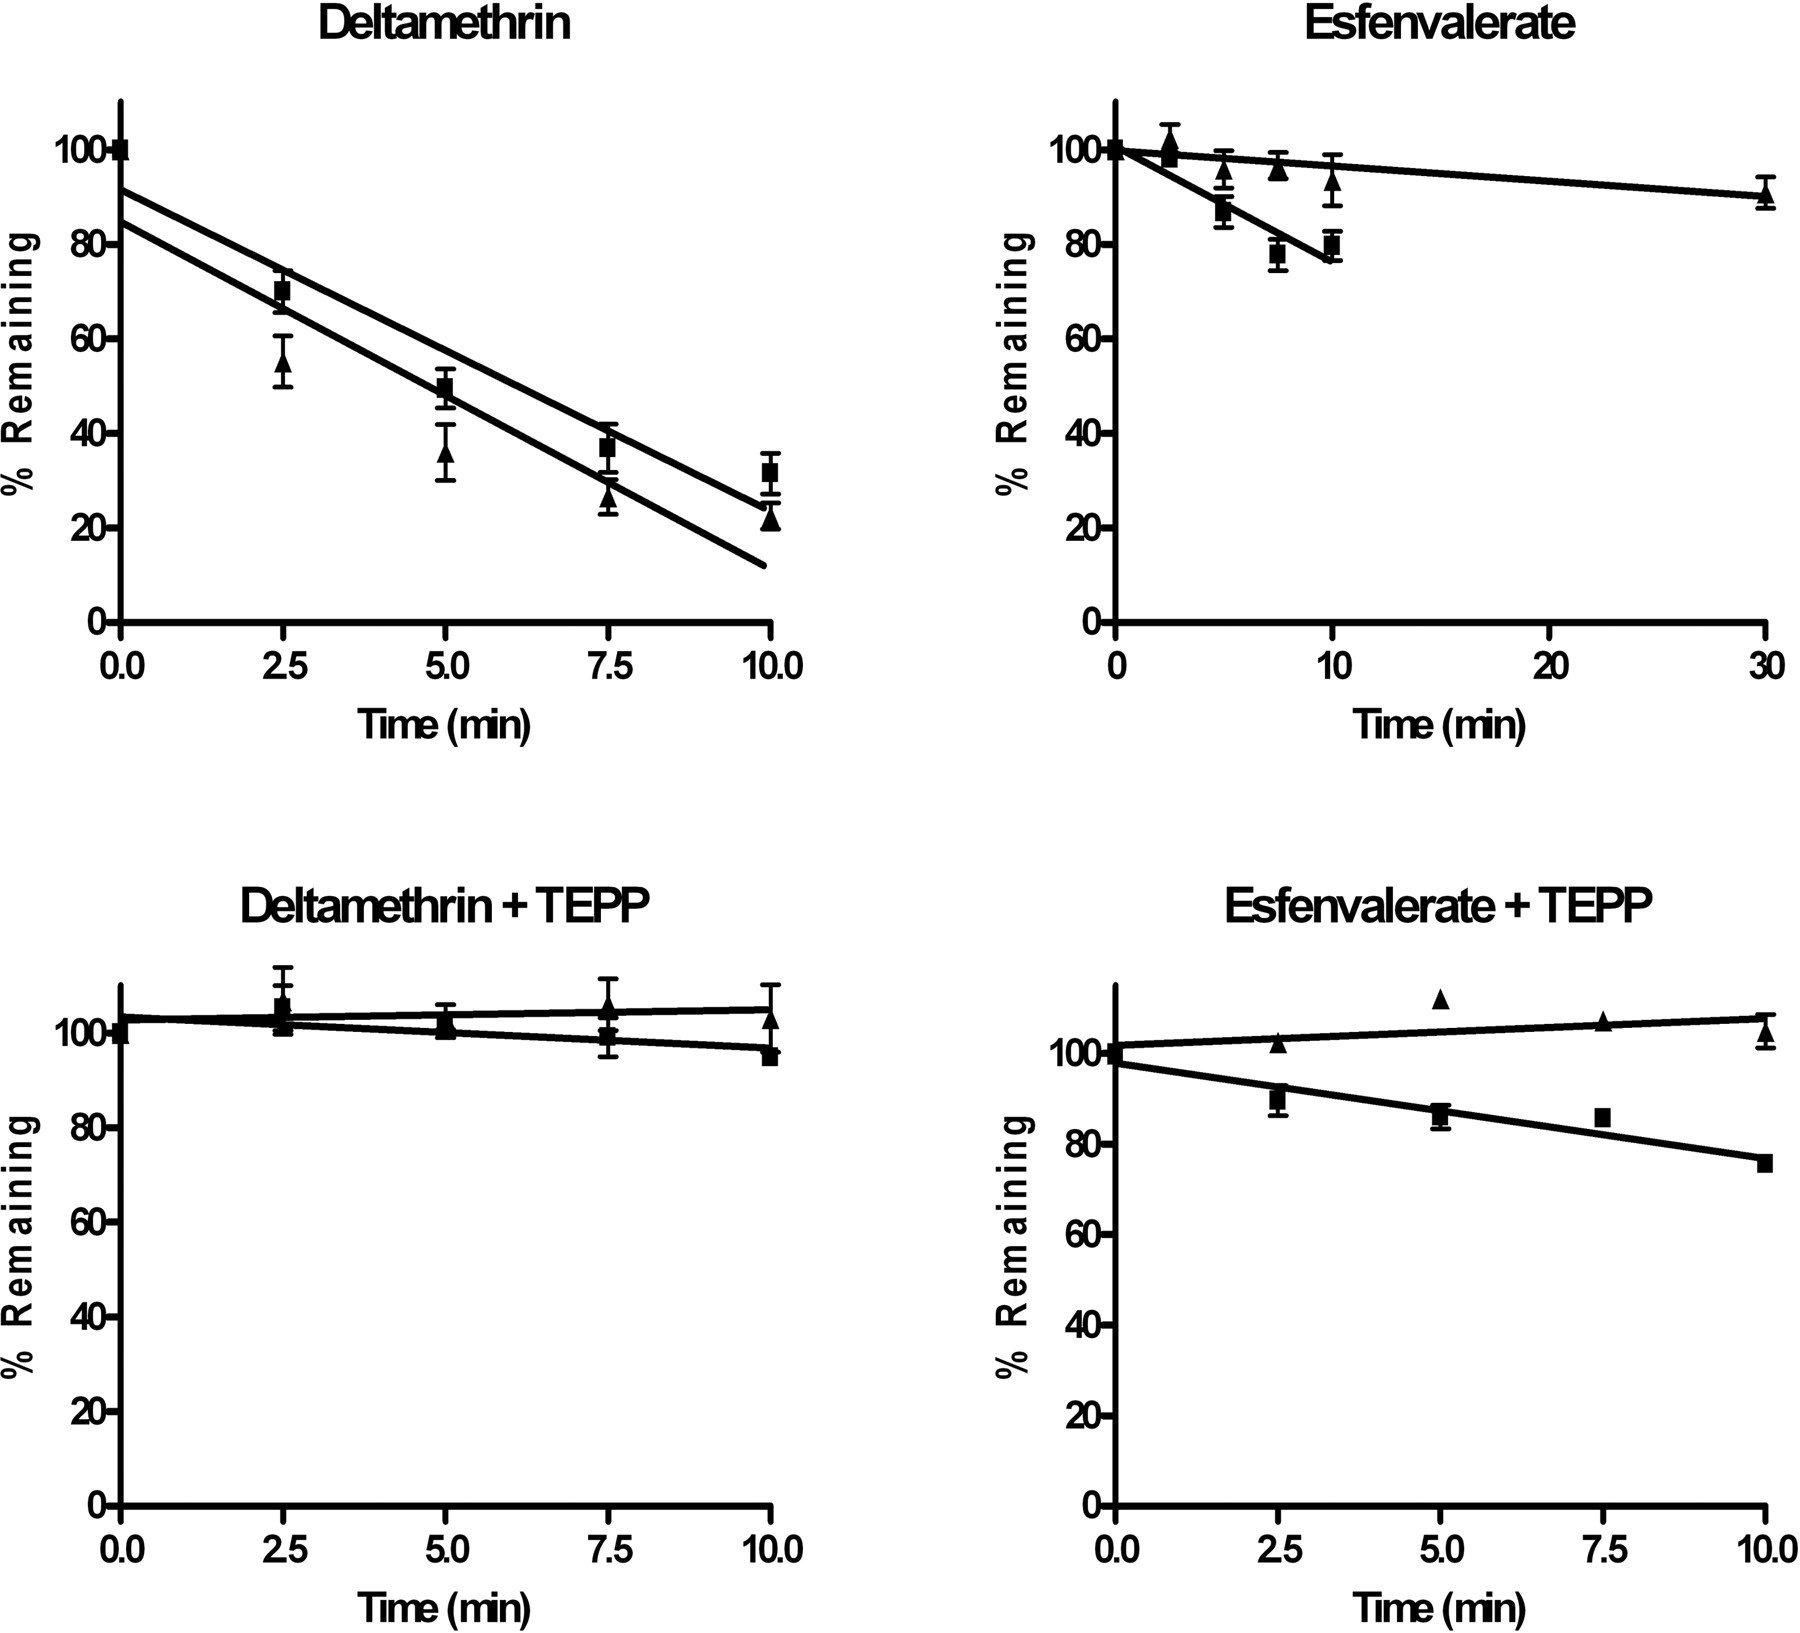
Elimination of deltamethrin and esfenvalerate from human liver microsomes. Elimination was examined at 1 μM deltamethrin or esfenvalerate in the presence (▪) or absence (▴) of NADPH, with and without TEPP. Line represents linear regression of data points. Data are represented as the mean ± S.D. (n = 3).
Rat and Human Intrinsic Hepatic Clearance Estimates for Deltamethrin and Esfenvalerate. CLINT values of deltamethrin and esfenvalerate for rats and humans were scaled to a per kilogram body weight basis for purposes of comparison. The scaled estimate for deltamethrin CLINT in humans was approximately 2-fold more rapid than that in rats (Table 1). In contrast, the scaled CLINT for esfenvalerate was approximately 3-fold more rapid in rats than in humans.
Hydrolysis of Deltamethrin and Esfenvalerate by Purified Human and Rat Carboxylesterases. The rates of hydrolysis of deltamethrin and esfenvalerate were examined by two purified human CEs (hCE-1 and hCE-2) and two purified rat CEs (hydrolases A and B). The most effective CE for deltamethrin hydrolysis was hCE-1, which was 25-, 4-, and 16-fold more active than hCE-2, hydrolase A, and hydrolase B, respectively (Table 3). Consistent with the differential rates of hydrolysis of deltamethrin and esfenvalerate by human liver microsomes described above, the rates of deltamethrin hydrolysis by hCE-1 and hCE-2 were markedly faster than those for esfenvalerate (4- and 5-fold, respectively; Table 3). Rat hydrolase A was the most effective CE catalyst of esfenvalerate hydrolysis, with 2-fold more activity than either rat hydrolase B or hCE-1, and 73-fold more activity than hCE-2 (Table 3).
Specific activity of human and rat carboxylesterase hydrolysis of deltamethrin and esfenvalerate
The kinetic parameters for deltamethrin hydrolysis were also estimated for each human and rat CE (Table 4). Among the four esterases examined, hCE-1 had the highest Km and kcat, and the highest catalytic efficiency (kcat/Km). Figure 4 demonstrates results from a representative substrate-velocity experiment comparing hCE-1 and rat hydrolase A. The rates of deltamethrin hydrolysis catalyzed by hCE-1 were more rapid at all concentrations used, compared with rat hydrolase A. It should also be noted that the kinetic parameters shown in Table 4 were estimated by nonlinear regression methods using all concentrations of substrate (5–100 μM) (Fig. 4) and that similar kinetic parameters were also obtained when the kinetic data were analyzed, instead, using the Lineweaver-Burk plot (data not shown). A reliable CE kinetic parameter for comparison with respect to deltamethrin hydrolysis is the turnover numbers (kcat). The kcat values obtained are in good agreement with the measured specific activity values that were determined at a substrate concentration of 50 μM (Table 3). Although this is a relatively high concentration of substrate, it is necessary to detect the hydrolysis product 3-phenoxybenzaldehyde by HPLC analysis. Figure 5 compares the kcat values of rat hydrolase A and hCE-1 for deltamethrin and esfenvalerate hydrolysis with those of other pyrethroids (Ross et al., 2006). This result clearly demonstrates the species difference in the activities of rat hydrolase A and hCE-1 that is unique for deltamethrin when compared with the general similarity in hydrolytic rates observed with the other pyrethroids.
Hydrolysis of deltamethrin: kinetic parameters of human and rat carboxylesterases
Parameters are the means ± S.D. obtained from three independent kinetic experiments.
Discussion
The biochemical pathways that contribute to the metabolism of pyrethroid pesticides in laboratory animals are understood relatively well (Soderlund and Casida, 1977; Casida and Ruzo, 1980). Fewer studies have examined the metabolism of pyrethroids by humans (Choi et al., 2002; Nishi et al., 2006; Ross et al., 2006). Recent studies by Ross et al. (2006) suggest that there may be quantitative and qualitative differences in the metabolism of pyrethroids by rat and human esterases. The present study compares the elimination of deltamethrin and esfenvalerate from rat and human liver microsomes. Consistent with previous work (Soderlund and Casida, 1977; Shono et al., 1979; Anand et al., 2006), the elimination of deltamethrin and esfenvalerate in rat liver microsomes occurred primarily through an NADPH-dependent oxidative pathway. Esfenvalerate elimination from human liver microsomes also occurs primarily by the NADPH-dependent oxidative pathways. In contrast, NADPH-independent hydrolytic pathways predominantly eliminate deltamethrin in human liver microsomes.
The observed species difference in the metabolism of deltamethrin led to the examination of the metabolism of deltamethrin and esfenvalerate by purified rat and human CE enzymes. hCE-1 had a specific activity that was 4- to 15-fold greater than that of rat hydrolases A and B when rates of deltamethrin hydrolysis were compared (Table 3). The specific activity obtained for hydrolase A in our current study is in agreement with the deltamethrin hydrolysis activity obtained using a rabbit carboxylesterase (Ross et al., 2006), which is 99% identical to hydrolase A in terms of amino acid sequence homology. The differential hydrolysis rates by human and rat CEs suggest that differences in esterase activity are probably responsible, at least in part, for the differences in the metabolism of deltamethrin observed between rat and human liver microsomes. Indeed, the kcat values for the human and rat CEs (which are a measure of the rate of enzymatic reaction at saturating concentrations of substrate) did correlate with the species difference in deltamethrin metabolism using the liver microsomes; however, differences in kcat/Km values were not remarkably different between hCE-1 and hydrolase A (Table 4). Caution needs to be exercised when correlating kinetic parameters of pure enzymes with the species difference in deltamethrin hydrolysis rates found using hepatic microsomes. This is because kcat/Km and kcat values are a metric of an enzyme's intrinsic catalytic efficiency and turnover in a pure preparation, not in a crude mixture of proteins found in tissue fractions where protein-protein interaction may modulate enzyme activity (Saghatelian et al., 2004). Also, differences in hydrolysis rates in hepatic microsomes between species may reflect the spectrum of esterase isoforms that are present in each species and their relative expression levels in liver. For example, if hCE-1 and hydrolase A have similar catalytic efficiencies and thus metabolize deltamethrin equally well at low concentrations of substrate (which does not saturate the enzyme), then the observed differences in hydrolytic rates using hepatic microsomes may reflect differences in the relative expression levels of hCE-1 versus hydrolase A. Alternatively, it cannot be excluded that an unidentified esterase is present in human liver microsomes that is much more efficient (much larger kcat/Km) than the rat liver esterases, thus accounting for the observed differential hydrolysis rates.

Kinetics of deltamethrin hydrolysis by hCE-1 and hydrolase A. Velocity was measured by the amount of 3-phenoxybenzylaldehyde (3PBCHO) released during the reaction. Data (symbols) were fit to the Michaelis-Menten equation and the nonlinear regression results are plotted (lines). Each point represents the mean ± S.D. (n = 3).
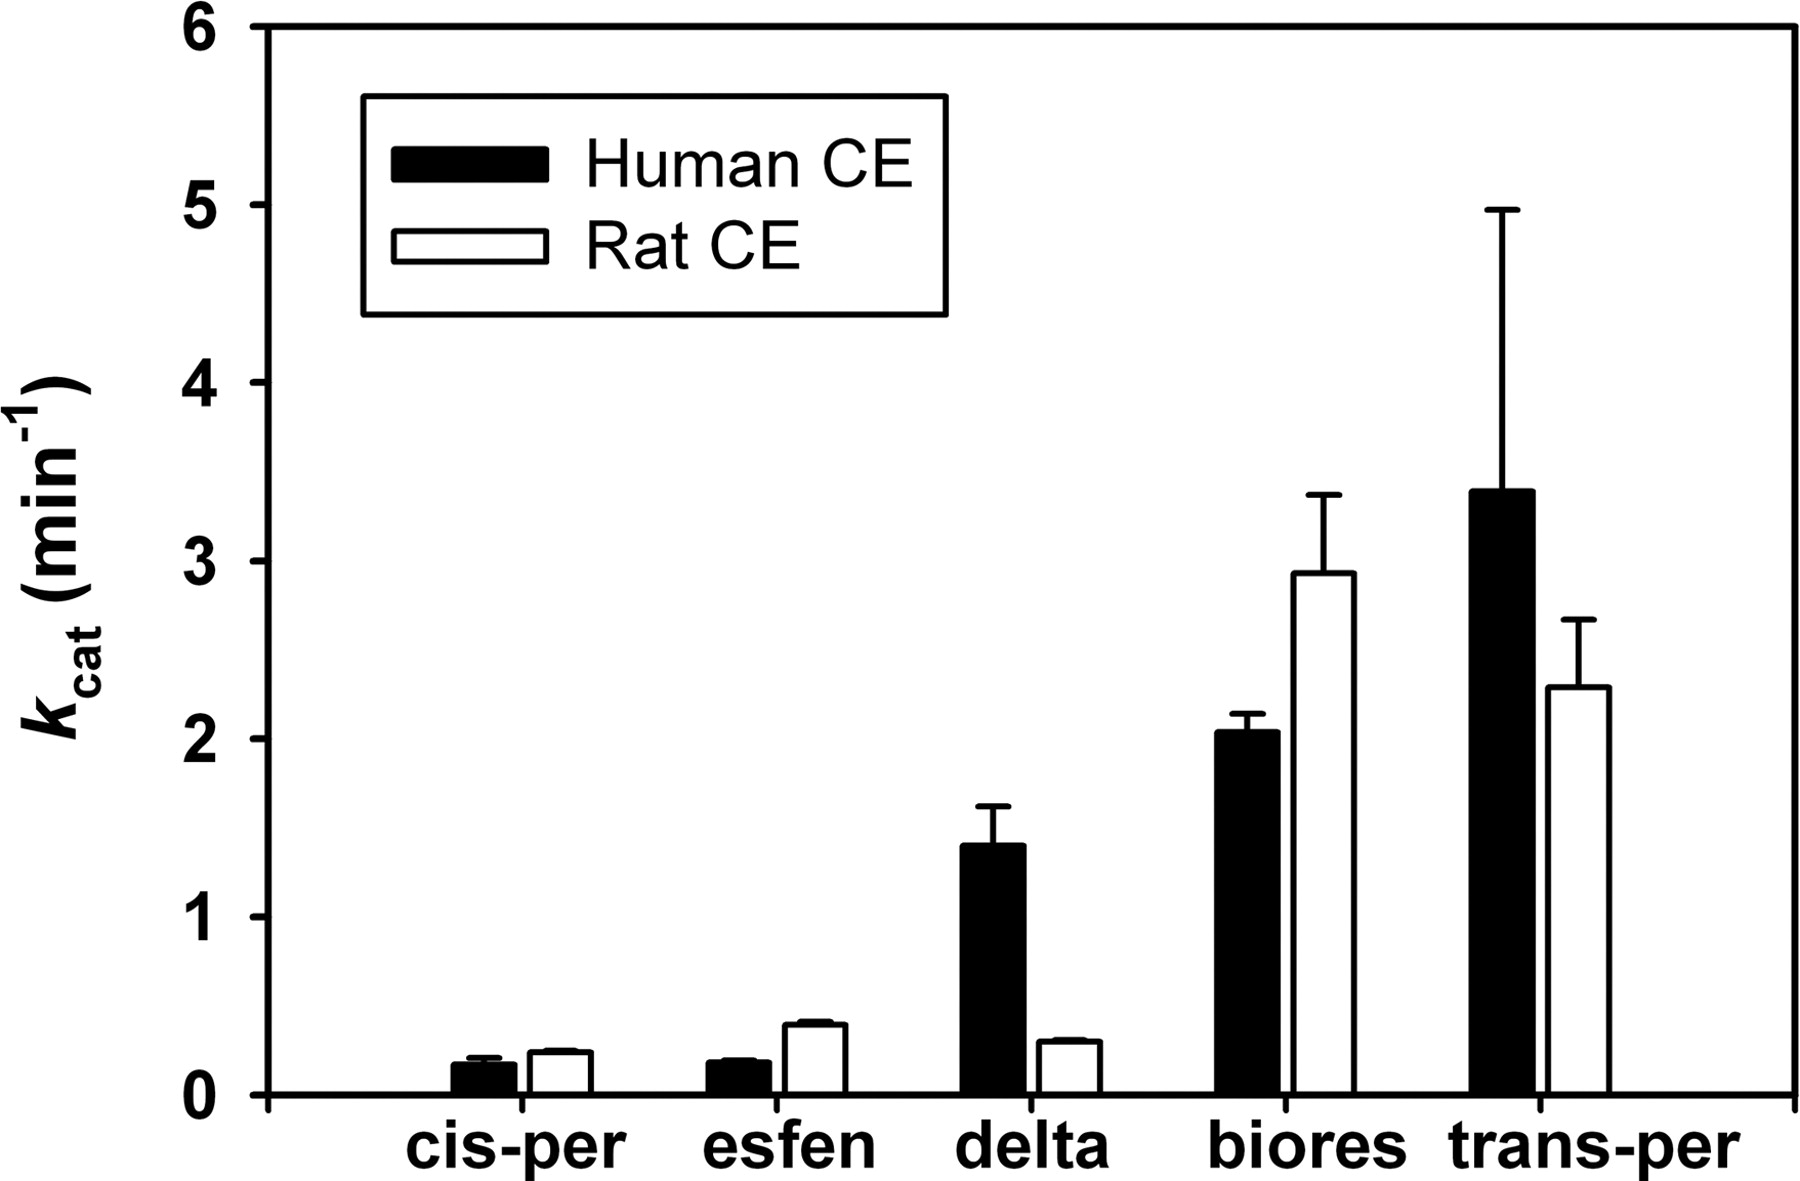
Comparison of turnover numbers (kcat) for human CE (hCE-1) and rat CE (hydrolase A). Hydrolysis of five different pyrethroids are compared. Data for cis-permethrin (cis-per), trans-permethrin (trans-per), and bioresmethrin (biores) are from Ross et al. (2006). esfen, esfenvalerate; delta, deltamethrin.
In contrast to hCE-1, human carboxylesterase 2 (hCE-2) was shown to have significantly less activity toward deltamethrin. hCE-1 is expressed abundantly in human liver, whereas hCE-2 is expressed at relatively lower levels in this tissue (Satoh et al., 2002). Thus, based on our findings, it is likely that hCE-1 plays a greater role in the metabolism of deltamethrin in human liver than does hCE-2. Recently Nishi et al. (2006) reported on the activity of hCE-1 and hCE-2 toward a number of pyrethroids including deltamethrin and esfenvalerate. The specific activities reported by Nishi et al. (2006) are similar to those reported here except in one case. In their studies, hCE-2 had greater activity toward deltamethrin than did hCE-1. Although this finding is inconsistent with the data presented in this study, it may be explained by differences in the intrinsic activity of the preparations used. The intrinsic activity of hCE-2 found by Nishi et al., (2006) was more than 2-fold greater than that of the hCE-2 used in our studies (reported in Ross et al., 2006) toward the standard substrate p-nitrophenyl acetate.
Carboxylesterases (EC 3.1.1.1) are members of the esterase family of serine hydrolase enzymes (Satoh and Hosokawa, 1998). The catalytic mechanism of CEs requires a triad of amino acid residues (Ser, His, and Glu or Asp) that are essential for activity. The rat CE isozymes named hydrolase A and hydrolase B are the two most abundant carboxylesterases present in rat liver, accounting for 80% of the total hepatic carboxylesterase protein under basal conditions (Morgan et al., 1994; Sanghani et al., 2002). These rat enzymes share ∼70% amino acid sequence identity with each other and have over-lapping substrate specificities. Hydrolases A and B have amino acid sequences that are approximately 70 to 80% identical with the major human hepatic carboxylesterase (hCE-1) (Redinbo and Potter, 2005). Thus, these CE isozymes are classified as being within the class 1 family of CE enzymes. In contrast, hCE-2 is quite distinct from the rat CEs and hCE-1 in terms of sequence identity and substrate specificity (Satoh and Hosokawa, 1998). hCE-2 shares less than 50% sequence identity with hCE-1 and hydrolases A and B, and is classified as a class 2 carboxylesterase.
The amino acid sequences that flank the catalytic triad of Ser, His, and Glu residues in hCE-1 and hydrolase A are nearly identical to each other; thus, they are highly conserved. The differences in catalytic specificity observed for hCE-1 and hydrolase A toward deltamethrin is potentially related to differences in the types of amino acids that line the substrate-binding gorge and/or active site of the enzymes. Future studies that create site-specific mutants of hCE-1 and/or hydrolase A may yield insight into the underlying specificity differences observed between rat and human CEs. Furthermore, computational approaches that involve molecular modeling of hCE-1 and hydrolase A will be of potential value.
The present study indicates that deltamethrin (a cis-isomer) is metabolized primarily by an NADPH-independent hydrolytic pathway in human liver microsomes. This finding is not consistent with structure-metabolism relationships found in laboratory animals. A number of studies demonstrate that in laboratory animals, oxidative pathways generally metabolize cis-isomers of pyrethroids more rapidly compared with their trans-isomers, which are generally more rapidly metabolized by hydrolytic pathways (Soderlund and Casida, 1977; Shono et al., 1979). Recently, Anand et al. (2006) described the ability of a number of rat hepatic P450s to metabolize deltamethrin. Their results indicate that CYP1A1, CYP1A2, and CYP2C11 may be active in the metabolism of deltamethrin in rat liver microsomes, with CYP1A2 being the most active. Based on these results, we examined the metabolism of deltamethrin by human CYP1A2 but did not see significant evidence of metabolism (Godin et al., unpublished data). This result suggests that there may be marked differences in P450 activities between rats and humans toward deltamethrin. It is also possible that the difference in oxidative metabolism is related to differences in expression of these enzymes between rat and human liver. For example, CYP2C11 is highly expressed in the rat liver (Guengerich et al., 1982), whereas one of its human homologs, 2C18, has very low expression in the liver (Rodrigues, 1999). A comparison of the full complement of rat and human P450 isozymes would be needed to confirm these initial findings and to understand the lack of P450-mediated metabolism in human liver microsomes. The lack of P450-mediated metabolism of deltamethrin in human liver microsomes may be as important in the species difference as is the differences in the activities of rat and human carboxylesterases.
In addition to differences in the pathways of biotransformation of the parent chemical, there were also differences in the rates of elimination and calculated intrinsic hepatic clearance for deltamethrin and esfenvalerate. Since the parent chemical is the primary toxicant for pyrethroids, elimination of the parent chemical can be considered the detoxification step in their metabolism. The CLint of esfenvalerate, which was eliminated by similar pathways in both species, was estimated to be nearly 3-fold greater in rats than in humans. In contrast, the CLint of deltamethrin was estimated to be twice as rapid in humans as in rats. In addition, deltamethrin was eliminated by different pathways in rat and human liver microsomes.
These results indicate that laboratory rodents may not be a good model for understanding and extrapolating the results of metabolism studies of all pyrethroids in a human health risk assessment. It is therefore necessary to more completely understand the human metabolism of individual pyrethroids to reduce uncertainties in a risk assessment.
Acknowledgments
M.K.R. gratefully acknowledges Shellaine Lentz for technical assistance during the purification of rat carboxylesterase enzymes. We thank Bayer Crop Sciences (Research Triangle Park, NC) and DuPont (Johnston, IA) for generous gifts of deltamethrin and esfenvalerate.
Footnotes
-
S.J.G. was supported by NHEERL-DESE, EPA CT826513. Research support was provided by National Institutes of Health Grants P20 RR017661 (to M.K.R.) and by National Institutes of Health Grants CA76202, CA79763, CA108775, CA98468, a Cancer Center Core Grant P30 CA-21765, and the American Lebanese Syrian Associated Charities (to P.M.P.).
-
This article has been reviewed in accordance with the policy of the National Health and Environmental Effects Research Laboratory, U.S. Environmental Protection Agency, and approved for publication. Approval does not signify that the contents necessarily reflect the views and policies of the Agency, nor does mention of trade names or commercial products constitute endorsement or recommendation for use.
-
Article, publication date, and citation information can be found at http://dmd.aspetjournals.org.
-
doi:10.1124/dmd.106.010058.
-
ABBREVIATIONS: TEPP, tetraethylpyrophosphate; CLINT, intrinsic hepatic clearance; hCE-1, human carboxylesterase 1; hCE-2, human carboxylesterase 2; MSP, microsomal protein; CE, carboxylesterase; P450, cytochrome P450.
- Received March 15, 2006.
- Accepted July 11, 2006.
- The American Society for Pharmacology and Experimental Therapeutics


