


Abstract
The purpose of this study is to determine the importance of coupling of efflux transporters and metabolic enzymes in the intestinal disposition of six isoflavones (genistein, daidzein, formononetin, glycitein, biochanin A, and prunetin), and to determine how isoflavone structural differences affect the intestinal disposition. A rat intestinal perfusion model was used, together with rat intestinal and liver microsomes. In the intestinal perfusion model, significant absorption and excretion differences were found between isoflavones and their respective glucuronides (p <0.05), with prunetin being the most rapidly absorbed and formononetin glucuronides being the most excreted in the small intestine. In contrast, glucuronides were excreted very little in the colon. In an attempt to account for the differences, we measured the glucuronidation rates of six isoflavones in microsomes prepared from rat intestine and liver. Using multiple regression analysis, intrinsic clearance (CLint) and other enzyme kinetic parameters (Vmax and Km) were determined using appropriate kinetic models based on Akaike's information criterion. The kinetic parameters were dependent on the isoflavone used and the types of microsomes. To determine how metabolite excretion rates are controlled, we plotted excretion rates versus calculated microsomal rates (at 10 μM), CLint values, Km values, or Vmax values, and the results indicated that excretion rates were not controlled by any of the kinetic parameters. In conclusion, coupling of intestinal metabolic enzymes and efflux transporters affects the intestinal disposition of isoflavones, and structural differences of isoflavones, such as having methoxyl groups, significantly influenced their intestinal disposition.
Isoflavones are currently undergoing clinical trials for cancer prevention (Takimoto et al., 2003), because they have been shown to be effective in the prevention of prostate and breast cancers in preclinical models (Kurzer and Xu, 1997; Lamartiniere, 2000). Isoflavones belong to a class of phytoestrogens that has been gathering increasing interest in clinical nutrition and disease prevention (Jacobsen et al., 1998; Tham et al., 1998; Messina, 1999; Setchell and Cassidy, 1999). Soy isoflavones, such as genistein, daidzein, and glycitein, and red clover isoflavones, such as formononetin, biochanin A, and prunetin, have also generated great interest for menopausal hormone replacement therapy (Muthyala et al., 2003). In addition, isoflavones have been reported to exert purported health benefits in various aging-related and hormone-dependent disorders (e.g., osteoporosis) as well as cardiovascular diseases (for reviews, see Kurzer and Xu, 1997; Setchell and Cassidy, 1999; Harborne and Williams, 2000; Birt et al., 2001; Yang et al., 2001).
Despite reports of various biological activities in vitro, in vivo studies in animals and humans have shown poor bioavailability (generally in the range of less than 5%) that is highly variable (Kelly et al., 1995; Setchell, 1998; Birt et al., 2001; Setchell et al., 2001; Busby et al., 2002). Poor bioavailability of isoflavone aglycones (unconjugated isoflavones) is a serious concern because most of the isoflavones found in the plasma are present as conjugates with in vivo aglycone plasma concentrations of 0.01 to 0.4 μM (Setchell et al., 2001; Busby et al., 2002). These in vivo concentrations are significantly less than the IC50 or EC50 values (5–50 μM) commonly reported for its anticancer effects in vitro (Kurzer and Xu, 1997; Birt et al., 2001; Yang et al., 2001). Similarly, prostate concentrations of isoflavones (mostly conjugated) are also low and found to be within the lower range of the plasma concentrations (Morton et al., 1997; Hong et al., 2002).
Initially, low isoflavone bioavailability was partially attributed to poor hydrolysis of glucosides by the intestinal microflora, which releases aglycone for rapid absorption. However, recent investigation from our laboratory as well as others has demonstrated the presence of intestinal lactase phlorizin hydrolase that is capable of rapidly hydrolyzing the glucosides (Liu and Hu, 2002; Day et al., 2003; Sesink et al., 2003; Wilkinson et al., 2003). The presence of this enzyme in the upper intestinal tract makes it more important to study the absorption and metabolism of isoflavone aglycones, since we showed equally efficient absorption of glucosides in rats compared with that of aglycones (Liu and Hu, 2002; Liu et al., 2003). Furthermore, it was also later found that isoflavones were rapidly absorbed and thus gave support to the hypothesis that extensive first-pass metabolism of isoflavones is responsible for their poor bioavailability (Liu and Hu, 2002; Chen et al., 2003, 2005b).

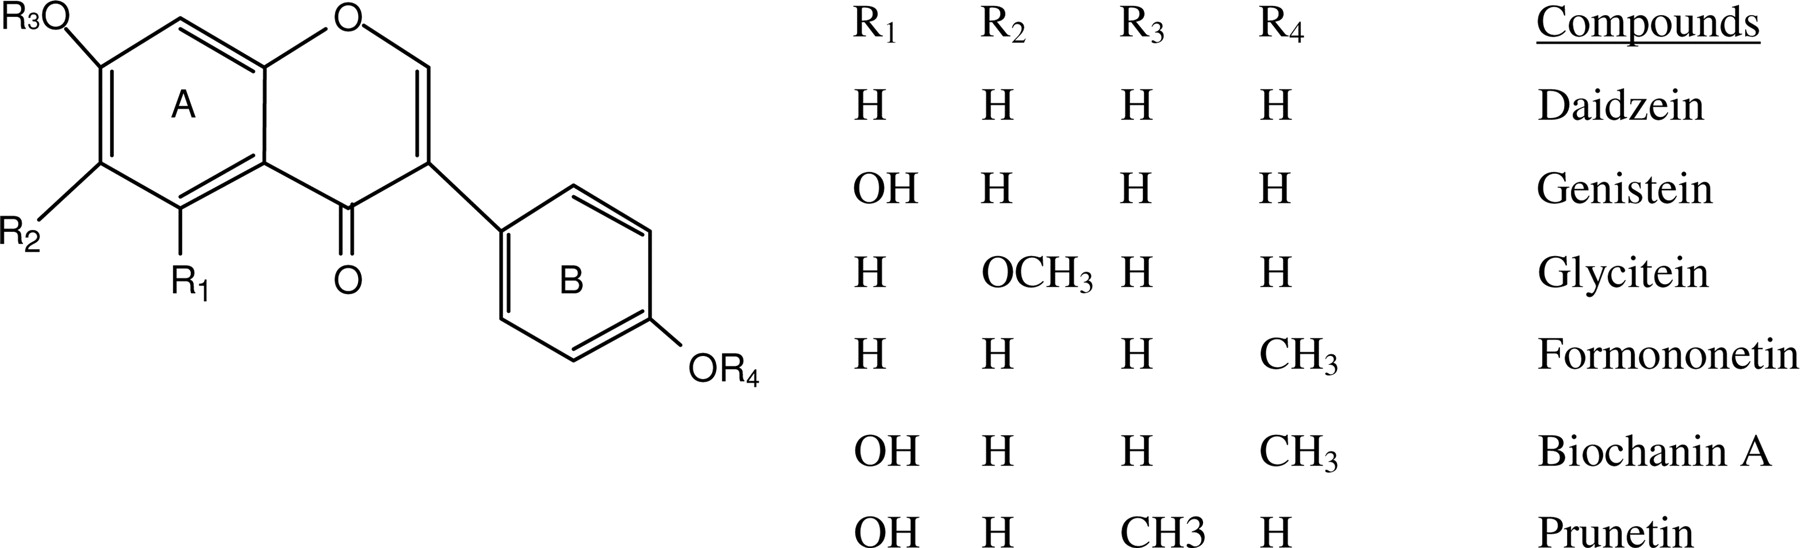
Structure of model compounds. Shown in the scheme are structures of aglycone forms of isoflavone analogs. Glucoside or glycoside forms of these isoflavones are more prevalent in nature, with the glycoside attached to the 7 (R3) and/or 4′ (R4) positions. Isoflavones differ from flavones in that the “B” ring is at position 3 instead of position 2 of the benzopyranone or “A” ring. Conjugated phase II metabolites are formed on the 7-hydroxy group on the A ring and the 4′-OH group on the B ring.
It has been demonstrated that extensive phase II metabolism in the intestine is a major component of first-pass metabolism of isoflavones (Liu and Hu, 2002; Chen et al., 2003, 2005b). We further proposed that enteric recycling, which entails reconversion of conjugates that are excreted by intestinal efflux transporters (e.g., multidrug resistance-associated protein or MRP) with subsequent hydrolysis by intestinal microflora and uptake by colonic enterocytes, is an integral component of flavonoid disposition processes in vivo (Liu and Hu, 2002; Chen et al., 2003; Hu et al., 2003; Jia et al., 2004). With respect to this scheme, we proposed that the coupling of efflux transporters and conjugating enzymes (or “enzyme-transporter coupling”) in the gut is a critical process that enables enteric recycling of polyphenols such as isoflavones (Jeong et al., 2005).
To further understand this coupling process, six isoflavones (i.e., genistein, daidzein, formononetin, glycitein, biochanin A and prunetin) were used to determine how structural differences affect their disposition in Caco-2 cells (Chen et al., 2005a). The results indicated that structural difference affects absorption, metabolism, and efflux of phase II conjugates. More recent studies in the rat microsomal system indicated that structural difference also affected the jejunal and hepatic glucuronidation rates, and compounds with an electron-donating group on the ring were glucuronidated much faster than those without (Chen et al., 2005a).
In the present study, we continue our investigation to determine how structural differences affect isoflavone disposition in duodenum, ileum, and colon (Fig. 1). With these data, we can now also determine the importance of coupling of efflux transporters and metabolic enzymes in determining the intestinal disposition of isoflavones by comparing the amounts of metabolites excreted in four regions of the intestine to the kinetic parameters derived from the relevant microsomal reaction systems in vitro.
Materials and Methods
Materials. Daidzein and glycitein were purchased from LC Laboratories (Woburn, MA). Biochanin A, formononetin, prunetin, and genistein were purchased from Indofine Chemicals (Somerville, NJ). β-Glucuronidase with (catalog no. G1512) or without sulfatase (catalog no. G7396), sulfatase without glucuronidase (catalog no. S1629), uridine diphosphoglucuronic acid, alamethicin, d-saccharic-1,4-lactone monohydrate, magnesium chloride, Tris, and Hanks' balanced salt solution (powder form) were purchased from Sigma-Aldrich (St. Louis, MO). [14C]polyethylene glycol-4000 was obtained from PerkinElmer Life Sciences (Boston, MA). All other materials (typically analytical grade or better) were used as received.
Animals. Male Harlan rats (70–110 days old) weighing between 300 and 324 g were obtained from Simonsen Laboratory (Gilroy, CA). The rats were fed with Teklad F6 rodent diet (W) from Harlan Laboratories (Madison, WI). The rats were fasted overnight before the day of the experiment. No flavonoids were found in pH 7.4 Hanks' balanced salt solution buffer that had been perfused through a segment of jejunum, indicating minimal presence of dietary flavonoids in the intestine.
Animal Surgery. The procedures were approved by Washington State University's and University of Houston's Institutional Animal Care and Uses Committees. The intestinal surgical procedures were modified from our previous publications (Hu et al., 1988, 1998), in that we perfused four segments of the intestine simultaneously (a “four-site model”) and added a bile duct cannulation. The circulation to the liver and intestine was not disrupted in this model. We have previously described the surgical procedures (Chen et al., 2003). To keep the temperature of the perfusate constant, the inlet cannulate was insulated and kept warm by a 37°C circulating water bath.
Transport and Metabolism Experiments in Perfused Rat Intestinal Model. This is a single-pass perfusion method. Four segments of the intestine (duodenum, upper jejunum, terminal ileum, and colon) were perfused simultaneously with a perfusate containing the compound of interest at a concentration of 10 μM using an infusion pump (model PHD2000; Harvard Apparatus, Cambridge, MA) at a flow rate of 0.191 ml/min. After a 30-min washout period, which is usually sufficient to achieve the steady-state absorption, four samples were collected from the outlet cannulae every 30 min afterward. Bile samples (approximately 0.4 ml) were collected before perfusion started and every 30 min afterward. After perfusion, the length of the intestine was measured as described previously (Hu et al., 1988, 1998). The outlet concentrations of test compounds in the perfusate were determined by HPLC. Bile samples were diluted (1:10) with buffer; glucuronidase + sulfatase was added and reacted for 2 h to release the aglycones for HPLC measurement.
Rat Intestinal Microsomes and Liver Microsome Preparation. Rat intestinal microsomes and male rat liver microsomes were prepared from adult Sprague-Dawley rats using a procedure adopted from the literature with minor modification (Okita et al., 1993; Chen et al., 2003). The resulting microsomes were suspended in 250 mM sucrose solution, separated into microcentrifuge tubes, and stored at –80°C until use.
Measurement of Protein Concentration. Protein concentrations of microsomes were determined using a protein assay (Bio-Rad, Hercules, CA), using bovine serum albumin as standard.
Measurement of UGT Activities Using Microsomes. The incubation procedures for measuring UDP-glucuronosyltransferase (UGT) activities using microsomes were as follows: 1) mix microsomes (final concentration ≈0.05 mg protein/ml), magnesium chloride (0.88 mM), saccharolactone (4.4 mM), and alamethicin (0.022 mg/ml); different concentrations of substrates in a 50 mM potassium phosphate buffer (pH 7.4); and uridine diphosphoglucuronic acid (3.5 mM, add last); 2) incubate the mixture (final volume = 200 μl) at 37°C for 30 or 60 min; and 3) stop the reaction by the addition of 50 μlof94% acetonitrile/6% glacial acetic acid containing 100 μM testosterone as an internal standard.
Sample Extraction. To confirm the formation of a particular conjugate, we selectively extracted samples with methylene chloride to remove >90% of aglycones. The resulting sample was then divided into two parts, one of which was analyzed directly and the other analyzed after glucuronidase or sulfatase hydrolysis. The difference in amount of aglycones found in these two samples was the amount of metabolite formed. The relationship between the peak areas of the metabolites before hydrolysis and the peak areas of aglycones after the hydrolysis is used to establish the conversion factor used to quantify the amounts of isoflavone conjugates as described previously (Liu and Hu, 2002).
HPLC Analysis of Isoflavones and Their Conjugates. The conditions for analyzing daidzein, glycitein, genistein, prunetin, biochanin A, formononetin, and their conjugates were as follows: system, Agilent 1090 (Agilent Technologies, Palo Alto, CA) with diode array detector and ChemStation; column, Aqua (Phenomenex, Gilroy, CA), 5 μm, 150 × 0.45 cm; mobile phase A, water [0.04% phosphoric acid (H3PO4)] and 0.09% triethylamine (C6H15N), pH 3.0); mobile phase B, 100% acetonitrile; gradient, 0 to 3 min, 15% B; 3 to 15 and 15 to 19 min, 15 to 52% B and 19 to 41% B; wavelength, 254 nm (for the isoflavones and the internal standard); and injection volume, 200 μl. There was a 4-min interval between the end of the run and the next injection to allow the column to be re-equilibrated with 15% mobile phase B.
Data Analysis. Permeability of the parent isoflavones was represented by P*eff, which was obtained as described previously (Hu et al., 1988, 1995; Liu et al., 2003). Amounts of isoflavones absorbed (Mab), amounts of conjugated isoflavones excreted into the intestinal lumen (Mgut), amounts of conjugated isoflavones excreted via the bile (Mbile), and the percentage absorbed and percentage metabolized values were calculated as described previously (Chen et al., 2003). In brief, Mab was expressed as:  where Q is the flow rate (ml/min), τ is the sampling interval (30 min), and CAin and CAout are the inlet and outlet concentrations, respectively, of aglycones corrected for water flux using [14C]polyethylene glycol-4000. Mgut was expressed as:
  where CMout is the outlet concentrations (nmol/ml) of metabolites corrected for water flux.
Mbile was expressed as  where CMbile is the bile concentrations (nmol/ml) of metabolites, and V is the volume of bile collected over a 30 min time period.
%Absorbed and %Metabolized were calculated as: 
 where Mtotal is the total amount of compound perfused over a 30-min time period.
Rates of metabolism in intestinal or liver microsomes were expressed as amounts of metabolites formed/min/mg protein or nmol/min/mg. If the Eadie-Hofstee plot was linear, formation rates (V) of isoflavone glucuronides at various substrate concentrations (C) were fit to the standard Michaelis-Menten equation:  where Km is the Michaelis constant and Vmax is the maximum formation rate. Rates of metabolism in microsomes were expressed as amounts of metabolite formed/min/mg protein or nmol/min/mg.
When Eadie-Hofstee plots showed characteristic profiles of atypical kinetics (autoactivation and biphasic kinetics) (Houston and Kenworthy, 2000; Hutzler and Tracy, 2002), the data from these atypical profiles were fit to eqs. 7, 8, or 9, using the ADAPT II program (D'Argenio and Schumitzky, 1997). To determine the best-fit model, the model candidates were discriminated using Akaike's information criterion (AIC) (Yamaoka et al., 1978), and the rule of parsimony was applied. Therefore, using this minimum AIC estimation, a negative AIC value (i.e., –54.2) would be considered a better representation of the data versus a set of data having a positive AIC value (i.e., 0.83) (H. Akaike, 1973).
With regard to microsome data showing autoactivation kinetics, formation rates (V) of isoflavone glucuronides at various substrate concentrations (C) were fit to the following equation:  where Vmax-0 is intrinsic enzyme activity, Vmax-d is maximum induction of enzyme activity, R is rate of enzyme activity induction, C is concentration of substrate, and Km is concentration of substrate to achieve 50% of (Vmax-0 + Vmax-d).
With regard to microsome data showing biphasic kinetics in which two isoforms with different affinity/capacity (Km) as well as glucuronidation velocity (Vmax) are responsible for the kinetic behavior, formation rates (V) of isoflavone glucuronides at various substrate concentrations (C) were fit to the following equation:  where Vmax1 is maximum enzyme velocity of one UGT isoform, Vmax2 is maximum enzyme velocity of another UGT isoform, Km1 is concentration of substrate to achieve 50% of (Vmax-0 + Vmax-d) for one UGT isoform, Km2 is concentration of substrate to achieve 50% of (Vmax-0 + Vmax-d) for another UGT isoform
When the microsomal reaction rates showed substrate inhibition kinetics (in which the substrate compound inhibits the glucuronidation velocity, especially at higher concentrations), formation rates (V) of isoflavone glucuronides at various substrate concentrations (C) were fit to the following equation:  where Vmax1 is maximum enzyme activity of UGT isoform, C is concentration of substrate, Km1 is concentration of substrate to achieve 50% of (Vmax) for one UGT isoform, and Ksi is substrate inhibition constant.
Statistical Analysis. General linear model (GLM) ANOVA, two-sample t tests, one-way ANOVA, and sub-sequential Tukey-Kramer multiple comparison tests (critical value = 4.1987) were used to analyze the data (NCSS, Kaysville, UT, 2001). The prior level of significance was set at 5%, or p < 0.05.
Results
Absorption Differences among Isoflavones in Different Regions of the Intestine. As expected from earlier studies of genistein, formononetin, and biochanin A (Chen et al., 2003, 2005a), some differences between regions of the intestine were expected for each isoflavone. In the present studies, we focus on how absorption of six isoflavones differed in each region of the intestine.
In duodenum, amounts of six isoflavones (genistein, daidzein, formononetin, glycitein, biochanin A, and prunetin) absorbed were significantly different from each other (p < 0.05; one-way ANOVA) (Fig. 2A). In addition, absorption of genistein and daidzein was significantly lower (p < 0.05; Tukey-Kramer test) than that of glycitein, prunetin, and biochanin A, absorption of formononetin was lower (p < 0.05, Tukey-Kramer) than that of biochanin A and prunetin, and absorption of glycitein was also lower (p < 0.05; Tukey-Kramer test) than that of biochanin A and prunetin (Fig. 2A).
In jejunum, absorption differences among six isoflavones were also significant (p < 0.05, one-way ANOVA) (Fig. 2A). More specifically, prunetin absorption in the jejunum was significantly higher (p < 0.05; Tukey-Kramer) than that of the other five isoflavones (Fig. 2A).
In terminal ileum, differences in absorption among six tested isoflavones were significant (p < 0.05, one-way ANOVA) (Fig. 2A). Absorption of three isoflavones, genistein, daidzein, and formononetin, was significantly lower than that of glycitein, biochanin A, and prunetin, whereas absorption of glycitein and biochanin A was also significantly lower than that of prunetin (Fig. 2A) (p < 0.05, Tukey-Kramer).
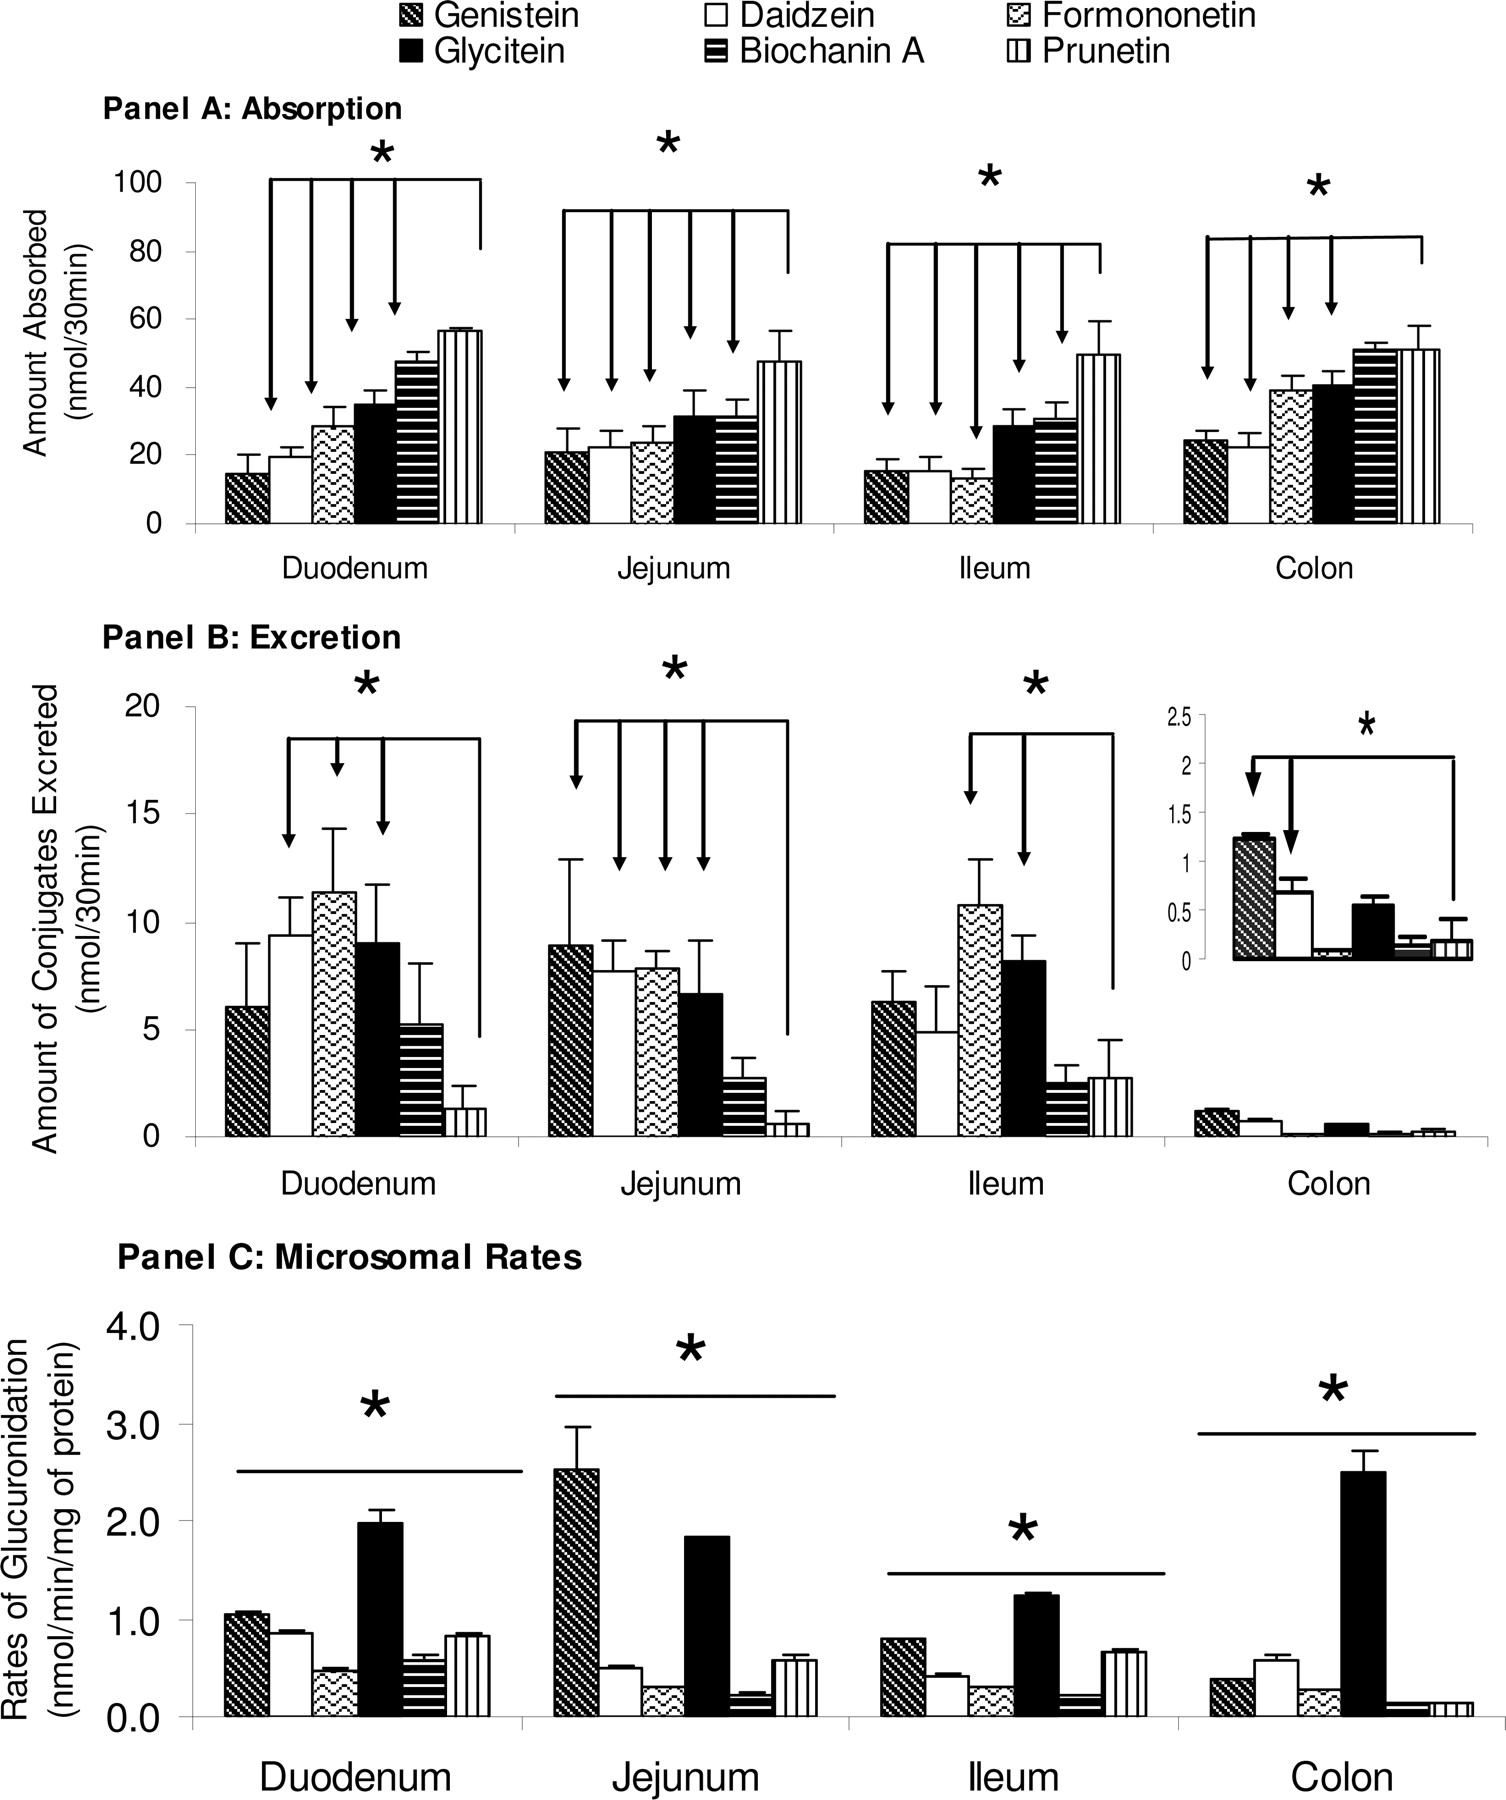
Amounts of pure aglycones absorbed (A) and amounts of conjugates excreted (B) in a four-site rat intestinal perfusion model (number of replicates, or n = 4). Perfusate containing 10 μM genistein (dark diagonal slashed columns), daidzein (solid white columns), formononetin (light curved columns), glycitein (solid black columns), biochanin A (dark horizontal slashed columns), and prunetin (dark vertical slashed columns), and four segments of the intestine (i.e., duodenum, upper jejunum, terminal ileum, and colon) were perfused simultaneously at a flow rate of 0.191 ml/min. Amounts absorbed and conjugates excreted, normalized to 10-cm intestinal length, were calculated using eqs. 1 to 3. Each column represents the average of four determinations and the error bar is the S.E.M. Significant differences in absorption and excretion for all four intestinal sites were found among the six isoflavones (p < 0.05, arrows). C, the calculated metabolism rate (V) at 10 μM concentration of these six isoflavones in rat duodenal, jejunal, ileal, and colonic microsomes (n = 3). The metabolism rate is the average of three determinations and the error bar represents the standard deviation of the mean. Significant differences between metabolism rates for all four intestinal microsomes were found among the six isoflavones (p < 0.05, one-way ANOVA marked by *).
In colon, differences in absorption among six tested isoflavones were also significant (p < 0.05, one-way ANOVA). Absorption of genistein and daidzein was significantly lower than that of glycitein, prunetin, formononetin, and biochanin A. Furthermore, absorption of formononetin and glycitein was significantly lower than that of biochanin A and prunetin, but significantly higher than that of genistein or daidzein (Fig. 2A). An interesting observation is that the colonic absorption of all isoflavones was usually the fastest or belonged to the fastest group in all four regions of the intestine we perfused (Fig. 2A).
We also analyzed these results using GLM ANOVA, which took into consideration the effects of intestinal site differences in our perfusion models, and showed that the amount of aglycones absorbed was significantly dependent (F ratio = 95.19, p = 0.000) on chemical structural differences for all isoflavone types.
Metabolic Differences among Isoflavones in the Intestine. Based on our previous studies of intestinal disposition of genistein, biochanin A, and formononetin (Chen et al., 2003, 2005a), we expected to observe some influence of isoflavone chemical structures on the metabolism of isoflavones in four regions of the intestine. Therefore, we measured the amounts of metabolites formed during perfusion studies.
In duodenum, differences in metabolic excretion among six tested isoflavones were significant (p < 0.05, one-way ANOVA) (Fig. 2B). Furthermore, excretion of daidzein, glycitein, and formononetin glucuronides was significantly higher (p < 0.05) than that of prunetin glucuronide (Fig. 2B).
In the jejunum, differences in metabolic excretion among six tested isoflavones were significant (p < 0.05, one-way ANOVA) (Fig. 2B). Furthermore, excretion of daidzein, glycitein, genistein, and formononetin glucuronides was significantly higher (p < 0.05) than that of prunetin glucuronide (Fig. 2B). In addition, excretion of genistein glucuronide was significantly higher (p < 0.05) than that of biochanin A glucuronide (Fig. 2B).
In the ileum, differences in metabolic excretion among six tested isoflavones were significant (p < 0.05, one-way ANOVA). Excretion of glycitein and formononetin glucuronides was significantly faster (p < 0.05) than that of prunetin and biochanin A glucuronides. In addition, formononetin glucuronide excretion was significantly faster than that of genistein glucuronide, although it was not different from the excretion of glycitein glucuronide.
In colon, differences in metabolic excretion among six tested isoflavones were also significant (p < 0.05, one-way ANOVA). Excretion of genistein glucuronide was significantly higher (p < 0.05) than that of the other five isoflavone glucuronides. The colonic excretion was particularly slow compared with excretion at the other three regions, and excretion of formononetin glucuronide was the slowest among the six isoflavones in the colon.
We also analyzed these results using GLM ANOVA, which took into consideration the effects of intestinal site differences in our perfusion models, and the analysis showed that the amount of glucuronide conjugates excreted was also significantly dependent on chemical structural differences between these isoflavone types (F ratio = 35.28, p = 0.000).
Metabolism of Isoflavones by Intestinal Microsomes Prepared from Different Regions. According to previous research by investigators from this and other laboratories, the main conjugation reaction of isoflavones such as genistein and biochanin A are expected to be glucuronidation via multiple isoforms of UGTs (Green et al., 1998; Cheng et al., 1999; Doerge et al., 2000; Chen et al., 2003; Jia et al., 2004).
In the present study, we determined the glucuronidation of these six isoflavones (10 μM each) using microsomes prepared from different regions of the rat intestine (i.e., duodenum, jejunum, ileum, and colon). Using duodenal microsomes, the results showed that glycitein was glucuronidated the fastest (1.96 ± 0.14 nmol/min/mg, p < 0.05), followed by genistein, daidzein, prunetin, biochanin A, and formononetin (1.04 ± 0.02, 0.85 ± 0.02, 0.82 ± 0.02, 0.57 ± 0.05 and 0.47 ± 0.01 nmol/min/mg, respectively) (Fig. 2C). In jejunal microsomes, the results showed that genistein was glucuronidated the fastest, followed by glycitein, prunetin, daidzein, formononetin, and biochanin A (2.53 ± 0.42, 1.83 ± 0.002, 0.58 ± 0.06, 0.50 ± 0.02, 0.29 ± 0.01, and 0.23 ± 0.01 nmol/min/mg, respectively) (Fig. 2C). In ileal microsomes, glycitein was glucuronidated at the fastest rate (p < 0.05), followed by genistein, prunetin, daidzein, formononetin, and biochanin A (1.24 ± 0.03, 0.79 ± 0.01, 0.66 ± 0.02, 0.42 ± 0.01, 0.29 ± 0.01, and 0.21 ± 0.01 nmol/min/mg, respectively). In colonic microsomes, glycitein again had the highest reaction rate, followed by daidzein, genistein, formononetin, biochanin A, and prunetin (2.50 ± 0.21, 0.58 ± 0.04, 0.38 ± 0.01, 0.27 ± 0.01, 0.14 ± 0.003, and 0.13 ± 0.02 nmol/min/mg, respectively) (Fig. 2C). Most strikingly, the metabolism of glycitein in the colonic microsomes was faster than those prepared from other regions.
Overall Patterns in Absorption and Metabolism among Isoflavones. To develop an overall understanding of the absorption, metabolism, and excretion processes, we should examine the graphic patterns of data presented in all three panels of Fig. 2. An analysis of the pattern showed that in duodenum perfusion, the absorption followed a “right” triangle pattern (increasing from genistein to prunetin), whereas the metabolite excretion followed a “bell-shaped” curve. However, the same analysis indicated that (duodenum) microsomal metabolism did not follow either pattern. If we analyzed these chemical structure effect diagrams as “patterns,” the results would indicate that chemical structural differences of isoflavones had different effects on absorption, metabolite excretion, and glucuronidation.
Kinetics of Isoflavone Glucuronidation by Intestinal Microsomes. In an effort to determine whether coupling of efflux transporters and metabolic enzymes is a critical process in the disposition of isoflavones, metabolic reaction rates of isoflavones were determined using rat intestinal microsomes at concentrations ranging from 0.625 to 50 μM. The results indicated that metabolism of these isoflavone compounds was saturable at higher concentrations (Fig. 3), and followed various kinetic patterns as described under Materials and Methods.

Glucuronidation rates of all six isoflavones in rat duodenal (A), ileal (B), and colonic (C) microsomes as a function of concentration (n = 3). Rates of metabolism were determined from 0.625 to 50 μM, and reaction time was 30 min. The metabolism rate is the average of three determinations and the error bar represents the standard deviation of the mean. The points are the observed isoflavone glucuronide formation rates, and the curves are estimated based on fitted parameters generated by the Michaelis-Menten equation (eq. 6) and other equations that describe various enzyme kinetics. The apparent kinetic parameters are listed in Tables 1, 2, 3, 4.
The majority of the metabolism can be described by a simple Michaelis-Menten equation, as shown in Tables 1, 2, 3, 4. In duodenum, glucuronidation of five isoflavones followed a simple Michaelis-Menten equation, whereas glucuronidation of glycitein followed an autoactivation pattern (Fig. 4). In general, isoflavones with higher CLint values had either higher Vmax (e.g., genistein) or lower Km values (prunetin) or both (glycitein) in the duodenal microsomes (Table 1).
Kinetic parameters of metabolism for genistein, daidzein, formononetin, glycitein, biochanin A, and prunetin by rat duodenal microsomes
Kinetic parameters of metabolism for genistein, daidzein, formononetin, glycitein, biochanin A and prunetin by rat jejunal microsomes
Kinetic parameters of metabolism for genistein, daidzein, formononetin, glycitein, biochanin A, and prunetin by rat ileal microsomes
Kinetic parameters of metabolism for genistein, daidzein, formononetin, glycitein, biochanin A, and prunetin by rat colon microsomes
In jejunum, glucuronidation of five isoflavones followed a simple Michaelis-Menten equation, whereas glucuronidation of biochanin A followed a biphasic pattern (Fig. 4). Overall, isoflavones with higher CLint values had either higher Vmax (e.g., glycitein) or lower Km values (prunetin), or both (biochanin A) in the jejunal microsomes (Table 2).
In ileum, two of the six compounds did not follow a simple Michaelis-Menten equation (Fig. 4) since isoflavones with higher CLint values in ileal microsomes had lower Km values (Table 3).
In colon, only three of the six isoflavones followed the simple Michaelis-Menten equation. In contrast, glucuronidation of genistein and daidzein followed a biphasic pattern, whereas that of glycitein followed autoactivation. Isoflavones with higher CLint values in colonic microsomes had lower Km values (Table 4).
In liver, the kinetics was more complicated. As in colon, glucuronidation of three isoflavones (daidzein, formononetin, and prunetin) followed that of a simple Michaelis-Menten equation (see Fig. 6). Glucuronidation of genistein and biochanin A followed a biphasic pattern, whereas that of glycitein followed substrate inhibition (Fig. 4). In general, isoflavones with higher CLint values had lower Km values (Table 4).
Biliary Excretion of Isoflavone Conjugates. Biliary excretion of isoflavone glucuronides was measured to determine whether glucuronidation rates in liver microsomes could predict their biliary excretion rates. Biliary excretion of all six isoflavone glucuronides was present. Excretion of three isoflavones (genistein, daidzein and glycitein, all soy isoflavones) increased from the 60-min sample time to the 120-min sample time, whereas excretion of the other three isoflavone glucuronides did not (Fig. 5A). Interestingly, the pattern of biliary excretion was similar to that of duodenal glucuronide excretion. In addition, the amount of conjugates excreted in the bile for these isoflavones all reached a peak at 120 min.
To account for this pattern of excretion, we measured hepatic metabolism rates at 1.25, 5, and 10 μM concentrations and determined intrinsic clearance as described previously (Fig. 6). As expected, the rate of metabolism of six isoflavones displayed a pattern that somewhat changed with concentrations (since IC values were different for each of the isoflavones tested). Interestingly, none of the metabolic rate patterns (Fig. 5B) match those of the biliary excretion rates (Fig. 5A).
Relationship between Amounts Excreted and Metabolism Rates, Intrinsic Clearance,Km, orVmax. If intestinal metabolism is always the rate-limiting step in the disposition of isoflavones, we should expect that the amounts of metabolites excreted in the intestine can be predicted by microsome-derived kinetic parameters (e.g., metabolism rates, intrinsic clearance, Km,or Vmax). In other words, faster metabolism (by microsomes) would translate into higher amounts of intestinal metabolite excretion. Conversely, if coupling of efflux transporters and metabolic enzymes governs the intestinal disposition of isoflavones, then we expect that microsome-derived kinetic parameters will fail to predict the amounts of metabolites excreted in the intestine.
Simple X-Y linear plots were made between various kinetic parameters determined from our microsomal studies (i.e., intrinsic clearance, CLint) and the amount of conjugate efflux into the intestinal lumen from our perfusion studies (Fig. 7). From these plots, it is evident that intestinal CLint values, Km, Vmax, or calculated rates of metabolism at 10 μM (from rat intestinal and liver microsomes studies) cannot predict or correlate with the amount of conjugate metabolites excreted from four-site rat intestinal perfusion studies. Similarly, a plot of the glucuronidation kinetic parameters using liver microsomes and amount of metabolites excreted by liver into the bile also did not produce any correlation (results not shown, although it is obvious from examining Fig. 5).
Discussion
Poor oral bioavailability in humans has limited the development potentials of isoflavones and other flavonoids as chemopreventive agents (Birt et al., 2001; Setchell et al., 2001; Yang et al., 2001). Although it is generally believed that the main site of flavonoid metabolism is the liver (Kurzer and Xu, 1997), as evidenced by large amounts of conjugates in bile and/or feces (Xu et al., 1995; King et al., 1996), recent investigations have showed that the intestine is a major organ responsible for the metabolism of isoflavones via phase II conjugation, and for subsequent excretion of phase II conjugates (Crespy et al., 1999; Walle et al., 1999; Andlauer et al., 2000a,b; Liu and Hu, 2002; Chen et al., 2003, 2005b; Jia et al., 2004).
In contrast to their low bioavailability, isoflavones have reasonable apparent half-lives in the range of several hours (3–7 h) (Setchell et al., 2003, 2005). To explain this apparent discrepancy, we recently proposed a hypothesis of a duo recycling scheme, where coupling of efflux transporters and conjugating enzymes (or “enzyme-transporter coupling”) in the gut enables enteric recycling (Jeong et al., 2005). Hence, the present study represents our continuing effort to improve our understanding of the disposition of isoflavones. In other words, the present studies will determine the importance of coupling between efflux transporters and metabolic enzymes in the intestinal disposition of isoflavones and also show how structural differences affect the intestinal and hepatic excretion of isoflavone conjugates.
We first determined how absorption of isoflavones changes with their structure. The results indicated that absorption favors isoflavones with a methoxyl group. Therefore, two isoflavones that do not have methoxyl groups (genistein and daidzein) are absorbed the least (in duodenum and colon) or belong to the group with the least amount of absorption (in jejunum and ileum). Absorption of prunetin was always the highest compared with all other isoflavones, whereas absorption of other isoflavones with methoxyl groups (formononetin, glycitein, and biochanin A) tends to vary in different regions of the intestine (Fig. 2). Because genistein was considered to be well absorbed in the perfusion model when its permeability was compared with compounds such as propranolol (Liu et al., 2003; Hu and Chen, 2004), all six isoflavones were expected to be well absorbed. However, the mechanisms responsible for varied absorption among six isoflavones are not well understood. Published studies indicated that BCRP may play a role in limiting the uptake of isoflavones in that many isoflavones probably bind with BCRP because they are potent inhibitors of BCRP-mediated uptake or transport (Zhang et al., 2005). However, the effects of isoflavone structures on the BCRP-mediated isoflavone transport are not well elucidated. Therefore, further studies in this area may be needed to determine why transport of these six isoflavones is different.

Eadie-Hofstee plots were generated to determine which equation to use for data fitting. Although the majority of the metabolism can be described by a simple Michaelis-Menten equation, autoactivation, biphasic saturation, and substrate inhibition kinetics were observed. The metabolism rate is the average of three determinations and the error bar represents the standard deviation of the mean.
Because poor absorption is not the reason why isoflavones have poor bioavailability, we next analyzed their metabolism and disposition. Because microsomal metabolism rates represented only the capability to glucuronidate isoflavones, we will first analyze how structural differences affected these rates. The results indicated that metabolism of six isoflavones (10 μM) followed a similar pattern in duodenum and jejunum, but those patterns were different from those in jejunum and colon (Fig. 2C). Similarly, the effects of concentration on metabolism of genistein in three different regions of the intestine did not follow the same pattern (Fig. 3), nor did jejunal and hepatic metabolism of these isoflavones (Chen et al., 2005b). To further assess whether structural differences in isoflavones affected its intestinal disposition in an intact physiological system, excretion rates of isoflavones at a concentration of 10 μM were analyzed to decipher specific patterns using an in situ perfusion model.
Metabolite excretion data from the perfusion studies indicate that structure differences could play a major role in the intestinal disposition of isoflavones. In particular, the disposition profile of prunetin seemed to support this possibility. The structure of prunetin is different from that of the other five isoflavones in that it does not have the free 7-hydroxy group. In Caco-2 cells, this structural characteristic decreased its metabolism in the subcellular fraction or cell lysate (Chen et al., 2005a). In rat colonic microsomes, metabolism of prunetin was also among the slowest (Fig. 2B). However, in rat small intestinal microsomes, glucuronidation rates of prunetin were quite rapid (Tables 1, 2, 3, 4). In fact, analysis of three kinetic parameters, Km, Vmax, and CLint, show that prunetin consistently ranked second in determining the highest Vmax, CLint, and affinity (lower Km) in all intestinal microsomes. These results suggest that UGT isoforms responsible for its metabolism in rat small intestine are different from those in the rat colon and human Caco-2 cells. According to published studies, UGT expression and induction is indeed tissue-specific, which may represent the physiological basis for site-specific glucuronidation patterns (Grams et al., 2000). Therefore, it is likely that each of the six isoflavones used in this study is predominantly glucuronidated by a different UGT isoform available in a particular intestinal site. For example, by using rat UGT isoforms expressed in yeast strain AH22 (Daidoji et al., 2005), we have recently demonstrated in our laboratory that genistein is possibly metabolized predominantly by UGT1A7 (unpublished data). UGT1A7 is strongly expressed in the small intestine but poorly expressed in the large intestine (Grams et al., 2000), which is consistent with our microsomal metabolism of genistein (Fig. 2C).

A, biliary excretion of glucuronides for genistein, daidzein, formononetin, glycitein, biochanin A, and prunetin, from 60 to 150 min. B, hepatic metabolism rates at 1.25, 5, and 10 μM concentrations and determined intrinsic clearance for all six isoflavones.

The intrinsic clearance values for genistein, daidzein, formononetin, glycitein, biochanin A, and prunetin metabolism from microsomes (n = 3) of all four sites of the intestine.
The above analysis clearly indicates that the UGT expression pattern and chemical structures of the isoflavones affect their microsomal metabolism. Classical metabolism literature would then often make the conclusion that prunetin will be metabolized faster than many isoflavones in the gut, since most studies of glucuronidation are conducted using microsomes. In other words, intestinal metabolism is often assumed to be the rate-limiting step in drug disposition. Whereas this is often quite useful in determining the metabolism via a cytochrome P450-catalyzed reaction, its value in predicting UGT-catalyzed metabolism had a very mixed record (Lin and Wong, 2002; Miners et al., 2004). Our intestinal excretion data continued to lend support to the notion that coupling of efflux transporters and metabolic enzymes could be the rate-limiting step in the intestinal disposition of isoflavones. In addition to this, the process of coupling could be a key step responsible for the elimination of metabolic products (from phase II UGT reactions) that are highly hydrophilic and cannot penetrate the cellular membrane by passive diffusion. Furthermore, microsomal metabolism alone is not a good predictor of phase II metabolite production by intestinal or liver cells. Therefore, the use of microsomal data for drug-drug interactions has been shown to be of very limited value to predict drug-drug interaction (Williams et al., 2004).
In addition to the fact that structural changes have different effects on prunetin metabolism and intestinal excretion, other factors also have shown that coupling of efflux transporters and metabolic enzymes could be the rate-limiting step in the intestinal disposition of isoflavones. For example, excretion of isoflavone glucuronides in the colon for several isoflavones is much (p < 0.05) lower (often more than 10-fold) than that in the other three small intestinal sites (Fig. 2B), even though their metabolism rates are sometimes higher (e.g., glycitein) or only slightly lower (e.g., daidzein) (Fig. 2C). This suggests that the large intestine is probably deficient in certain efflux transporter(s) that are capable of pumping out the hydrophilic phase II metabolites. The possibility that phase II conjugates are effluxed via the basolateral side is unlikely, since previous studies in Caco-2 cells have shown similar excretion patterns in apical and basolateral excretion (Chen et al., 2005a), in that higher apical excretion of glucuronides is corroborated by higher basolateral excretion. A search from published studies suggests that the multidrug resistance protein (MRP2) could be the main (but not the only) apical efflux transporter responsible for glucuronide efflux (Takano et al., 2006). Western blotting and immunohistochemical staining have shown that MRP2 is highly expressed in the jejunum but gradually decreases toward the distal ileum (Mottino et al., 2000; Rost et al., 2002). For example, in duodenum, jejunum, ileum, and colon of rats, the expression of MRP2 mRNA levels was shown to follow the ratio of 75:100:50:5 (Rost et al., 2002). Additional efflux transporters on the apical and basolateral sides have been proposed, including other MRP and organic anion transporters (Hu et al., 2003; Chen et al., 2005a).
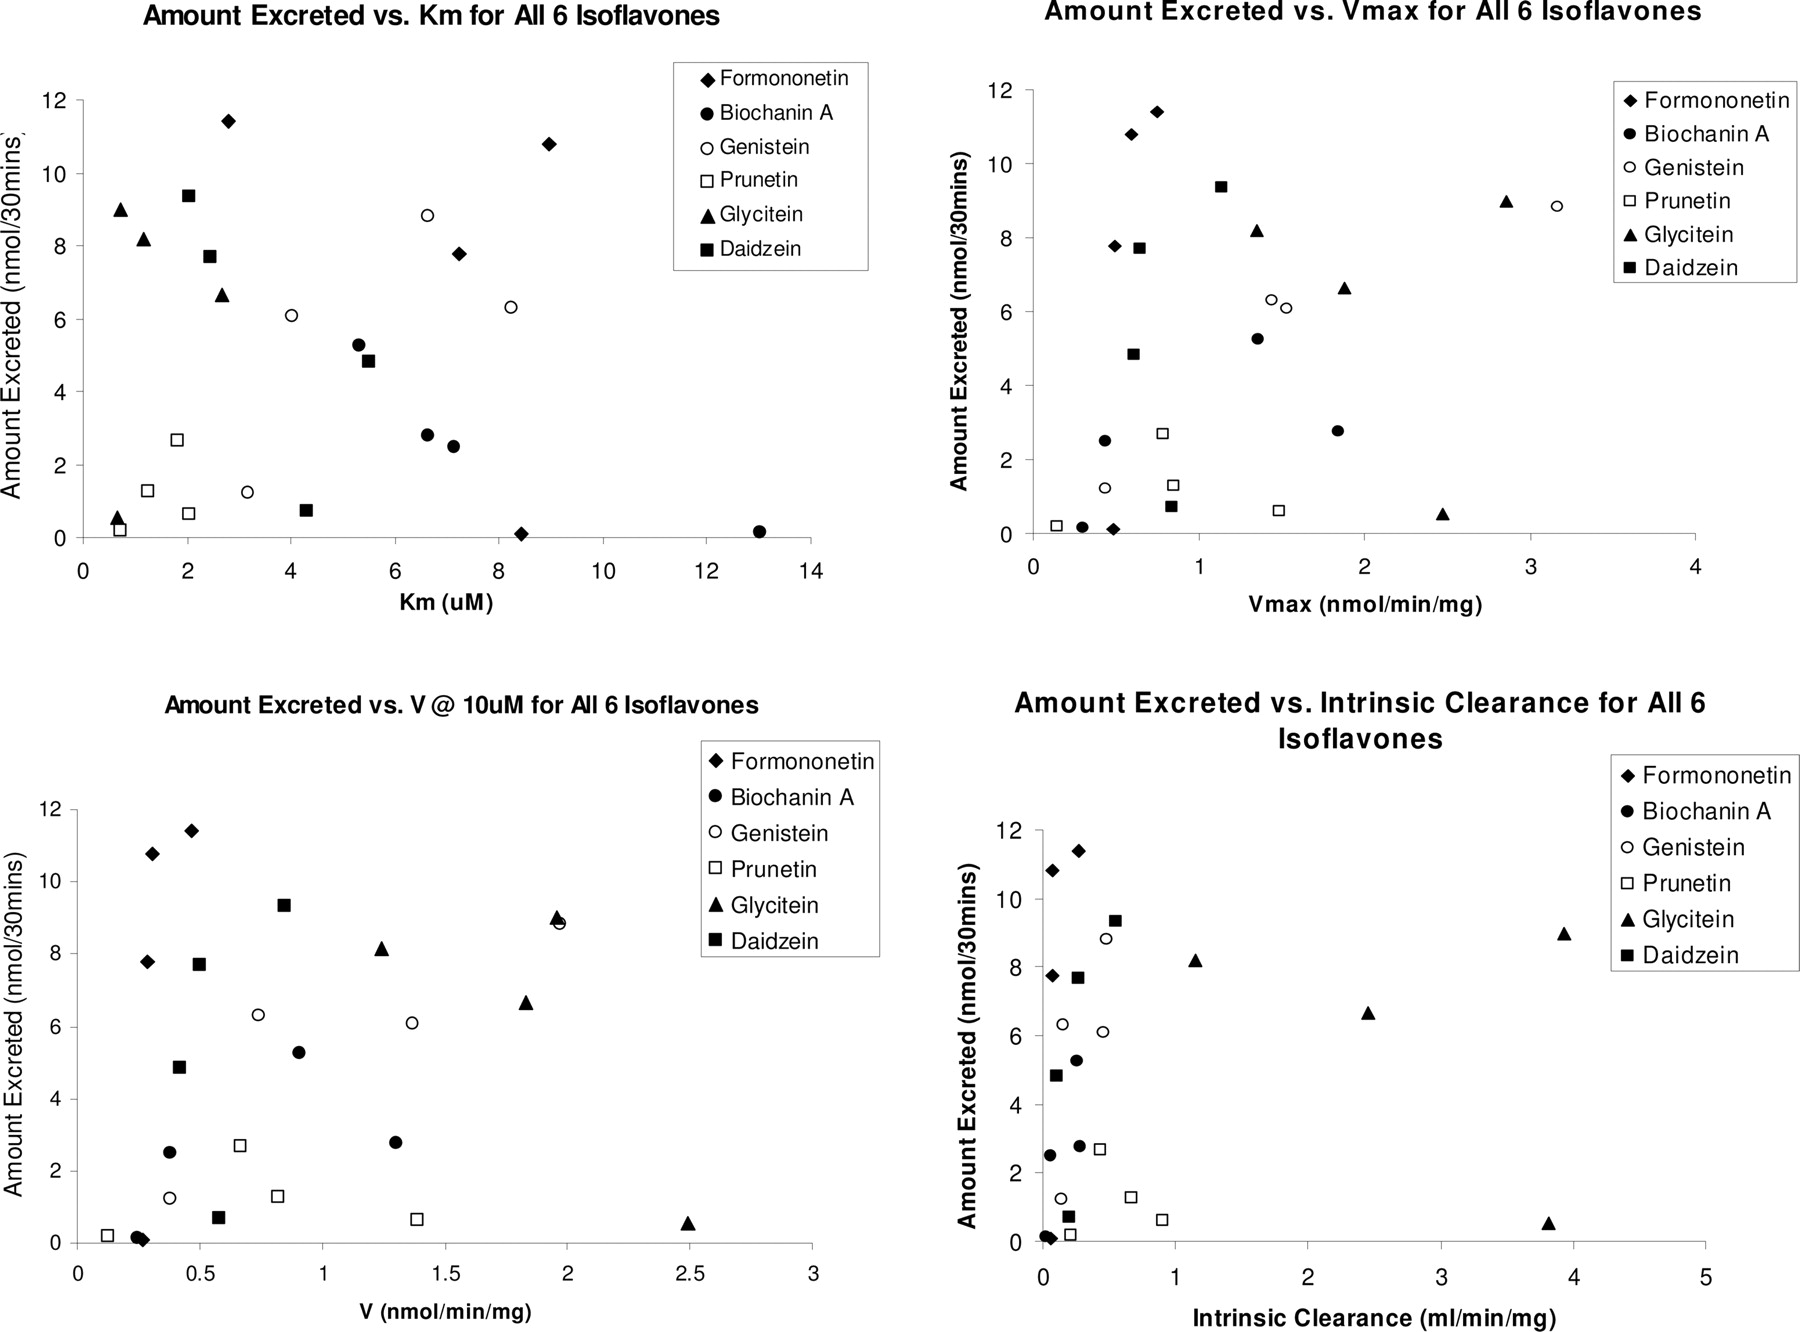
The intrinsic clearance values, Km, Vmax, and calculated rates of metabolism at 10 μM (from rat intestinal and liver microsomes studies) from the microsome model plotted against the average amount of the six isoflavone metabolites excreted in the four-site rat intestinal perfusion model. No correlation of any type is found between these kinetic parameters and that of the amount of conjugated metabolites excreted (from four-site rat intestinal perfusion studies).
Taken together, the coupling of efflux transporters and metabolic enzymes determines the intestinal disposition of isoflavones, suggesting that the relationship between intestinal metabolism via conjugating enzymes such as UGTs and intestinal metabolite excretion is more complicated than the uncoupled sequential processes to which we once assigned them. Although some literature often assumed that UGT glucuronidation rates in vitro could have predictive abilities with metabolite excretion, our data with isoflavone glucuronidation clearly did not support this presumption (Fig. 7). Therefore, the intestinal metabolite formation (as measured by microsomal reaction rates) alone is not sufficient to determine the metabolic disposition of isoflavones, and probably of many other drugs that are extensively metabolized (e.g., raloxifene). This is because there is no direct positive correlation between various kinetic parameters (e.g., CLint, Km) derived from microsomes and the amount of conjugated metabolites excreted into the intestine or bile from our perfusion results (Fig. 7).
More importantly, a clinically relevant question is whether a direct positive correlation exists between the microsome-derived kinetic parameters and the absolute bioavailability of isoflavones. A search in the literature shows that bioavailability data in rats are only available for genistein (Coldham et al., 2002; Mallis et al., 2003), daidzein (Lamartiniere et al., 2002; Mallis et al., 2003), and biochanin A (Mallis et al., 2003). With respect to our microsome-derived kinetic parameters, no correlation can be made with the bioavailability data from these in vivo studies. From our data, it is clear that metabolite excretion cannot be predicted by kinetic parameters derived from microsomes, which supports the notion that coupling determines disposition of isoflavones. Hence, intestinal sites with a higher enzymatic activity (to biotransform isoflavones) will not necessarily translate into larger amounts of intestinal excretion of their metabolites. Although one can argue that this discrepancy is due to basolateral efflux, which we did not measure in the perfusion model, our studies using the Caco-2 cell culture model have not indicated strong polarity in enterocyte excretion of phase II conjugates (Hu et al., 2003; Jeong et al., 2004; Chen et al., 2005a). In rat intestinal models, amounts excreted to the luminal side were actually higher than those to the serosal side (Andlauer et al., 2000a,b). In summary, there is little evidence in our investigations that metabolism rates derived from intestinal microsomes can predict intestinal phase II metabolite excretion.
What is the value of determining glucuronidation rates using microsomes, when they cannot predict metabolism in vivo or even in situ? We believe that this method is still valuable in three areas. First, it will allow us to predict the metabolic pathway of a compound. In other words, the in vitro studies would predict that isoflavone glucuronides will be present in vivo, and probably in significant quantities. Second, it allows us to delineate the fact that transporter(s) that control(s) the excretion of hydrophilic phase II conjugates may serve as the rate-limiting step, although this will not be entirely clear until the results from a cellular model are available. Third, it allows us to determine the kinetic mechanisms of glucuronidation (e.g., autoactivation) (Fig. 4), which is very important in describing the mechanisms of reactions and perhaps drug-drug interactions. In cases where metabolism is the rate-limiting step, it could help delineate what are the important factors to study and at which concentration.
However, we should not overstate the value of microsomal-derived parameters. The fact that they fail to predict excretion of six isoflavones, even though these compounds only had limited structural diversity, is disconcerting. A closer analysis showed that they cannot even predict the rank order. Therefore, the more important question is: how do we predict what could happen in humans in vivo with in vitro methods? Some have argued for the use of intact cells, which is very difficult to do and is expensive. Supplies of human hepatocytes are limited and viability is always an issue. Conversely, human enterocytes are not available. We believe in an alternative approach, which is to first understand what makes a phase II conjugate a good substrate for efflux so that we can better predict the overall efflux mechanism of these hydrophilic compounds. The latter will allow us to determine how to predict whether a phase II conjugate will be slowly or rapidly effluxed by intestinal, hepatic, and renal cells.
In conclusion, our studies indicate that the amount of conjugated metabolites effluxed into the intestine was dependent on the coupling between phase II enzymes and efflux transporters. The rates, amounts, and capacities of intestinal and hepatic metabolism of isoflavones (derived from microsomes) are indeterminate of their excretion profiles from intact intestinal and liver cells. The evidence from our studies strongly argues for the need to incorporate specific efflux transporters that are involved in the excretion of hydrophilic phase II conjugates into the determination of phase II metabolism rates. Future studies should focus on how phase II metabolites are effluxed to derive in vitro models to better predict phase II metabolism in vivo.
Footnotes
-
This work is supported by a grant from the National Institutes of Health (CA87779) to M.H. X.J. was funded by a training grant from Jiangsu Province, The People's Republic of China. Some work was started at Washington State University, where this laboratory was based.
-
Article, publication date, and citation information can be found at http://dmd.aspetjournals.org.
-
doi:10.1124/dmd.106.009910.
-
ABBREVIATIONS: MRP, multidrug resistance-associated protein; HPLC, high-performance liquid chromatography; UGT, UDP-glucuronosyltransferase; AIC, Akaike's information criterion; GLM, general linear model; ANOVA, analysis of variance; CLint, intrinsic clearance; BCRP, breast cancer resistance protein.
-
↵1 Current affiliation: Department of Pharmaceutical Sciences, College of Pharmacy, The University of Michigan, Ann Arbor, MI.
- Received February 27, 2006.
- Accepted July 26, 2006.
- The American Society for Pharmacology and Experimental Therapeutics


