


Abstract
The in vitro metabolism of [14C]bicifadine by hepatic microsomes and hepatocytes from mouse, rat, monkey, and human was compared using radiometric high-performance liquid chromatography and liquid chromatography/tandem mass spectrometry. Two main metabolic pathways were identified in all four species. One pathway was an NADPH-dependent pathway in which the methyl group was oxidized to form a hydroxymethyl metabolite (M2). Its formation was inhibited in human microsomes only by quinidine, a CYP2D6 inhibitor. In incubations with individual cDNA-expressed human cytochromes P450, M2 was formed only by CYP2D6 and CYP1A2, with CYP2D6 activity 6-fold greater than that of CYP1A2. M2 was oxidized further to the carboxylic acid metabolite (M3) by hepatocytes from all four species. The second major metabolic pathway was an NADPH-independent oxidation at the C2 position of the pyrrolidine ring, forming a lactam metabolite (M12). This reaction was almost completely inhibited in human hepatic microsomes and mitochondria by the monoamine oxidase (MAO)-B-specific inhibitor selegiline. Clorgyline, a specific inhibitor of MAO-A, was less effective in inhibiting M12 formation. Other metabolic pathways of variable significance among the four species included the formation of carbamoyl-O-glucuronide, hydroxymethyl lactam, and carboxyl lactam. Overall, the data indicate that the primary enzymes responsible for the primary metabolism of bicifadine in humans are MAO-B and CYP2D6.
Bicifadine [(±)-1-(4-methylphenyl)-3-azabiocyclo[3.1.0]hexane hydrochloride; DOV 220,075 HCl; Fig. 1], an inhibitor of norepinephrine and serotonin uptake, is being developed for the treatment of acute and chronic pain. Bicifadine is a non-narcotic analgesic (Epstein et al., 1982) that is active in models of neuropathic pain with no evidence of abuse liability potential (Basile et al., 2007). Clinically, it has been shown to be effective in the treatment of acute dental pain (Stern et al., 2005) and bunionectomy pain (Riff et al., 2006). Bicifadine was also reported to be as effective as the standard of care in reducing chronic lower back pain (Stern et al., 2006).
To interpret the significance of preclinical and toxicological investigations to humans, it is important to understand the metabolism of bicifadine and to demonstrate that the toxicology species are exposed to the same metabolites that occur in humans. Consequently, in vitro metabolism studies using hepatic microsomes and hepatocytes from mice, rats, monkeys, and humans were conducted using [14C]bicifadine. The metabolic profiles of [14C]bicifadine were compared in the four species using hepatic microsomes and hepatocytes. Additionally, the principal enzymes responsible for the metabolism of [14C]bicifadine were identified to determine the potential for bicifadine to be involved in drug-drug interactions.
During the course of the investigations, evidence was generated demonstrating that the formation of the main metabolite, a lactam, involved the action of an MAO, primarily MAO-B. Data are presented demonstrating that liver microsomes, in addition to mitochondria, have a high capacity for this reaction.
Materials and Methods
Chemicals. [14C]Bicifadine (44 mCi/mmol; 254 μCi/mg) was supplied by Vitrax Company (Placentia, CA); its radiochemical purity was >99% by HPLC. A reference standard of bicifadine was supplied by DOV Pharmaceutical Inc. (Somerset, NJ). Clorgyline, selegiline, phthalazine, phthalazinone, and perphenazine were obtained from Sigma-Aldrich (St. Louis, MO). All other chemicals and solvents were obtained from commercial sources, and they were of the highest quality available.
Enzyme Preparations. Hepatic microsomes from male CD-1 mice, male Sprague-Dawley rats, and male cynomolgus monkeys were obtained from BD Biosciences (Woburn, MA). Pooled hepatic microsomes from male and female humans were obtained from CellzDirect (Pittsboro, NC) or from Tissue Transformation Technologies (Edison, NJ). Pooled human liver mitochondria from three male and three female donors were obtained from XenoTech, LLC (Lenexa, KS). Isolated fresh primary hepatocytes from male mouse, male rat, male monkey, and human were supplied by CellzDirect. The human donor was a 54-year-old nonsmoking female with no known history of exposure to hepatitis B or C or human immunodeficiency virus. Recombinant (cDNA-expressed) human cytochromes P450, MAO-A, and MAO-B (Supersomes, microsomes prepared from baculovirus-infected BTI-TN-5B1-4 insect cells) were obtained from BD Biosciences.

Structure of bicifadine HCl. The asterisk marks the position of the 14C radiolabel.
Incubations.Microsomal P450 activity. Hepatic microsomal incubations were performed in 100 mM phosphate buffer containing 1 mM EDTA and 3 mM MgCl2, pH 7.4, at a final assay volume of 1 ml and microsomal protein concentration of 0.25 mg/ml. Incubations were performed at 37°C, and they contained 1 mM NADPH and 10 μM bicifadine. Bicifadine and [14C]bicifadine were combined to maintain radioactivity levels at approximately 1 × 10⁶ dpm/ml. Incubations were initiated by the addition of 10 μl of a 100-fold concentrated solution of [14C]bicifadine. Incubations were terminated at 0, 5, 10, 20, and 30 min by the addition of 2 ml of ice-cold acetonitrile. Control incubations were performed as described above at 0 and 30 min in the absence of NADPH. Heat-inactivated microsomes were prepared by heating in boiling water for 10 min. Terminated incubation samples were mixed, and the protein was removed by centrifugation at 1400g for 10 min at 4°C. The supernatants were stored at approximately –20°C until analysis. When appropriate, P450-specific inhibitors were added at the following concentrations: 10 μM α-naphthoflavone (CYP1A2), 5 μM sulfaphenazole (CYP2C9), 25 μM omeprazole (CYP2C19), 10 μM quinidine (CYP2D6), 100 μM S-methyl N,N-diethylthiolcarbamate (CYP2E1), and 1 μM ketoconazole (CYP3A4). Similar assay conditions were used for cDNA-expressed P450s except that they were used at a final assay concentration of 50 pmol P450/ml, with an incubation time of 30 min only. Vector control samples testing for inherent P450 metabolic activity were performed in the presence and absence of NADPH with Supersomes prepared from insect cells (BTI-TN-5B1-4) treated with vector only (no cDNA). Control incubations were performed in the presence and absence of NADPH with each set of control Supersomes for 30 min. CYP2A6 and CYP2C9 were run in Tris-HCl buffer per manufacturer's recommendations. Vector controls for these isozymes were also run with Tris buffer.
MAO assay in mitochondria/microsomes. Incubations were performed as described above with the following modifications. The final protein concentrations in the assays were 0.5 mg/ml for microsomes, 1.0 mg/ml for mitochondria, or 1.0 mg/ml for cDNA expressed MAO-A and MAO-B. When appropriate, 1 to 1000 nM (final concentrations) of clorgyline or selegiline was added to incubations, and they were incubated for 20 min before the addition of a 100-fold concentrated solution of [14C]bicifadine.
Aldehyde oxidase assay in mitochondria/microsomes/cytosol. Incubations were performed as described above with the following modifications. The final protein concentration in the assay using cytosol was 1 mg/ml. When appropriate, 1 μM (final concentration) of perphenazine was added to incubations, and it was incubated for 15 min before the addition of a 100-fold concentrated solution of [14C]bicifadine (1 μM final concentration) or phthalazine (10 μM final concentration). Analytical conditions for phthalazine oxidase were as described by Obach (2004).
Hepatocytes. The fresh hepatocyte suspensions were reconstituted per supplier's recommendations into Williams' E medium at a hepatocyte density of approximately 0.75 × 10⁶ cells/ml. Hepatocyte viability, based on trypan blue exclusion, was 85.5, 87.0, 89.8, and 73.8% for mouse, rat, monkey, and human hepatocytes, respectively. Metabolic capacity of hepatocytes was assessed throughout the 180-min incubation period by monitoring their ability to metabolize 7-ethoxycoumarin. P450, uridine diphosphoglucuronic acid transferase, and sulfotransferase activities were active over 180 min for all four species. The cells were preincubated for 30 min in an incubator set to maintain 37°C in an atmosphere of 5% CO2 in air. Reactions were initiated by adding 10 μl of the appropriate [14C]bicifadine fortification solution. Incubations were terminated at 0, 60, and 180 min by adding 2 ml of acetonitrile. For the time 0 incubations, the hepatocyte suspension was cooled on ice for 10 min, 10 μl of the appropriate fortification solution was added, and then 2 ml of acetonitrile was added. Terminated incubation samples were vortex mixed, and the protein was removed by centrifugation at 1400g for 10 min at 4°C. The supernatants were stored at –20°C until analysis. Control incubations were conducted at all time points by incubating the appropriate concentrations of [14C]bicifadine in Williams' E medium in the absence of hepatocytes.
HPLC Analysis. Acetonitrile extracts from microsomal or hepatocyte incubations were mixed, concentrated to dryness using a stream of nitrogen, and reconstituted with 500 μl of 0.1% formic acid/acetonitrile [9:1 (v/v)]. The samples were then mixed, sonicated for 20 to 25 min, and analyzed by HPLC. Analysis was performed on an Alltech Prevail C18 column (4.6 × 150 mm, 5-μm particle size; Alltech Associates, Deerfield IL) preceded by a Phenomenex SecurityGuard C18 guard column (4 × 3 mm; Phenomenex, Torrance CA). The column was interfaced with a Packard Series A-500 radioactivity detector equipped with a 0.5-ml TRLSC flow cell (PerkinElmer Life and Analytical Sciences, Meriden, CT). The liquid scintillation flow rate was 3 ml of Ultima Flo M/min (PerkinElmer Life and Analytical Sciences). For most experiments, mobile phase A was 0.05% formic acid in water, mobile phase B was acetonitrile, and the flow rate was 1 ml/min. For metabolite identification, the initial mobile phase of 97:3 A/B was increased linearly to 90:10 A/B from 5 to 7 min and held constant until 25 min. The mobile phase was then increased linearly to 5:95 A/B from 25 to 36 min; after another 9 min, it was reequilibrated to 97:3 A/B. For experiments using P450 inhibitors and cDNA-expressed enzymes, the initial gradient was 95:5 A/B; after 2 min, it was increased linearly to 50:50 A/B at 25 min. The mobile phase was increased to 10:90 A/B to remove any residual material, and then it was re-equilibrated to 95:5 A/B.
LC/MS/MS Analysis. For metabolite identification, the LC/MS/MS studies were conducted using a Shimadzu LC system controller and pumps (models SCL-10A VP and LC-10AD VP, respectively; Shimadzu, Kyoto, Japan). A Phenomenex Luna C18 HPLC column was used with the same mobile phases A and B and acetonitrile gradient as used for metabolite separation described above. After passing through a column switcher, the HPLC column effluent was split, with approximately 30% of the flow diverted to the mass spectrometer (Micromass Quattro II with an ESP Z-Spray source in the positive ion mode; Micromass Co., Manchester, UK) and 70% to the radiometric detector (2.1 ml of Packard Ultima-Flo M LSC cocktail/min). MS settings were as follows: cone voltage, 10 to 28 V; mass range, 40 to 600 amu; scan time, 0 to 40–45 min; source block temperature, 130°C; desolvation temperature, 300°C; electrospray ionization nebulizer gas, 15 l/h (N2); and bath gas, 400 l/h (N2). The product ion LC/MS/MS analyses used the same instrumentation and conditions as for the full-scan LC/MS analyses with the following exceptions to the MS conditions: cone voltage, 22 V; collision energy, 15 to 24 eV; and collision gas, argon.
For the P450 reaction phenotyping experiments with bicifadine lactam, analyses were performed using a Shimadzu LC system controller and pumps (models SIL-HTc and LC-10AD VP, respectively). The HPLC columns, mobile phases, and acetonitrile gradient were the same as used for metabolite separation described above. After passing through a column switcher, the HPLC column effluent was split, with approximately 30% of the flow diverted to the mass spectrometer (Micromass Quattro II with an ESP Z-Spray source in the positive ion mode) and 70% to the radiometric detector (2.1 ml of Packard Ultima-Flo M LSC cocktail/min). MS settings were as follows: cone voltage, 10 to 28 V; mass range, 40 to 600 amu; scan time, 0 to 40 to 45 min; source block temperature, 130°C; desolvation temperature, 300°C; electrospray ionization nebulizer gas, 15 l/h (N2); and bath gas, 400 l/h (N2).
Results
Comparative Metabolism of [14C]Bicifadine. [14C]Bicifadine was incubated with hepatic microsomes and hepatocytes from mouse, rat, monkey, and human. There were 16 radiolabeled peaks other than [14C]bicifadine that were observed among the incubations. Discrete metabolic peaks are labeled on radiochromatograms according to their order of elution. Representative radiochromatograms displaying metabolite profiles for the microsomes and hepatocytes are presented in Figs. 2 and 3, respectively, and the percentages of total radioactivity attributed to each of the metabolites are listed in Tables 1 and 2. Due to the high specific activity of the [14C] used in the experiments, the protonated molecular ion and the radiolabel-containing product ions were 2 amu higher than that of the nonradioactive compound.
Metabolism of [14C]bicifadine by mouse, rat, monkey, and human hepatic microsomes
Microsomes were incubated with 10 μM [14C]bicifadine for 30 min with and without NADPH as described under Materials and Methods. The formation of the products was measured using HPLC with radioflow detection. The numbers are the percent of the radiochromatogram.
Metabolism of [14C]bicifadine by mouse, rat, monkey, and human hepatic hepatocytes
Isolated hepatocytes (0.75 × 10⁶ cells/ml) were incubated with 10 μM [14C]bicifadine with an atmosphere of 5% CO2 at 37°C for 60 and 180 min as described under Materials and Methods. The formation of the products was measured using HPLC with radioflow detection.
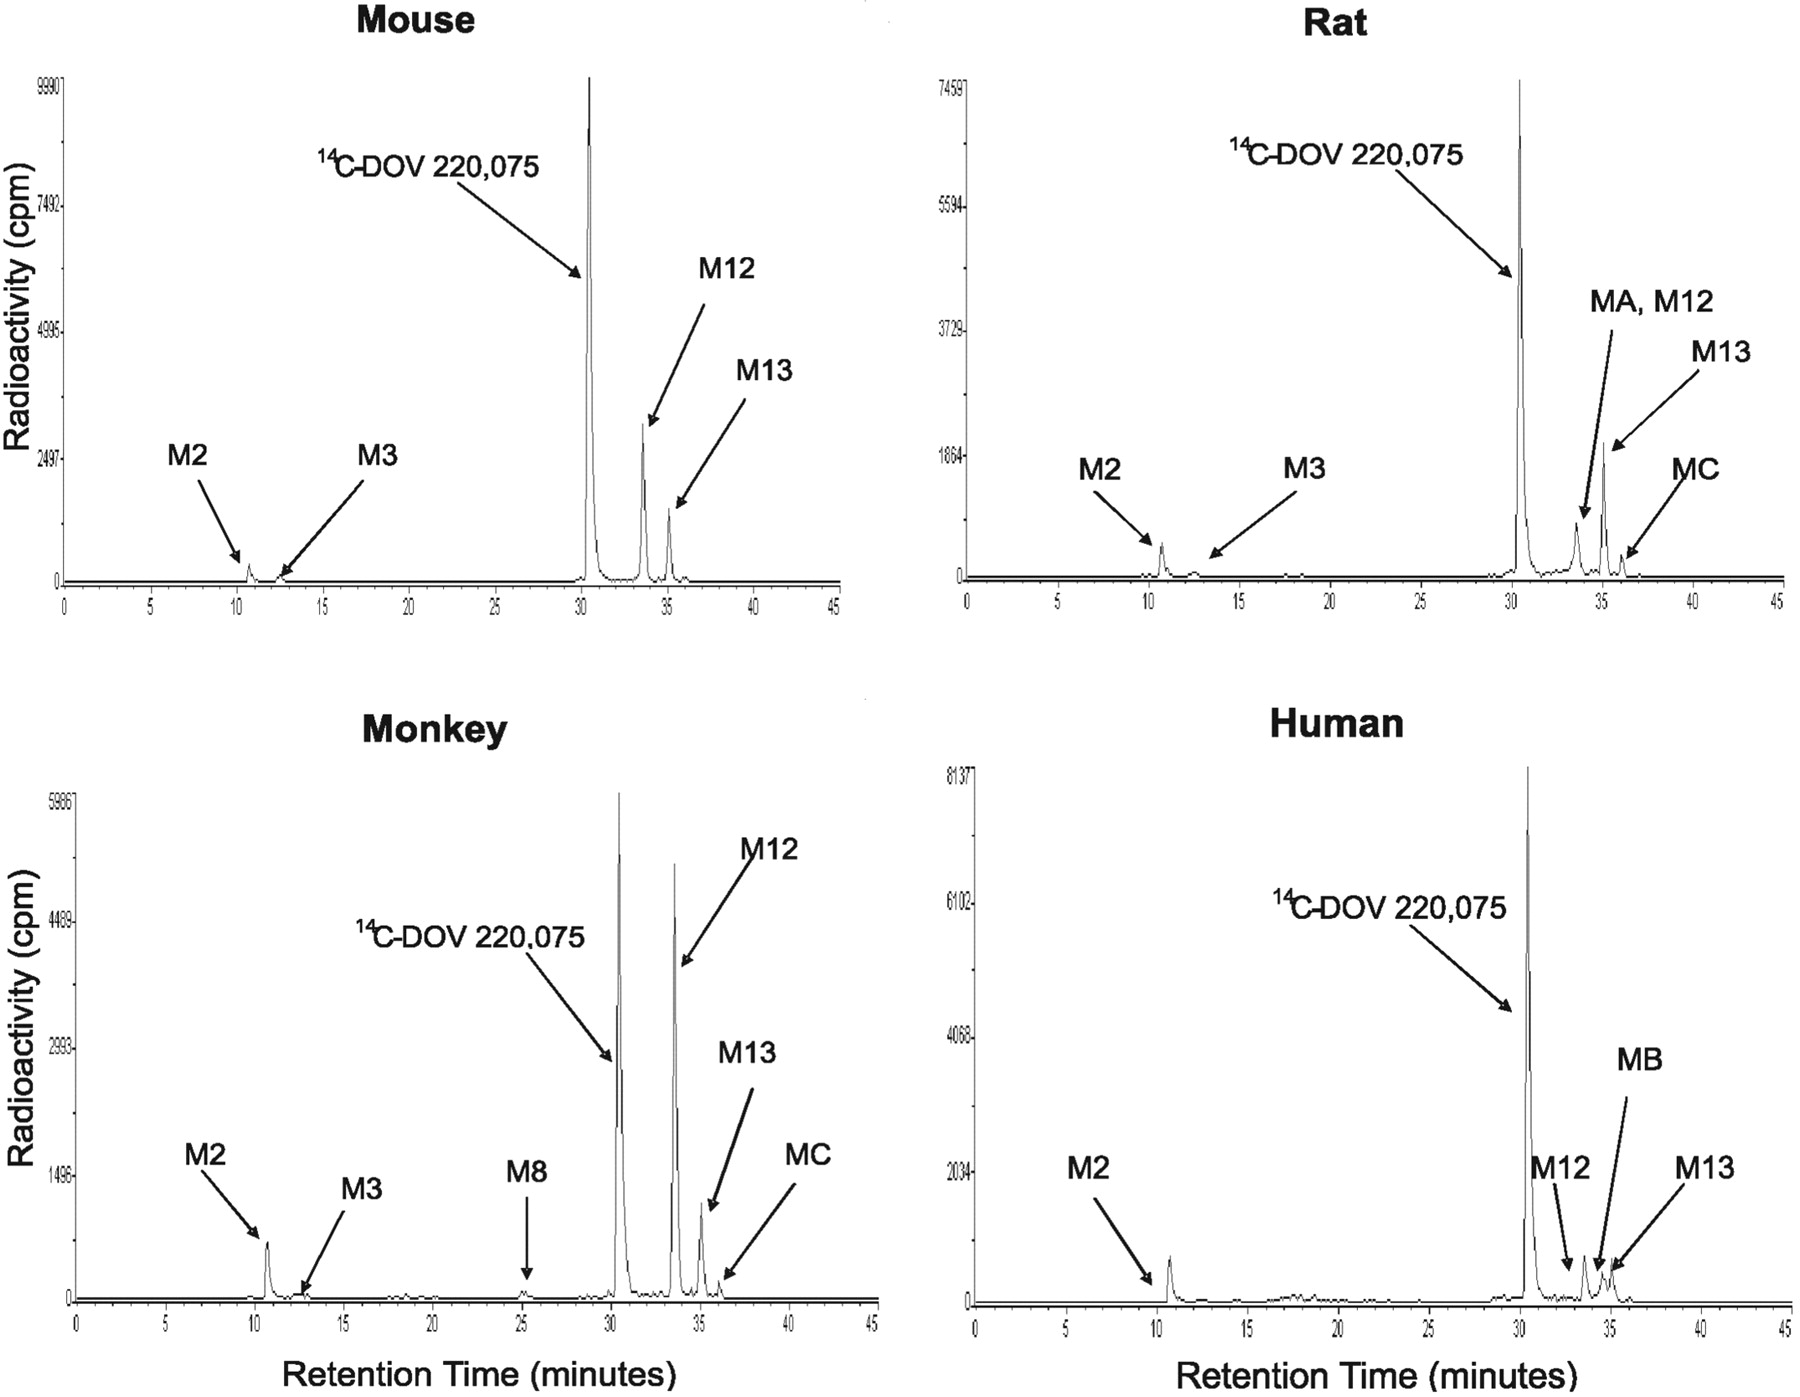
Radioflow HPLC analysis of [14C]bicifadine metabolites generated by hepatic microsomes from the mouse, rat, monkey, and human. [14C]Bicifadine (10 μM) was incubated with hepatic microsomes for 30 min at 37°C, and the suspensions were extracted and analyzed as outlined under Materials and Methods.
A potential metabolite (M13), constituting 4 to 14% of the profiled radioactivity among the incubations, was present in approximately equal amounts at 0 and 30 min of incubation. Based on LC/MS/MS analysis (m/z 204 of protonated molecular ion), it was putatively identified as N-formyl [14C]bicifadine. Since formic acid was a constituent of the sample resuspension solution and M13 formation was time- and NADPH-independent, it was considered to be an artifact formed during sample preparation.
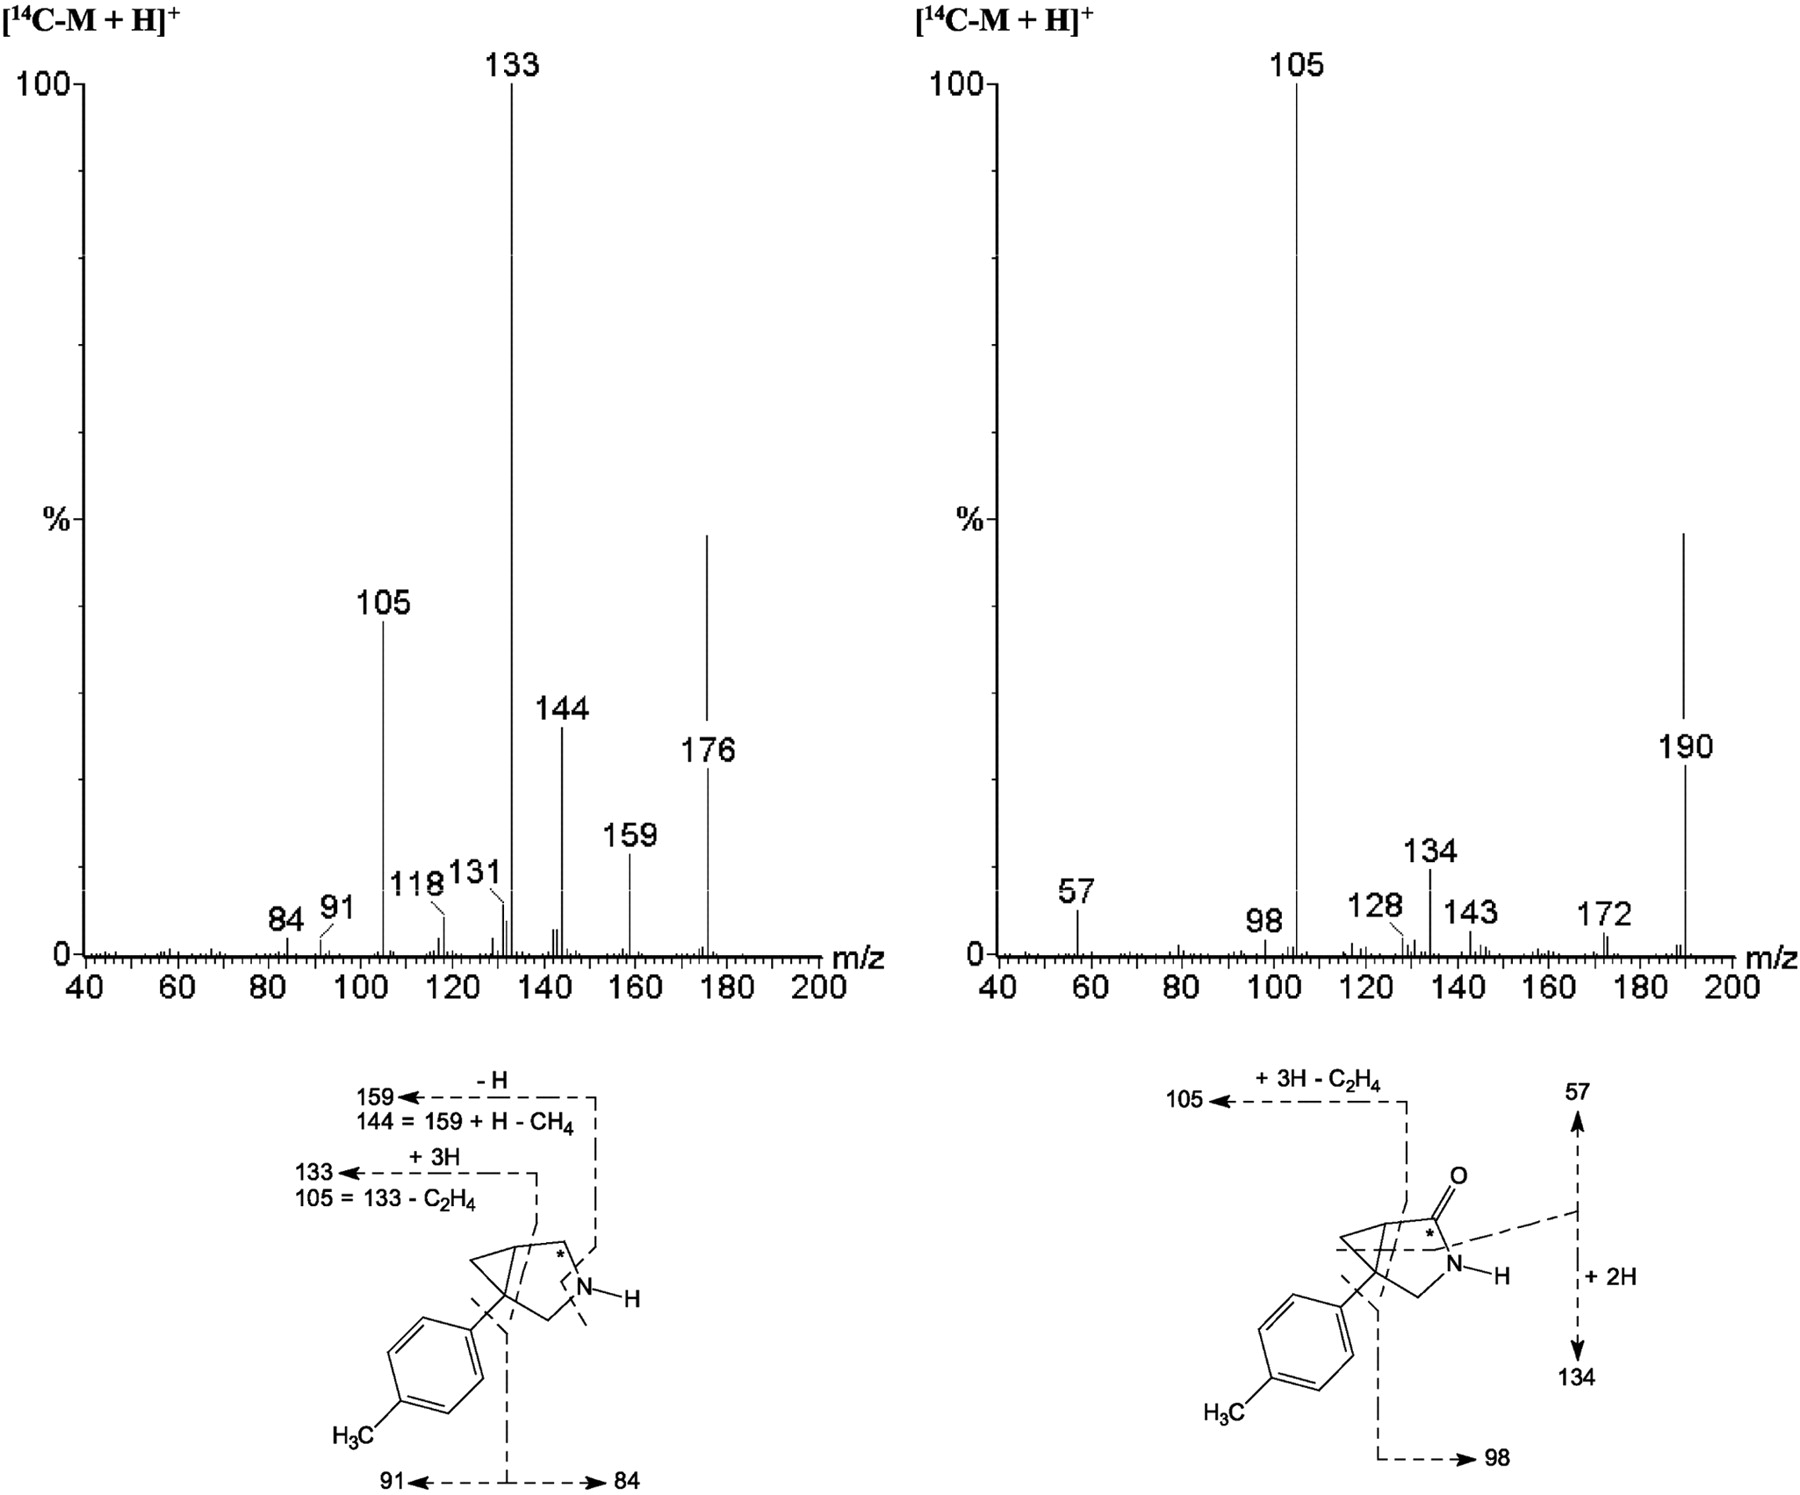
Microsomes. In hepatic microsomal incubations, two principal metabolites of [14C]bicifadine were detected among the four species, M2 and M12. A major metabolite from all four species, M12, was identified as [14C]bicifadine lactam, formed by oxidation at the 2-position of the pyrrolidine ring. It constituted approximately 5 to 8% of the profiled radioactivity in rat and human microsomes, 18% in mouse microsomes, and 36% in monkey microsomes (Table 1). The formation of M12 did not require the presence of NADPH, and it formed equally well in incubations with or without NADPH. It had a protonated molecular ion at m/z 190, 14 amu higher than that of [14C]bicifadine (Table 3; Fig. 4). The product ion mass spectrum for m/z 190 gave ions at m/z 173 (–NH3), 172 (–H2O), 143, 134, 105, 98, and 57. The ion at m/z 105 indicated that the toluene moiety was not modified, whereas the ions at m/z 57 and 134 indicated that an oxidation had occurred at the 2-position of the pyrrolidine ring. [14C]M9 had the same product mass spectrum as an authentic standard of the compound (DOV 255,833), with the exception of the ions that were 2 amu higher due to the presence of the 14C-atom with a high specific activity (Supplemental Data Fig. 2). The second principal metabolite, M2, was approximately as abundant as M12 in rat and human, and it was identified as hydroxymethyl [14C]bicifadine. Its formation was NADPH-dependent. M2 had a protonated molecular ion at m/z 192, 16 amu higher than that of [14C]bicifadine. The product ion mass spectrum for m/z 192 gave ions at m/z 175 (–NH3), 162, 157, 149 (–C3H3N), 145 (m/z 175 –C2H6), 130, and 121 (m/z 149 –C2H4). The presence of the ions at m/z 149 and 121 indicated that hydroxylation had occurred on the methyl group.
Major collision-induced dissociation product ions of metabolites of [14C]bicifadine
Other metabolites detected in radiochromatograms from microsomal incubations were M3 and M8. M3 was identified as carboxyl [14C]bicifadine, and it was present in hepatic microsomal incubations from all four species, although in human it was detectable by LC/MS only. The protonated molecular ion of M3 was at m/z 206, 30 amu higher than [14C]bicifadine. The product ion mass spectrum for m/z 206 gave ions at m/z 189 (–NH3), 171, 163 (–C2H3N), 145 (m/z 189 –CO2), 135 (m/z 163 –C2H4), 130, 128, and 117. The ions at m/z 163 and 135 indicated that the methyl group had been oxidized to the carboxylic acid. M8 was identified as hydroxymethyl [14C]bicifadine lactam, and it was present in mouse and monkey incubations, although in mouse it was detectable by LC/MS only. The protonated molecular ion of M8 was at m/z 206, also 30 amu higher than [14C]bicifadine. The product ion mass spectrum for m/z 206 gave ions at m/z 188 (–H2O), 174, 159 (–14CH3NO), 150, 129, 121, 105, 93, 84, and 57. The ion at m/z 121 indicated that hydroxylation had occurred on the methyl group. The differences in the way that M8 fragmented with respect to [14C]bicifadine indicated that a modification had occurred on the pyrrolidine ring. Specifically, ions at m/z 57 and 150 indicated that an oxidation had occurred at the 2-position of the pyrrolidine ring.

Radioflow HPLC analysis of [14C]bicifadine metabolites generated by isolated hepatocytes from the mouse, rat, monkey, and human. [14C]Bicifadine (10 μM) was incubated with isolated hepatocytes for 180 min at 37°C, and the suspensions were extracted and analyzed as outlined under Materials and Methods.
Three minor metabolites (MA, MB, and MC) were detected only in microsomal incubations in low amounts, and their formation was neither time- nor NADPH-dependent. Their protonated molecular ions are m/z 190, m/z 299, and m/z 215 for MA, MB, and MC, respectively; their identities are uncertain.
Hepatocytes. In hepatocyte incubations using 10 μM[14C]bicifadine, the principal metabolites, depending on the species, were M2, M3, M9, and M12. In all species, unchanged [14C]bicifadine was a minor component after 180 min of incubation (Fig. 3).
In mice, two of the main metabolites were M3 and M12. The other major metabolite, M9, was the lactam acid of [14C]bicifadine. Its protonated molecular ion was at m/z 220, 44 amu higher than that of [14C]bicifadine. The product ion mass spectrum for m/z 220 gave ions at m/z 203 (–NH3), 202 (–H2O), 184, 173, 164, 159, 146, 135, 129, 117, 107, 98, 91, 85, and 57. The presence of the ion at m/z 135 indicated that the methyl group had been oxidized to a carboxylic acid. Similar to M8, the fragmentation of M9 indicated that an oxidation had occurred at the 2-position of the pyrrolidine ring. The product mass spectrum of an authentic standard of M12 (DOV 255,828) had the same fragmentation as [14C]M12 with the exception of the ions due to the presence of the radiocarbon atom, which increased the amu by 2 (Supplemental Data Fig. 3).
In rat hepatocyte incubations, the major metabolite was M12, with lesser percentages of M3 and M9. Two minor metabolites, M5 and M6, had very similar mass spectra. Based on their protonated molecular ion (m/z 262) and fragmentation, both structures were deduced to be N-acetylated M9. The difference in their retention times may be due to the position of the acetyl group relative to the plane of the pyrrolidine ring. The immediate precursor to M5 and M6 could not be determined based on the present results.
The major metabolites in monkey hepatocytes were M9, M3, and M2. Also detected as significant metabolites in monkey hepatocytes were M8 and its O-glucuronide conjugate (M7). A glutathione adduct of [14C]bicifadine (M4) was detected only in incubations from monkey hepatocytes. The protonated molecular ion was at m/z 481, 305 amu higher than that of [14C]bicifadine; the specific site of attachment could not be determined.
In humans, the major metabolite was M12, with lesser amounts of M3. As in the rat, human hepatocytes produced a small amount of M10, with a protonated molecular ion of m/z 192, 16 amu higher than that of [14C]bicifadine. The presence of the ions at m/z 105 and 91 indicated that the hydroxylation had not occurred on the toluene group, whereas ions at m/z 59 and 134 indicated that oxidation had occurred at the C2 position of the pyrrolidine ring.
All four incubations produced limited amounts of the carbamoyl-O-glucuronide of [14C]bicifadine (M11). Its protonated molecular ion was 220 amu higher than that of the parent compound, and it had a number of similarities with that of [14C]bicifadine (m/z 159, 144, and 105). The loss of 176 amu from the protonated molecular ion to produce the ion at m/z 220 indicated that M11 was a glucuronide conjugate. The proposed metabolic scheme for [14C]bicifadine is presented in Fig. 5.
Reaction Phenotyping of [14C]Bicifadine Metabolism in Human. When 1 μM[14C]bicifadine was incubated with pooled human liver microsomes, M2 (Rt = 8.0 min) and M12 (Rt = 23.9 min) were the main metabolites formed (Fig. 6). Their identities were confirmed by LC/MS/MS. The absence of NADPH in the incubation mixture did not change the rate of formation of M12, and neither metabolite was formed by heat-deactivated microsomes (data not shown).
To determine which enzyme(s) were responsible for the formation of the NADPH-dependent metabolite M2, experiments were performed using pooled microsomes with P450-selective inhibitors. Quinidine, a selective inhibitor of CYP2D6, was the only P450 inhibitor that decreased microsomal M2 formation rates (Fig. 7). This observation was confirmed using cDNA-expressed isozymes. cDNA-expressed CYP2D6 formed M2 at a rate of 0.053 pmol/min/pmol P450. CYP1A2 also produced M2, but at a much lower rate (0.006 pmol/min/pmol P450). No detectable formation of M2 was observed with cDNA-expressed CYP2A6, 2B6, 2C8, 2C9, 2C19, 2E1, or 3A4 (data not shown).

Product ion mass spectra of [14C]bicifadine (m/z 176) (top left) and product ion mass spectrum of [14C]M12 (m/z 190) from the mouse hepatocyte sample incubated for 60 min with 10 μM[14C]bicifadine (top right). The asterisk indicates the position of the [14C]label in the molecule.
The oxidation of [14C]bicifadine to M12 in the absence of NADPH indicated that this reaction was catalyzed by neither P450 nor flavin-containing monooxygenase. Experiments were performed to investigate whether MAO could be involved in its formation. After preincubation of human liver microsomes with increasing concentrations of the MAO-B inhibitor selegiline, the formation of M12 declined by >90% from 37.7 to 2.35 pmol/min/mg protein (Table 4). In contrast, the MAO-A inhibitor clorgyline at concentrations up to 1 μM had only a modest effect on the rate of microsomal M12 formation.
Effect of clorgyline and selegiline on the metabolism of [14C]bicifadine to M2 by human liver microsomes and mitochondrial preparations
Pooled human liver microsomes (0.5 mg/ml) and mitochondria (1 mg/ml) were incubated with increasing concentrations of clorgyline or selegiline for 37°C for 20 min. [14C]Bicifadine (1 μM) was then added and the incubation continued for an additional 30 min. The incubations were assayed for metabolites as detailed under Materials and Methods.
Subsequently, the kinetics of M12 formation was determined in pooled human hepatic microsomal incubations containing increasing concentrations of [14C]bicifadine (Fig. 8). The data suggested biphasic kinetics, although it was not possible to accurately estimate the low-affinity kinetic phase due to the range of concentrations tested. The high-affinity phase had apparent Km and Vmax values of 3.72 μM and 129 pmol/min/mg protein, whereas the values for the low-affinity phase were 328 μM and 1390 pmol/min/mg protein. The intrinsic clearance values (Vmax/Km) for the high- and low-affinity enzymes were calculated to be 34.7 and 4.2 μl/min/mg protein, respectively.
MAO is considered to be present mainly in the mitochondrial fraction of the cell. Therefore, [14C]bicifadine was incubated with pooled human mitochondria and increasing concentrations of the two MAO inhibitors. Similar to microsomal incubations, 1 μM clorgyline had little effect on the formation of M12 by mitochondria, whereas 1 μM selegiline decreased mitochondrial M12 formation rates from 17.3 to 2.67 pmol/min/mg protein (Table 4). As a confirmation of this observation, [14C]bicifadine was incubated with cDNA-expressed MAO-A and MAO-B and M12 was also formed at rates of 5.5 ± 1.1 and 2.6 ± 1.3 pmol/min/mg protein, respectively.
Although the action of MAO normally results in the cleavage of the carbon–nitrogen bond, the oxidation of the neurotoxin MPTP by MAO-B has been shown to stop at the formation of an imine (Chiba et al., 1985). Further oxidation to the MPTP lactam is due to the cytosolic enzyme AO (Yoshihara and Ohta, 1998). To check for residual activity in the cell fractions, the AO substrate phthalazine was incubated with liver cytosol, microsomes, and mitochondria in the presence and absence of 1 μM perphenazine, an AO inhibitor. Cytosolic AO was inhibited 55% (Fig. 9), confirming the effectiveness of the inhibitor. Residual AO activity was also present in the microsomal and mitochondrial fractions, and it was inhibited 30 and 26%, respectively, by perphenazine. In contrast, the oxidation of [14C]bicifadine to the lactam M12 was not affected by perphenazine, suggesting that AO is not involved in the formation of M12.
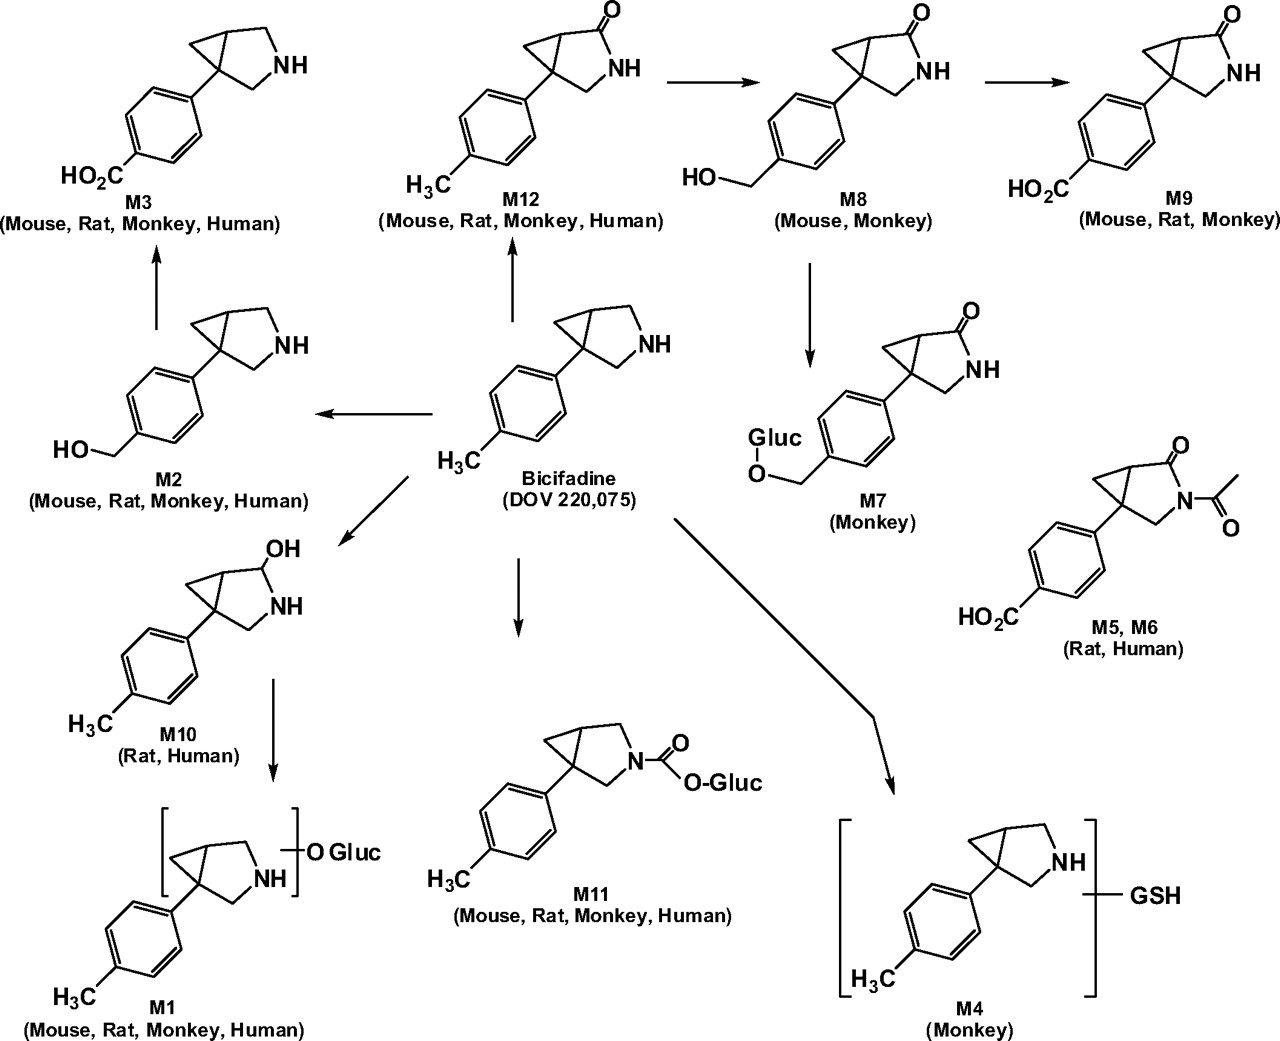
Proposed biotransformation pathways of [14C]bicifadine in the mouse, rat, monkey, and human. The asterisk indicates the position of the radiolabel in [14C]bicifadine.
Although a minor metabolic pathway, P450 reaction phenotyping experiments were also conducted for the formation of M8 from M12. None of the P450-specific inhibitors were particularly effective against M8 formation. However, some degree of inhibition was observed with α-naphthoflavone (30% inhibition, selective for CYP1A2), sulfaphenazole (9% inhibition, selective for CYP2C9), omeprazole (13% inhibition, selective for CYP2C19), and diethyldithiocarbamate (14% inhibition, selective for CYP2E1). When M12 was incubated with a battery of cDNA-expressed P450s, M8 was formed to some extent by all of the enzymes examined except CYP2A6. However, the enzymes that most efficiently formed M8 were CYP2C19 (1.27 pmol/min/pmol P450), CYP1A2 (0.969 pmol/min/pmol P450), CYP2D6 (0.717 pmol/min/pmol P450), and CYP2E1 (0.367 pmol/min/pmol P450).
Discussion
The major metabolic pathways of [14C]bicifadine were similar among the four species examined when the results using hepatic microsomes and isolated hepatocytes were compared. One of the two major metabolic pathways is initiated by hydroxylation of the methyl group to form M2. In human microsomes, this reaction is catalyzed predominantly by CYP2D6, with minor involvement of CYP1A2. M2 is oxidized further in hepatocytes from all four species to the carboxylic acid metabolite M3. Based on the combined percentages of M2 and M3, approximately 15% of [14C]bicifadine is metabolized via this pathway in rat and human hepatocytes, whereas 42% is metabolized by this pathway in the monkey. A clinical trial would be needed to determine whether concomitant administration of CYP2D6 inhibitors could affect the clearance of bicifadine.
Like bicifadine, M12 is also oxidized to a hydroxymethyl metabolite (M8). Thus, it was of interest to determine whether this reaction was also carried out by CYP2D6. A variety of cDNA-expressed human cytochromes P450 were capable of producing this metabolite, including CYP2D6. However, quinidine (selective for CYP2D6) was ineffective as an inhibitor of M8 formation in microsomal incubations, indicating that CYP2D6 is not involved in this reaction. Although CYP2D6 may have a limited capacity for M8 formation from M12, the enzymes primarily responsible for this reaction seem to be CYP1A2, CYP2C19, and CYP2E1.
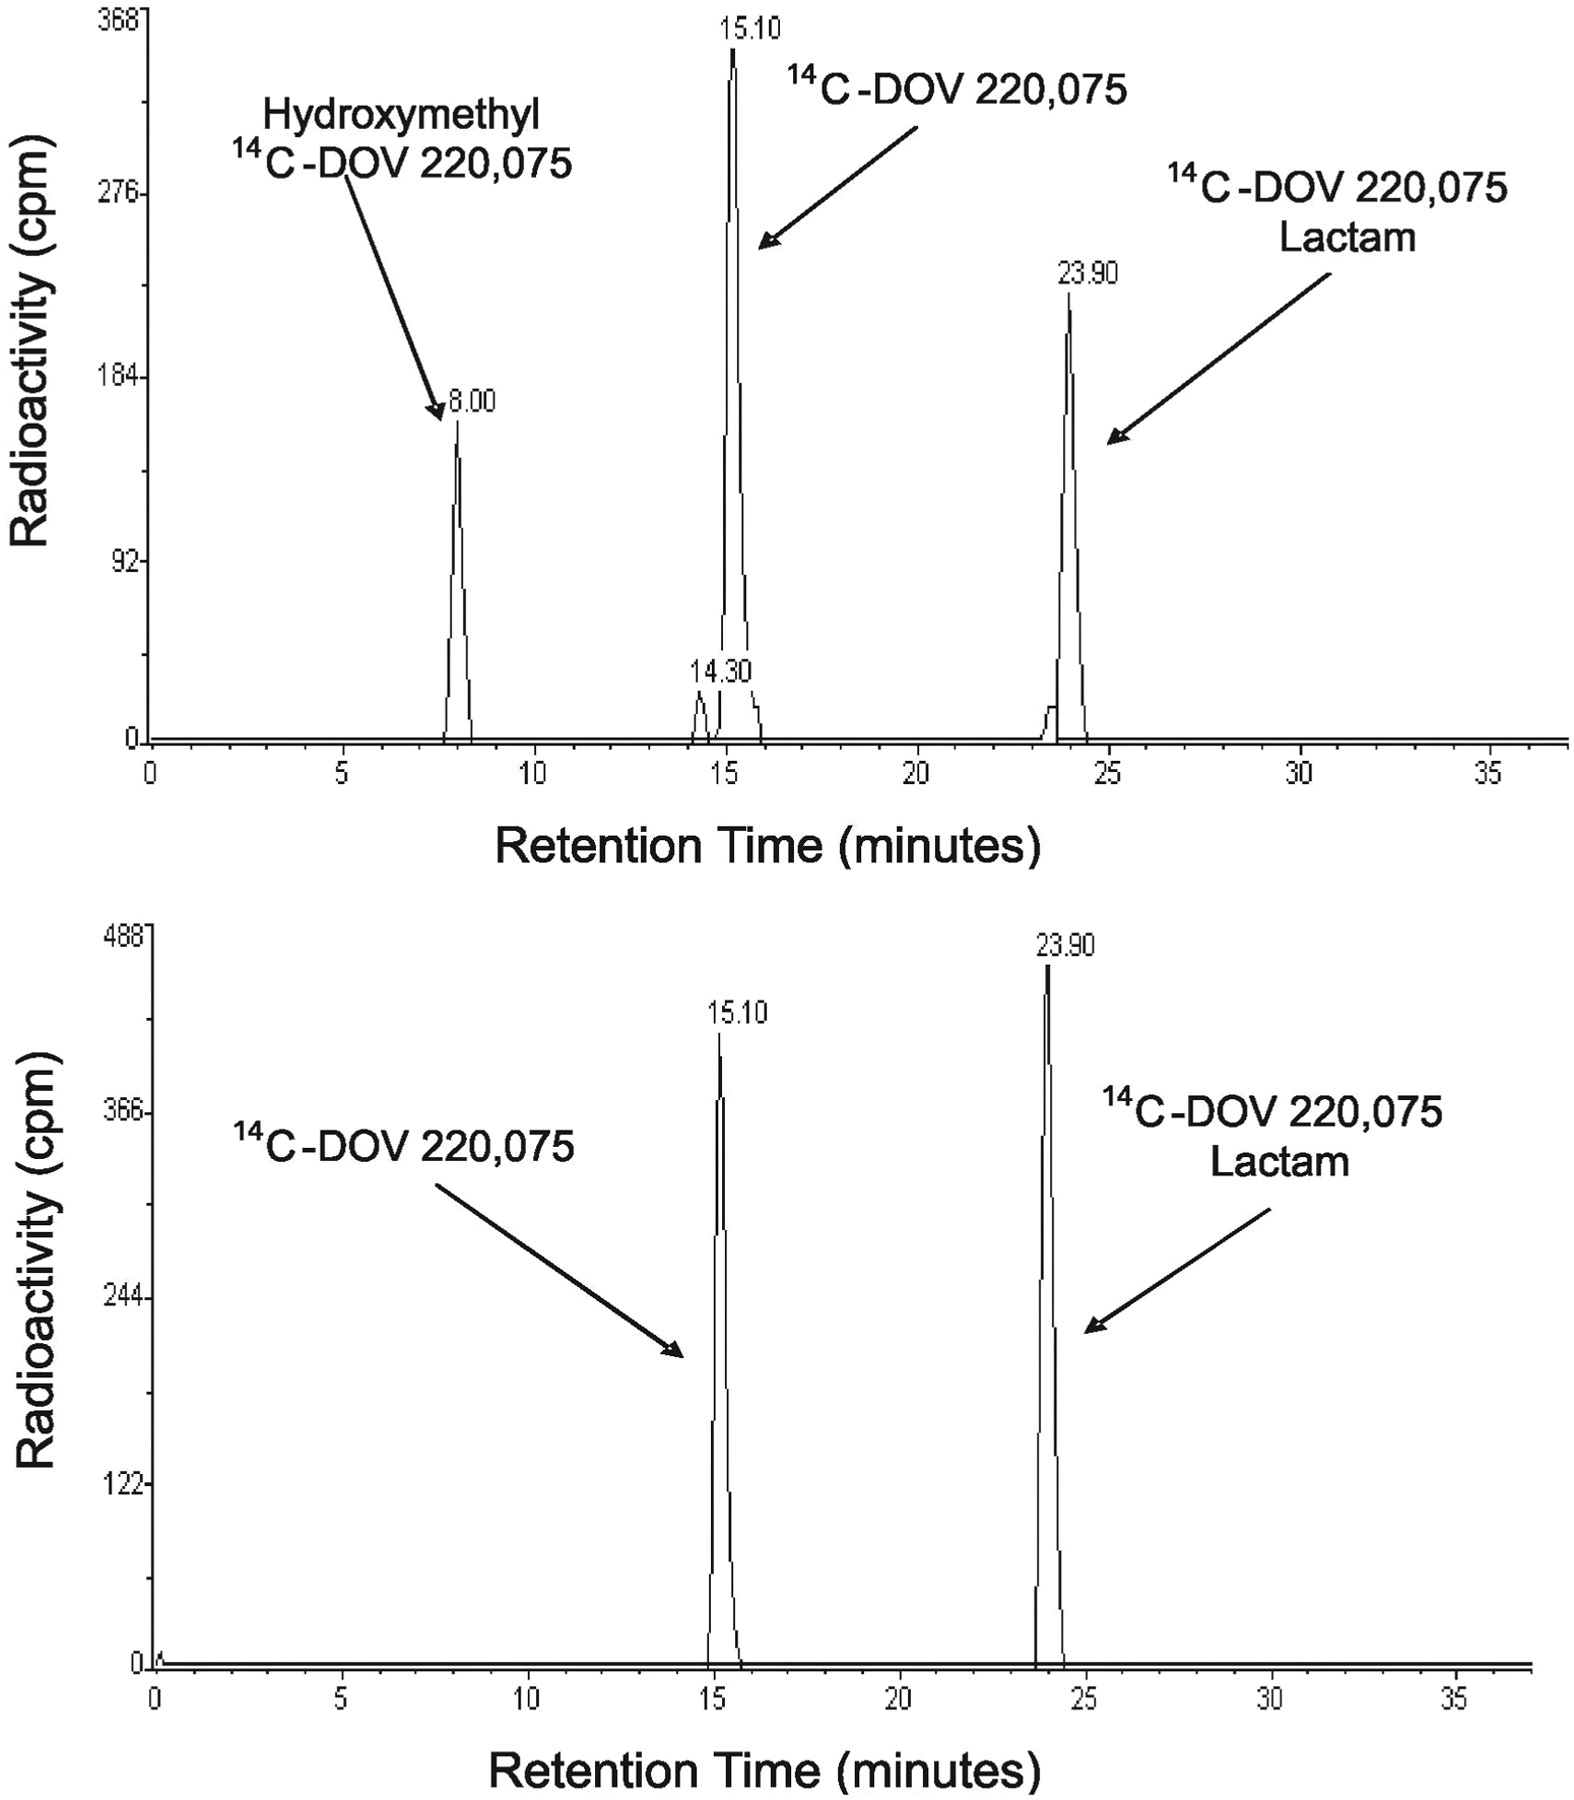
Radioflow HPLC analysis of [14C]bicifadine metabolites generated by human hepatic microsomes incubated for 30 min with 1 μM[14C]bicifadine with (top) and without (bottom) NADPH.
The other major pathway for the metabolism of [14C]bicifadine is oxidation of the C2 carbon of the pyrrolidine ring to form the lactam metabolite M12. Approximately equal amounts were formed by microsomes in the presence and absence of NADPH from all four species, indicating that the oxidation was not due to either P450 or flavin-containing monooxygenase. The reaction is catalyzed mainly by MAO-B as determined by the addition of the specific inhibitor selegiline to incubations with microsomes and mitochondria. Formation of M12 declined by 94% in the presence of 1 μM selegiline compared with control incubations. MAO-A may be involved to a lesser extent since the formation of M12 declined approximately 11% when 1 μM clorgyline was added to the microsomal suspensions.
Lactam formation from an aliphatic carbon–nitrogen bond has been shown to be due to the sequential action of MAO-B (Chiba et al., 1985), or P450 (Cashman et al., 1992), followed by oxidation of the resulting imine by cytosolic AO (Brandlänge and Lindblom, 1979; Yoshihara and Ohta, 1998; Vickers and Polsky, 2000). The presence of residual AO activity in the microsomal and mitochondrial fractions precludes eliminating the involvement of this enzyme in the formation of M12. But, the addition of the AO inhibitor perphenazine to the incubations had no effect on the oxidation of bicifadine to M12. Also, AO oxidizes quaternary azaheterocyclic imines to lactams, but it has little to no activity on tertiary azaheterocyclic imines (Beedham, 2002). The putative intermediate imine of bicifadine formed by MAO-B would have a tertiary structure. Although the present findings indicate that MAO is critical to the formation of the bicifadine lactam M12, the identification of the enzyme that catalyzes the oxidation of the putative imine intermediate to the lactam requires further investigation.
The inhibition of M12 formation in hepatic microsomes by MAO-B inhibitors was unexpected since this is considered a mitochondrial enzyme (Schnaitman et al., 1967). 1-Methyl-4-phenyl-1,2,3,6-tetrahydropyridine is oxidized to MPDP+ predominantly by mitochondrial MAO-B; the microsomal fraction produced mainly the N-desmethyl and N-oxide metabolites but very little 1-methyl-4-phenyl-2,3-dihydropyridinium (Yoshihara and Ohta, 1998). The preparations used to demonstrate the conversion of milacemide to glycine by MAO-B were enriched in mitochondria (Janssens de Varebeke et al., 1988). Formation of M12 is not due to the semicarbazide-sensitive amine oxidase because the reaction is sensitive to selegiline, and bicifadine is not a primary amine (Kinemuchi et al., 2004). Nonetheless, others have reported significant MAO activity in the microsomal fraction. For example, Salva et al. (2003) found almotriptan metabolism by MAO in both the microsomal and mitochondrial fractions of human liver. Yu et al. (2003) documented MAO activity for the formation of tryptophol from tryptamine in human liver microsomes. Gómez et al. (1988) demonstrated the presence of MAO-A and MAO-B activity in rat liver microsomes using enzyme-specific substrates and inhibitors and changes in temperature and pH sensitivity that were similar to those in mitochondria. Iwasa et al. (2003) found that MAO activity for the metabolism of rizatriptan was similar between the microsomal and mitochondrial fractions of Japanese liver donors. In the present study, microsomal MAO activity seems to be qualitatively similar to that in the mitochondrial preparation. However, unlike other examples of microsomal MAO activity, the formation of M12 from bicifadine is a major metabolic pathway.
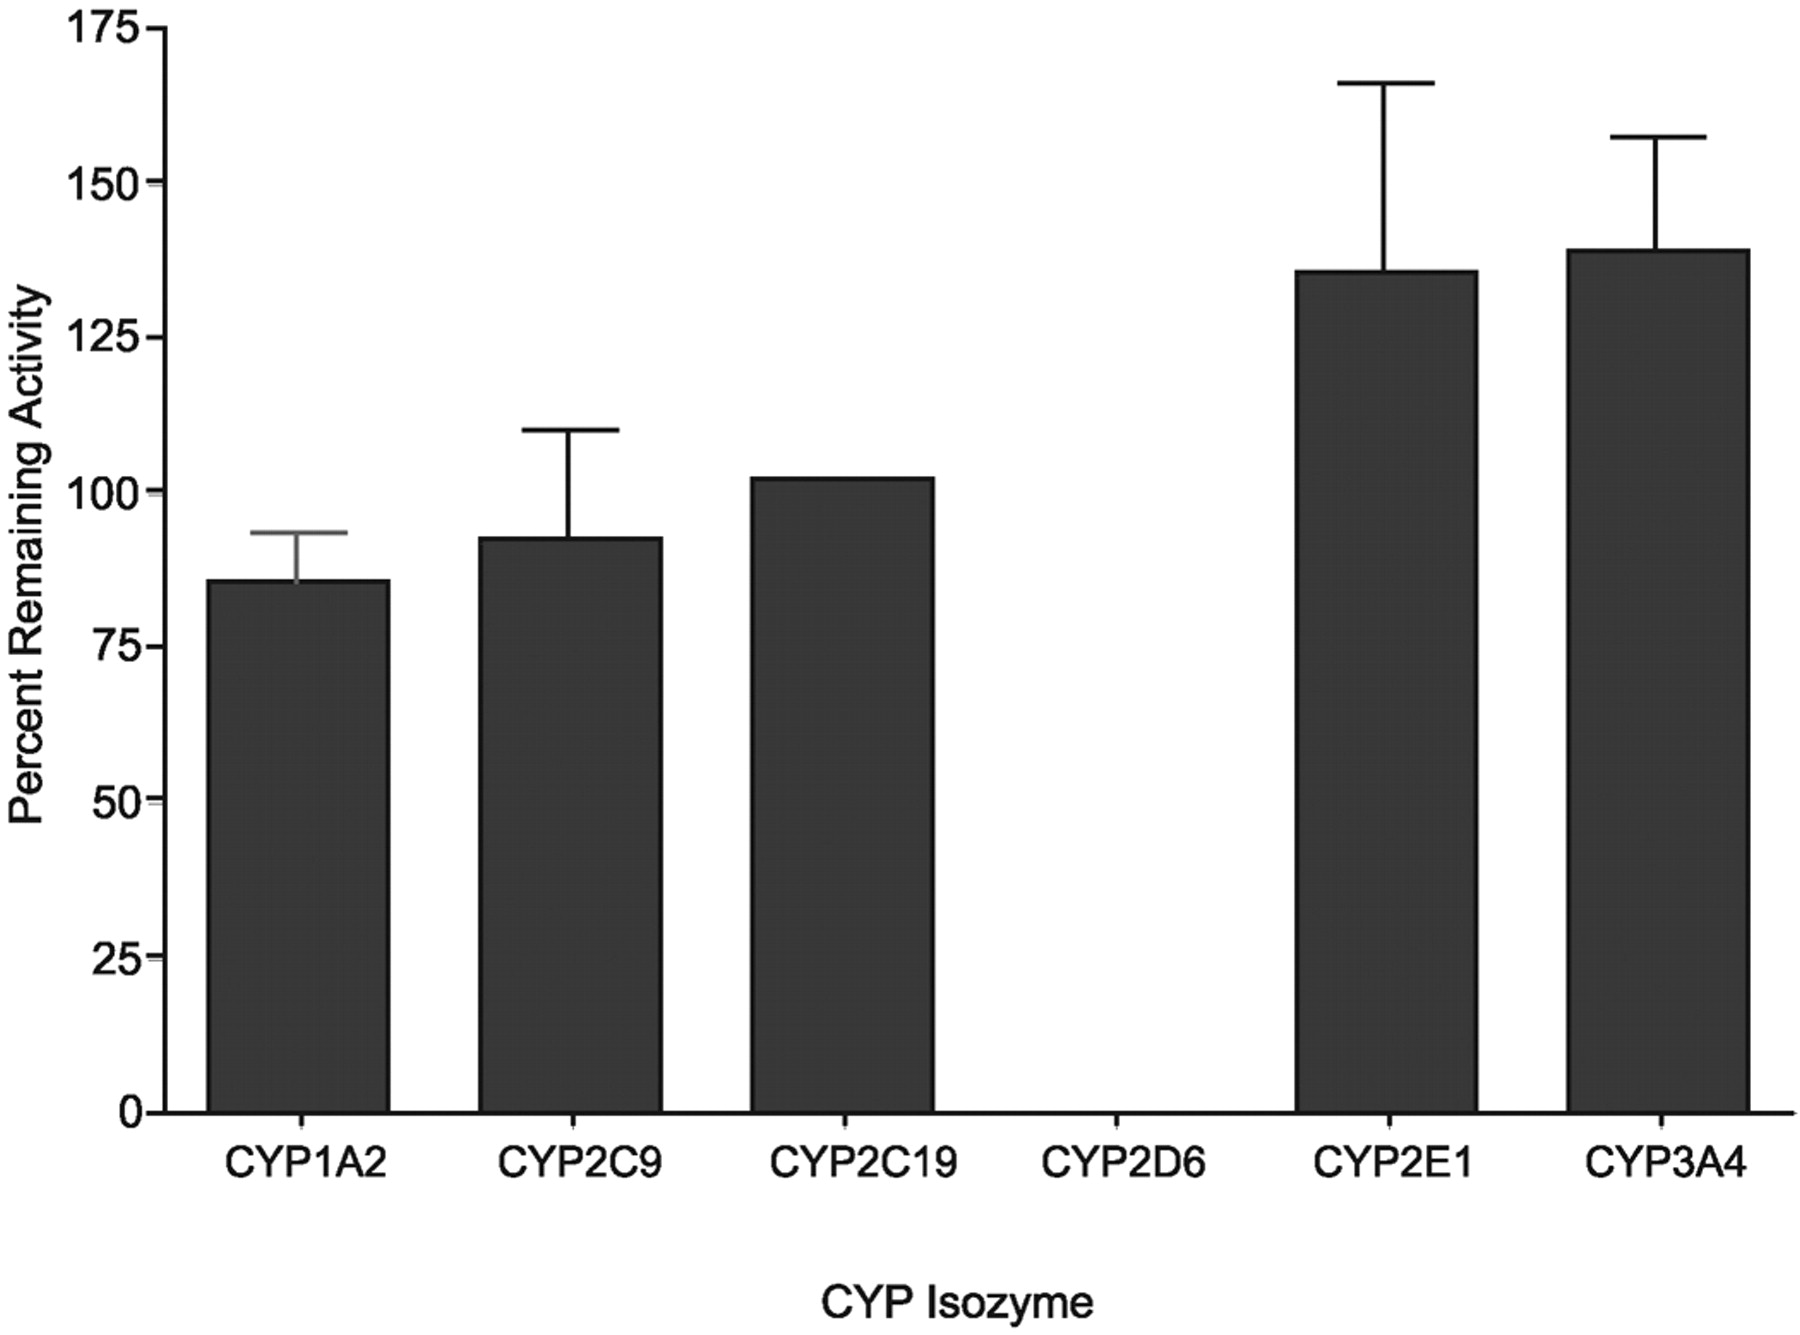
Effect of P450-selective inhibitors on the rate of formation of M2 by human hepatic microsomes incubated with 1 μM[14C]bicifadine. The specific inhibitors were 10 μM α-napthoflavone (CYP1A2), 5 μM sulfaphenazole (CYP2C9), 25 μM omeprazole (CYP2C19), 10 μM quinidine (CYP2D6), 100 μM S-methyl N,N-diethylthiolcarbamate (CYP2E1), and 1 μM ketoconazole (CYP3A4). After 30 min of incubation, the suspensions were extracted and analyzed by radioflow HPLC as detailed under Materials and Methods. CYP2C19 activity is the average of two incubations rather than a mean (S.D.) of three incubations as for the other reactions.
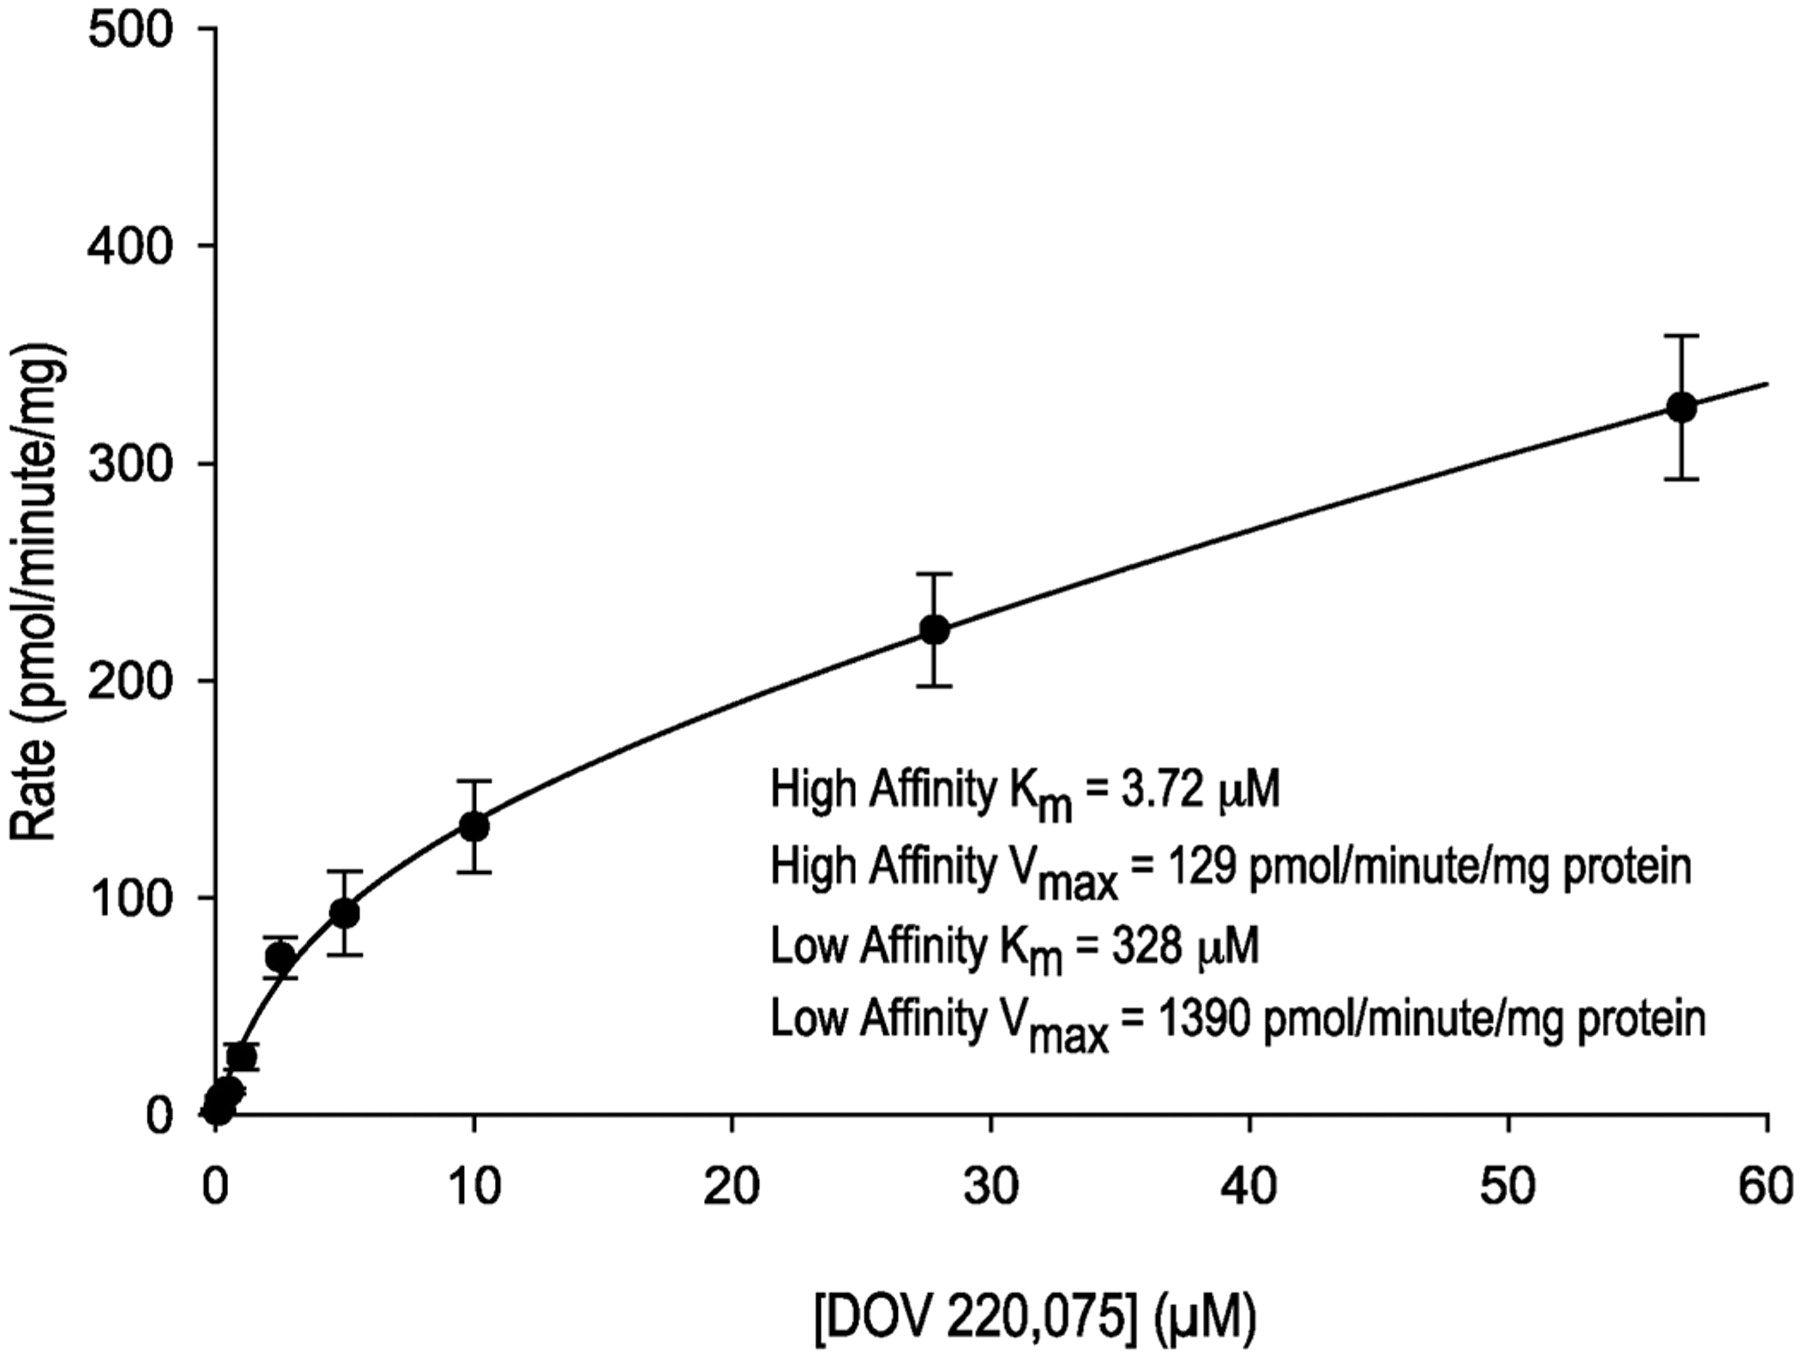
Michaelis-Menten plot of the formation of M12 from [14C]bicifadine by human hepatic microsomes in the absence of NADPH.

Effect of the aldehyde oxidase inhibitor perphenazine on the formation of bicifadine lactam M12 and the AO substrate phthalazone in cytosol, microsomes, and mitochondria. The concentrations of phthalazine and perphenazine were 10 and 1 μM, respectively. The control activities of AO (picomoles of phthalazinone per minute per milligram of protein) were 42.4, 20.2, and 376 in the microsomes, mitochondria, and cytosol, respectively. Formation of M12 using liver cytosol was not determined.
M12 is oxidized further to M9, mainly by mouse and monkey hepatocytes, and it is a minor metabolite in rat hepatocytes; it is not detectable in human hepatocytes. The initial hydroxymethyl intermediate (M8) and its O-glucuronide (M7) were detected only in monkey hepatocyte incubations, but reaction phenotyping studies demonstrated a low capacity for M8 formation by human hepatic microsomes.
Although the acid lactam M9 can potentially be formed from M2 or M3, the results from the mouse and monkey hepatocyte incubations indicate that M12 is the more likely precursor to this metabolite. Both M12 and M8 had much higher concentrations after 1 h of incubation compared with 3 h in these two species, whereas M9 increased 3- to 5-fold over the same period. These changes are indicative of a precursor–product relationship among M12, M8, and M9.
[14C]Bicifadine was also metabolized to the carbamyl-O-glucuronide conjugate M11 by all four species. Similar glucuronides have been reported for tocainide (Elvin et al., 1980; Kwok et al., 1990), rimantadine (Brown et al., 1990), carvedilol (Schaefer, 1992), the benzazepine SK&F 86466 (Straub et al., 1988), and sertraline (Tremaine et al., 1989). This seems to be a minor pathway for the metabolism of bicifadine in comparison with oxidation of the methyl group and the pyrrolidine ring.
In summary, there are two main metabolic pathways of bicifadine in mouse, rat, monkey, and human microsomes and hepatocytes. One pathway is the hydroxylation of the methyl group (via CYP2D6 in human) with subsequent oxidation to the carboxylic acid. The other pathway is oxidation of the pyrrolidine ring, initiated by MAO-B, to form the lactam metabolite. Furthermore, it seems that lactam formation is a major metabolic route for bicifadine in microsomes, being as active as P450 for [14C]bicifadine metabolism in humans.
Footnotes
-
Article, publication date, and citation information can be found at http://dmd.aspetjournals.org.
-
doi:10.1124/dmd.107.016055.
-
ABBREVIATIONS: MAO, monoamine oxidase; HPLC, high-performance liquid chromatography; P450, cytochrome P450; AO, aldehyde oxidase; DOV 255,828, 5-(4-methylphenyl)-3-azabicyclo[3.1.0]hexan-2-one; DOV 255,833, 5-(4-carboxyphenyl)-3-azabicyclo[3.1.0]hexan-2-one; SK&F 86466, 6-chloro-2,3,4,5-tetrahydro-3-methyl-1H-3-benzazepine; LC, liquid chromatography; LC/MS, liquid chromatography/mass spectrometry; LC/MS/MS, liquid chromatography/tandem mass spectrometry; MS, mass spectrometry; amu, atomic mass unit(s).
-
↵
 The online version of this article (available at http://dmd.aspetjournals.org) contains supplemental material.
 - Received March 30, 2007.
- Accepted September 19, 2007.

- The American Society for Pharmacology and Experimental Therapeutics


