


Abstract
The misuse of the anabolic steroid methyltestosterone is currently routinely monitored in doping control laboratories by gas chromatography-mass spectrometry (GC-MS) of two of its metabolites: 17α-methyl-5β-androstane-3α,17β-diol and 17α-methyl-5α-androstane-3α,17β-diol. Because of the absence of any easy ionizable moiety, these metabolites are poorly detectable using liquid chromatography-tandem mass spectrometry (LC-MS/MS) with electrospray ionization (ESI). In this study, the metabolism of methyltestosterone has been reinvestigated by the use of a precursor ion scan method in LC-ESI-MS/MS. Two metabolites have been detected using this method. Both compounds have been confirmed in postadministration urine samples of an urokinase plasminogen activator-severe combined immunodeficiency (uPA-SCID) mouse with humanized liver and were characterized by LC-MS/MS and GC-MS using both quadrupole and time of flight analyzers. From the detailed study of the fragmentation, these metabolites were proposed to be epimethyltestosterone and a dehydrogenated compound. Epimethyltestosterone has previously been described as a minor metabolite, whereas the occurrence of the oxidized metabolite has not been reported. Comparison with the synthesized reference revealed that the structure of the dehydrogenated metabolite is 6-ene-epimethyltestosterone. A selected reaction monitoring method including three transitions for each metabolite has been developed and applied to samples from an excretion study and to samples declared positive after GC-MS analysis. 6-Ene-epimethyltestosterone was found in all samples, showing its applicability in the detection of methyltestosterone misuse.
- WADA, World Anti-Doping Agency
- GC, gas chromatography
- MS, mass spectrometry
- LC, liquid chromatography
- MS/MS, tandem mass spectrometry
- TOF, time of flight
- uPA-SCID, urokinase plasminogen activator-severe combined immunodeficiency
- QTOF, quadripole time of flight
- HPLC, high-performance liquid chromatography
- CID, collision-induced dissociation
- ESI, electrospray ionization
- EI, electron ionization
- SIM, selected ion monitoring
- SRM, selected reaction monitoring
- TMS, trimethylsilyl
- OE+, odd electron ion(s).
Anabolic androgenic steroids are among the most frequently misused compounds by athletes (WADA Laboratory Statistics, 2009, http://www.wada-ama.org/en/dynamic.ch2?pageCategory.id=335). 17α-Methyltestosterone (17β-hydroxy-17α-methylandrost-4-en-3-one) has been one of the most detected compounds in doping analysis during the past few years (WADA Laboratory Statistics, 2009, http://www.wada-ama.org/en/dynamic.ch2?pageCategory.id=335). 17α-Methyltestosterone is rapidly metabolized in humans, and therefore the monitoring of the misuse of this steroid is normally performed by the detection of its metabolites. Two main metabolites were identified in the metabolism of 17α-methyltestosterone in human: 17α-methyl-5α-androstane-3α,17β-diol (A2) and 17α-methyl-5β-androstane-3α,17β-diol (A3) (Schänzer and Donike, 1993). Hydroxylated metabolites have been described in several animals including the horse (Dumasia, 2003; McKinney et al., 2007; Yamada et al., 2007) and the heifer (Blokland et al., 2005).
In doping control analysis, the detection of steroid metabolites is normally performed by gas chromatography-mass spectrometry (GC-MS) after trimethylsilylation (Schänzer and Donike, 1993; Ayotte et al., 1996; Saugy et al., 2000), achieving the required sensitivity of 2 ng/ml (WADA Technical Document TD2004MRPL version 1.0, 2007, http://www.wada-ama.org/rtecontent/document/perf_limits_2.pdf). However, the unequivocal proof of 17α-methyltestosterone misuse is difficult because both A2 and/or A3 are also metabolites of other anabolic steroids including metandienone, mestanolone, methandriol, or oxymetholone (Schänzer and Donike, 1993).
The ionization of A2 and A3 as [M + H]+ by atmospheric pressure interfaces is difficult owing to the absence of a keto function (Pozo et al., 2007c). Therefore, the detection of 17α-methyltestosterone misuse is not possible by current methods based on liquid chromatography-tandem mass spectrometry (LC-MS/MS) (Mazzarino and Botrè, 2006; Pozo et al., 2007b).
More recently, LC-MS/MS has proven to be a powerful tool in the detection and elucidation of previously unreported steroid metabolites (Schänzer et al., 2006; Pozo et al., 2008b,d). New metabolites of some anabolic steroids such as metandienone (Schänzer et al., 2006) or fluoxymesterone (Pozo et al., 2008d) were identified by LC-MS/MS. Triple quadrupole instruments seem to be ideal tools for this purpose because of the variety of scan modes that can be applied, including precursor ion scan (Thevis et al., 2005a; Schänzer et al., 2006; Pozo et al., 2008a,b) and neutral loss (Pozo et al., 2008b,d). Analyzers with accurate mass capabilities such as TOF or Orbitrap have also been incorporated in doping control analysis (Thevis et al., 2005b; Georgakopoulos et al., 2007; Kolmonen et al., 2007).
One of the main limitations in the elucidation of anabolic steroid metabolism is uncertainty of the metabolic nature of the detected compounds. For this purpose, the urinary excretion profile from administration studies was investigated. The increase and decrease in the metabolite concentration over time after administration is the first indication of their metabolic nature. In addition, the occurrence of potential metabolites in several positive samples can also provide extra information. More recently, a chimeric mouse model was developed based on the transplantation of primary human hepatocytes into uPA-SCID mice (Meuleman et al., 2005). These immune-deficient mice have a transgene-induced liver disease, and therefore the transplanted human hepatocytes can repopulate the diseased liver without the risk of graft rejection. After successful transplantation, up to 90% of liver parenchyma can be occupied by healthy primary human hepatocytes that retain their natural morphology and physiological functions (Meuleman et al., 2005). Although primarily developed for the study of viral hepatitis (Meuleman et al., 2008; Vanwolleghem et al., 2008), this chimeric mouse model can also be used to study the human-type metabolism of anabolic steroids (Lootens et al., 2009). The presence of the analytes in the mouse urine after administration of a steroid can be considered as the confirmation of its metabolic nature.
The aim of this study was to reevaluate the metabolism of methyltestosterone by the combination of LC-MS/MS and GC-MS. A precursor ion scan method was used for the detection of methyltestosterone metabolites. The metabolic nature of the metabolites detected was confirmed by the administration of methyltestosterone to a uPA-SCID mouse with a humanized liver. The accurate mass measurements obtained by LC-quadripole time of flight (QTOF) and GC-TOF instruments are used to propose structures for unreported metabolites. Finally, the usefulness of these metabolites in the screening for methyltestosterone misuse is demonstrated by the analysis of postadministration urine samples and positive doping control samples.
Materials and Methods
Chemicals and Reagents.
17α-Methyltestosterone (A1) was obtained from Organon (Oss, Netherlands). 17α-Methyl-5α-androstane-3α,17β-diol (A2) and 17α-methyl-5β-androstane-3α,17β-diol (A3) were purchased from NMI (Pymble, Australia). Epimethyltestosterone (17α-hydroxy-17β-methylandrost-4-en-3-one) was synthesized at the Institute of Biochemistry, German Sport University Cologne (Cologne, Germany) as described by Schänzer et al. (1992).
Stock solutions were prepared by dissolving the reference material in methanol. Working solutions for each analyte at 1 μg/ml were obtained by diluting adequate amounts of stock solutions in water-methanol (9:1).
The β-glucuronidase preparation (type Escherichia coli K12) was purchased from Roche Diagnostics (Mannheim, Germany). Analytical grade potassium carbonate, sodium hydrogen carbonate, and diethyl ether were obtained from Merck (Darmstadt, Germany). N-Methyl-N-trimethylsilyltrifluoro-acetamide was purchased from Chem. Fabrik Karl Bucher (Waldstetten, Germany).
HPLC-grade methanol and HPLC-grade water were purchased from Acros (Geel, Belgium) and Thermo Fisher Scientific (Loughborough, UK), respectively. Ammonium acetate was obtained from Sigma-Aldrich (St. Louis, MO).
Gases used in mass spectrometry were helium (Alphagaz grade), nitrogen, and argon (Air Liquide, Desteldonk, Belgium).
Samples remaining from an excretion study formerly analyzed in our laboratory were used for the experiments described. In addition, positive samples for 17α-methyltestosterone were provided by other doping control laboratories, the International Olympic Committee, and WADA or were samples previously declared positive in a doping control test based on results obtained by GC-MS. Blank urine samples were used to check the specificity of the method.
Instrumentation.
LC-MS/MS studies (triple quadrupole).
An HPLC Finnigan Surveyor MS pump Plus (Thermo Fisher Scientific, Waltham, MA) was interfaced to a Finnigan TSQ Quantum Discovery Max triple quadrupole mass spectrometer (Thermo Fisher Scientific) using the electrospray interface. Twenty microliters of sample were injected into the system using a Finnigan Surveyor autosampler Plus (Thermo Fisher Scientific). The LC separation was performed using an Omnispher C18 column (100 × 2 mm i.d., 3 μm) (Varian, Sint-Katelijne-Waver, Belgium) at a flow rate of 250 μl/min using a ChromSep guard column (10 × 2 mm i.d., 5 μm) (Varian). For ultraperformance liquid chromatography experiments, separation was performed on an Acquity BEH C18 column (50 × 2.1 mm i.d., 1.7 μm) (Waters, Milford, MA) using gradient elution at a flow rate of 0.3 ml/min.
Aqueous ammonium acetate (1 mM) and methanolic ammonium acetate (1 mM) were selected as mobile phase solvents. Nitrogen was used as sheath gas, ion sweep gas, and auxiliary gas at flows of 70, 2, and 5 units, respectively. A spray voltage of 4000 V was used in the positive ionization mode. The capillary temperature was set at 300°C and the collision-induced dissociation (CID) source at 2 units. The collision gas pressure was 1.5 units.
ESI accurate mass measurements (LC-QTOF).
Accurate mass experiments were performed using a hybrid quadrupole time-of-flight (QTOF Premier) mass spectrometer provided with an orthogonal Z-spray-ESI (Waters) interfaced to an ultraperformance liquid chromatography system (Acquity; Waters) for the chromatographic separation. The drying gas and the nebulizing gas was nitrogen. The desolvation gas flow was set to approximately 600 l/h, and the cone gas flow was set to 50 l/h. A cone voltage of 40 V and a capillary voltage of 3.0 kV were used in positive ionization mode. The nitrogen desolvation temperature was set at 350°C, and the source temperature was set at 120°C. TOF MS resolution was approximately 10,000 (full width at half-maximum) at m/z 556. MS and MS/MS spectra were acquired over a m/z range of 50 to 1000. For both MS and MS/MS, argon (99.995%) was used as collision gas with a pressure of approximately 8 × 10⁻³ mbar in the collision cell. The microchannel plate detector potential was set to 1700 V. Scan times of 0.2 s/spectrum were chosen.
The m/z-axis was calibrated using the built-in single syringe pump, directly connected to the interface. Calibration was conducted from m/z 50 to 1000 with a 1:1 mixture of 0.1 M sodium hydroxide: 10% formic acid diluted (1:25) with acetonitrile-water (80:20) at a flow rate of 10 μl/min. For automated accurate mass measurement, the lockspray probe was used, using as lockmass a solution of 2 μg/ml leucine enkephalin in acetonitrile-water (50:50) pumped at 30 μl/min through the lockspray needle using a Reagent Delivery Module (Waters). The protonated molecule of leucine enkephalin at m/z 556.2771 was used for recalibrating the mass axis and ensuring a robust accurate mass measurement along time.
GC-MS.
The GC/MS analysis was performed on an Agilent 5975 (Agilent Technologies, Santa Clara, CA) mass spectrometer directly coupled to an Agilent 6870 gas chromatograph equipped with a J&W-Ultra 1 column (Agilent Technologies) with a length of 17 m, internal diameter of 0.2 mm and a film thickness of 0.11 μm. The gas chromatograph was operated in constant flow mode at a flow rate of 0.6 ml/min. The oven temperature was as follows: 120°C (0 min) at 60°C/min → 183°C (1.05 min) at 3°C/min → 232°C (0 min) at 40°C/min → 310°C (3 min). Half a microliter was injected in the splitless mode. EI at 70 eV was used.
EI accurate mass measurements (GC-QTOF).
An Agilent 6890N GC system was coupled to a GCT time-of-flight mass spectrometer (Waters, Manchester, U.K.), operating in EI mode. The GC separation was performed using a fused-silica HP-5MS capillary column with a length of 30 m × 0.25 mm i.d. and a film thickness of 0.25 μm (J&W Scientific, Folson, CA). The oven temperature was programmed as follows: 120°C (0 min) at 60°C/min → 183°C (1.05 min) at 3°C/min → 232°C (0 min) at 40°C/min → 310°C (3 min). Helium was used as the carrier gas at 1 ml/min.
The interface and source temperatures were set to 250°C, and a solvent delay of 3 min was selected. The time-of-flight mass spectrometer was operated at a rate of 1 spectrum/s acquisition rate over the mass range m/z 50 to 650, using a multichannel plate voltage of 2500 V. TOF-MS resolution was approximately 7000 (full width at half-maximum). Heptacose (ion monitored m/z 218.9856), used for the daily mass calibration and as lock mass, was injected via a syringe in the reference reservoir at 30°C.
Sample Preparation.
Analysis of the unconjugated fraction was done by adjusting the urine (5 ml) to pH 9.2 by addition of approximately 0.3 g of sodium hydrogen carbonate-potassium carbonate (2:1, w/w). Liquid-liquid extraction was performed by adding 5 ml of diethyl ether and rolling during 20 min. The sample was then centrifuged, and the organic layer was separated, dried with sodium sulfate, and evaporated under nitrogen at 40°C.
For the total (glucuronidated + unconjugated) fraction, 1 ml of phosphate buffer (pH = 7) and 50 μl of β-glucuronidase solution were added to 5 ml of urine. The sample was hydrolyzed during 2.5 h at 56°C. After cooling to room temperature, extraction was performed as described for the unconjugated fraction.
For LC-MS (MSn) analysis, the residue was dissolved in 200 μl of mobile phase and 20 μl were directly injected into the system. For GC-MS analysis, the dry residues were derivatized using 100 μl of N-methyl-N-trimethylsilyltrifluoro-acetamide-NH4I-ethanethiol (320:1:2; v/w/v) at 80°C for 60 min.
To purify the detected metabolites, 500 ml of urine (obtained by pooling appropriate aliquots from the 0–24 h collection period) were extracted with diethyl ether (two 300-ml aliquots). The organic layer was separated, evaporated, and dissolved in 10 ml of N-pentane. The extract was purified by liquid-liquid extraction with water (two 10-ml aliquots). The organic layer was evaporated, reconstituted in 1 ml of methanol-water (1:1) and injected into an on-line solid -phase extraction-LC system as described elsewhere (Sancho et al., 2004). Fractions were collected every 30 s. After evaporation of the solvent, fractions possibly containing metabolites were injected into all MS instruments.
Precursor Ion Analysis (Triple Quadrupole Analyzer).
A precursor ion scan method selecting the product ions at m/z 105, 91, and 77 was used to detect the steroids present in urine (Pozo et al., 2008a). The collision energy was selected at 45 eV for m/z 105 and 91 and at 50 eV for m/z 77. The peak width was set at 0.7 Da and the scan rate at 0.4 s/scan. A gradient program was used with the solvents described above. The percentage of organic solvent was linearly changed as follows: 0 min, 30%; 1.5 min, 30%; 8 min, 55%; 15 min, 55%; 29.5 min, 95%; 30.5 min, 95%; 31 min, 30%; and 34 min, 30%.
Scan Analysis (TOF).
A chromatogram in full-scan mode was acquired using the same chromatographic conditions as for the precursor ion scan method to establish the protonated ion and the molecular formula of the metabolites. The presence of additional adducts such as [M + Na]+ could be helpful in the assignment of the molecular mass. Molecular formula search was performed with the following restrictions regarding the number of atoms: C, 0 to 100; H, 0 to 200; and O, 0 to 20. Only formulae with an exact mass within 5 mDa of the measured value were considered.
Experiments with uPA-SCID Mouse.
Chimeric mice were produced as described before (Meuleman et al., 2005). In brief, uPA+/+-SCID mice were transplanted within 2 weeks after birth with primary human hepatocytes (chimeric mice). uPA-SCID mice that were not transplanted with human hepatocytes served as a control group (nonchimeric mice).
A phosphate-buffer saline suspension of methyltestosterone (40 μg/100 μl) or a placebo solution was administered to the mice via oral gavage according to a double-blind study protocol. The mouse urine was collected using metabolic cages especially designed for small rodents (Tecniplast, Someren, The Netherlands). Because of the design of the metabolic cages, the urine and the feces are perfectly separated. Blank urine samples were collected 24 h before dosage. Afterward, urine was collected every 24 h and stored at −20°C awaiting analysis. The mice had ad libitum access to water and powdered food. The project was approved by the Animal Ethics Committee of the Faculty of Medicine of the Ghent University (ECD 06/09).
Proposed Metabolite Structures.
Once the molecular formula of the metabolites was obtained, their EI spectra in both quadrupole and TOF analyzers were studied and compared with those obtained for methyltestosterone (parent compound). The occurrence of common and related ions was used as an indication for the presence of a part of the structure (Pozo et al., 2008c).
SIM and SRM Methods.
An SIM method for the GC-MS detection of methyltestosterone metabolites was developed by selecting the four most abundant ions for each compound and using the sample treatment and GC-MS conditions described previously (Table 1). An SRM method using the triple quadrupole instrument was developed for the LC-MS/MS monitoring of methyltestosterone metabolites. Three transitions were selected for each metabolite (Table 1). The acquisition time for each transition was set to 100 ms. The same column and mobile phase compositions as in precursor ion analysis were used. To reduce the run-time a gradient program was used with the percentage of organic solvent linearly changed as follows: 0 min, 50%; 1.5 min, 50%; 7 min, 95%; 8 min, 95%; 8.5 min, 50%; and 12 min, 50%.
Experimental conditions in SRM (triple quadrupole analyzer) and SIM (GC-MS) methods for the detection of methyltestosterone metabolites
Synthesis of 6-Ene-epimethyltestosterone.
6-Ene-epimethyltestosterone was synthesized by dehydrogenation of 153 mg of epimethyltestosterone with 304.9 mg of chloranil in 5 ml of t-butanol by refluxing for 4 h following the principle described by Fieser and Fieser (1967). The product was extracted with t-butyl methyl ether from an aqueous KOH solution, and the extract was washed with water. After evaporation under reduced pressure, crystallization from N-hexane/dichloromethane yielded crystals of 6-ene-epimethyltestosterone (76.5 mg). The identity of the compound was confirmed by NMR and mass spectrometry (Figs. 3 and 5).
Results
Precursor Ion Analysis.
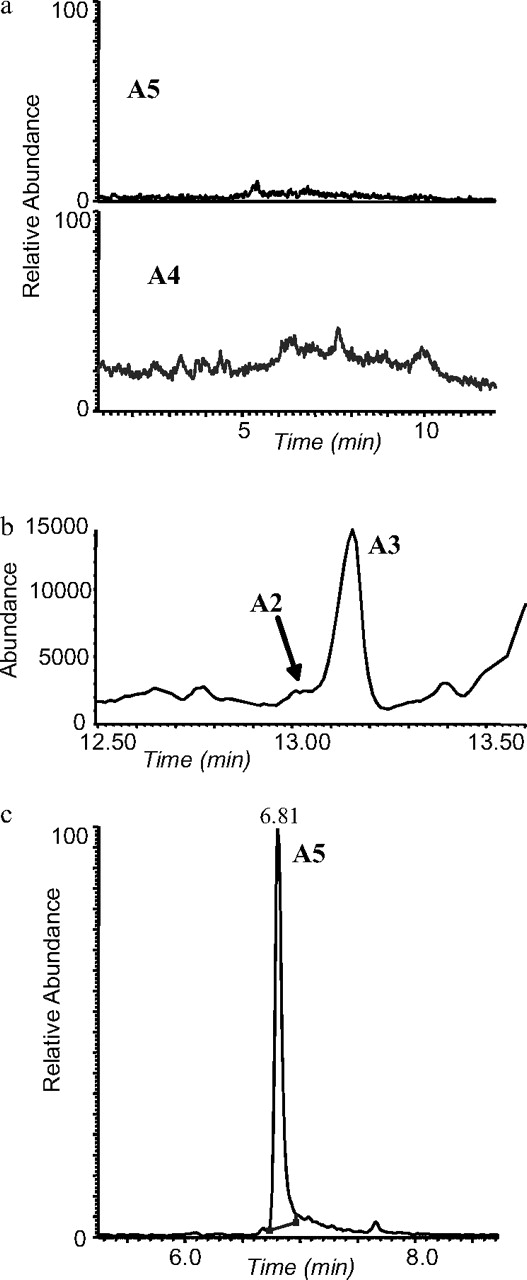
A previously developed precursor ion scan method (Pozo et al., 2008a) was applied to detect the metabolites of methyltestosterone. This method is based on the acquisition of the precursors for ions at m/z 105, 91, and 77. Because of the absence of any additional step such as derivatization, these product ions can be explained from the steroidal skeleton. For this reason, the simultaneous occurrence of these three ions at high collision energy (50 eV) has been described as being specific for many anabolic steroids.
The application of the precursor ion scan approach for a sample reported to be positive for methyltestosterone showed two additional peaks in the unconjugated fraction compared with those in blank samples (Fig. 1). One of the peaks (A4, retention time 22.2 min) shared the same nominal mass with methyltestosterone (m/z 303 for the [M + H]+), whereas the other (A5, retention time 20.8 min) exhibited a difference of 2 Da with the parent drug.

Precursor ion scan chromatograms (top, product ion 105: center, product ion 91; bottom, product ion 77) obtained for the detection of 17α-methyltestosterone metabolites. a, blank urine. b, urine after 17α-methyltestosterone intake. c, spectra for metabolites A4 and A5.
After the analysis of hydrolyzed urine, no additional peaks related to methyltestosterone were found. In addition, the abundance of the metabolites detected was similar in both unhydrolyzed and hydrolyzed urine samples. Therefore, it can be concluded that both metabolites are excreted unconjugated. As expected, no signal was obtained for previously reported metabolites 17α-methyl-5β-androstane-3α,17β-diol and 17α-methyl-5α-androstane-3α,17β-diol because of the absence of any ionizable keto moiety in their structure.
Scan Analysis.
The precursor ion scan method does not distinguish between the signals from [M + H]+ and [M + H − H2O]+ ions (Pozo et al., 2008a). To verify the molecular weight of the metabolites, a full-scan MS analysis was performed. For metabolite A4, besides the ion at m/z 303, three additional ions were obtained at m/z 325, 335, and 357, which can be assigned to the [M + Na]+, [M + H + MeOH]+, and [M + Na + MeOH]+ ions. The occurrence of these ions was in agreement with a previous study (Pozo et al., 2007c) and confirmed that the ion at m/z 303 is [M + H]+. Analogous results were obtained for A5. The ions at m/z 323 and 355 corresponding to [M + Na]+ and [M + Na + MeOH]+ supported the fact that the ion at m/z 301 was [M + H]+.
A scan analysis by the LC-QTOF analyzer was used to obtain the molecular formula of both metabolites. The accurate mass obtained for A4 (m/z 303.2325 for [M + H]+) revealed that this metabolite shared the molecular formula with methyltestosterone (C20H30O2) (Table 2). For metabolite A5, its accurate mass (m/z 301.2168 for [M + H]+) was in agreement with a loss of two hydrogens from the parent drug (C20H28O2) (Table 2).
Further Characterization of Metabolite A4.
CID product ion spectrum.
Metabolite A4 has the same molecular formula as methyltestosterone. The product ion spectrum of this metabolite showed the same ions as the parent drug but in different abundance (Fig. 2). Both analytes showed losses of water and acetone as main ions in the area of m/z close to the precursor ion. This is a common behavior for 17-methylated anabolic steroids (Pozo et al., 2008c) and was supported by accurate mass measurement experiments (Table 2).

CID spectra of (a) 17α-methyltestosterone at 20 eV, (b) metabolite A4 at 20 eV, (c) metabolite A5 at 20 eV, and (d) metabolite A5 at 30 eV.
The main difference between both spectra was the relative abundance of the ions at m/z 245, 229, 227, and 211 (Fig. 2, a and b). Ions at m/z 245 and 227 were more abundant in the methyltestosterone product ion scan (Fig. 2b), whereas ions at m/z 229 and 211 were more abundant in A4 (Fig. 2a).
After increasing the collision energy, two ions at m/z 109 and 97 were the most abundant. As can be seen in Table 2, the accurate mass measurements for these two peaks (109.0648 and 97.0644) corresponded to the formulas C7H9O and C6H9O, respectively (mass errors less than 1 mDa). These ions are characteristic for 3-oxo-4-ene anabolic steroids and have been described for several related compounds (Williams et al., 1999; Thevis and Schänzer, 2007).
EI spectrum.
Similarly to CID, the EI spectrum of the TMS derivative of A4 showed the same ions as methyltestosterone although with different intensities (Fig. 3, a and b). The most abundant ion was m/z 301, corresponding to the loss of a fragment from the D ring. The molecular ion (m/z 446) was still present, and typical losses of 90 (m/z 356) and 105 Da (m/z 341) and typical ions such as m/z 143 were also observed. The accurate masses obtained for all ions (Table 2) were identical for both analytes, indicating that both compounds presented analogous fragmentation.

EI spectra of (a) 17α-methyltestosterone, (b) metabolite A4, and (c) metabolite A5 as their bis-TMS derivatives.
17-Epimethyltestosterone has already been reported as a minor metabolite (Schänzer et al., 1992) of methyltestosterone in man. It represented less than 0.2% of the total excretion for this steroid. In addition, this epimerization has also been found in the horse (Dumasia, 2003). Abundances observed in the spectrum of A4 are in agreement with those reported for 17-epimethyltestosterone (Schänzer et al., 1992). Comparison with the reference material confirmed its structure. According to the accurate mass measurements and with MS3 experiments, a feasible explanation of the fragments obtained for both methyltestosterone and A4 by CID and EI was suggested (Fig. 4).

Proposed pathway for (a) CID fragmentation of methyltestosterone (A1) and A4 and (b) EI fragmentation for 17α-methyltestosterone and metabolite A4 as their bis-TMS derivatives. *, for A1 17-hydroxyl group in position β and 17-methyl group in position α; for A4 17-hydroxyl group in position α and 17-methyl group in position β.
Identification of Metabolite A5.
CID product ion spectrum.
The molecular formula of A5 showed two hydrogen atoms less than methyltestosterone. In contrast with A4, the CID spectrum of A5 at two different collision energies was completely different from that for methyltestosterone (Fig. 2, c and d).
At 20 eV of collision energy, A5 exhibited two losses of water (m/z 283 and 265) and the ion at m/z 225, which can be explained after subsequent losses of H2O and acetone typical for 17-hydroxy-17-methylated steroids (Pozo et al., 2008b). At 30 eV of collision energy, four abundant ions were obtained (m/z 210, 195, 183, and 169). One of them (m/z 210) is an odd electron ion (OE+), which is quite unusual in the fragmentation of anabolic steroids (Pozo et al., 2008c). Other OE+ such as m/z 268 were also found with lower abundance. The molecular formula of every ion was confirmed by accurate measurements with mass errors lower than 2 mDa (Table 2).
EI spectrum.
The comparison between the EI spectra of the TMS derivatives of A5 and methyltestosterone (Fig. 3, a and c) showed common ions (m/z 143 and 193) and ions differing 2 Da (m/z 444, 354, 339, 299, and 245). GC-TOF data (Table 2) were useful in the identification of the fragments obtained for A5. Structural data for this metabolite were not found in the literature.
Comparison with Synthesized Reference Substances.
The synthesis of the reference substance provides the ultimate confirmation about the structure of steroid metabolites (Schänzer and Donike, 1993). Several compounds including 6-ene-epimethyltestosterone have been synthesized to elucidate the final structure of metabolite A5. Both the LC-MS/MS and the GC-MS analysis confirmed that the structure of A5 is 6-ene-epimethyltestosterone (17α-hydroxy-17β-methylandrosta-4,6-dien-3-one). Figure 5 shows the LC-MS/MS chromatograms and MS/MS spectra for the synthesized standard and for the urinary metabolite.

LC-MS and LC-MS/MS data at different collision energies for (a) a standard solution of 6-ene-epimethyltestosterone and (b) metabolite A5.
SRM and SIM Methods.
To detect methyltestosterone metabolites in positive samples, an SRM method and an SIM method were developed for LC-MS/MS and GC-MS, respectively. In the SRM method, three transitions for each analyte were included (Table 1). For the detection of A5 the transition 301 → 210 was included because the use of OE+ as product ions has been defined as an efficient way to increase both specificity and sensitivity of the detection of some anabolic steroids (Pozo et al., 2007a). Metabolites A2 and A3 were not included in the SRM because of the poor electrospray ionization for these analytes. A GC-MS SIM method was created by selecting the four most abundant ions of each metabolite including A2 and A3 (Table 1).
Experiments with uPA-SCID Mouse.
The purity of the suspension of methyltestosterone given to the mice was tested by the SRM method. No peaks were obtained for A4 and A5. The scan analysis of the suspension also revealed the absence of additional peaks. The SRM method was applied to urine samples collected from a chimeric mouse before and after the administration of methyltestosterone. The results were compared with those obtained in urine samples collected from human excretion studies and from a nonchimeric mouse after the administration of the drug.
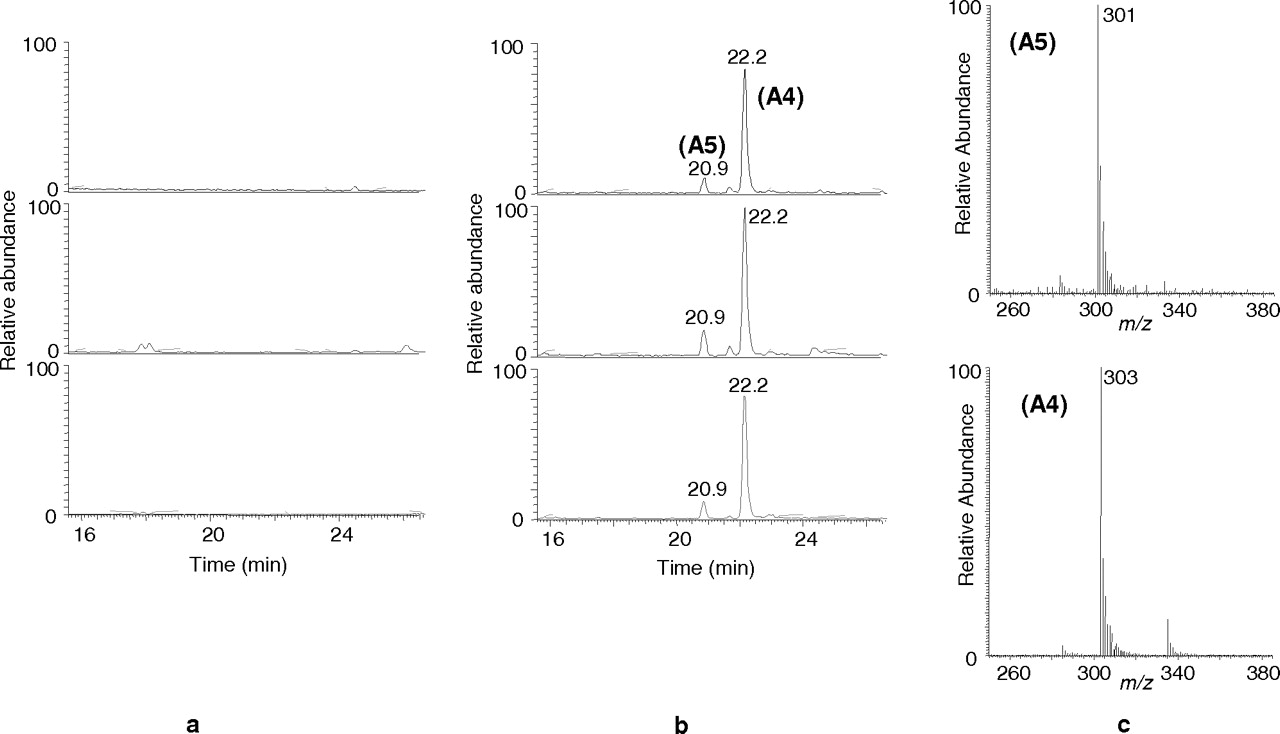
No peaks at the expected retention time were obtained in the chromatogram of the urine collected before the administration (Fig. 6a). Three peaks corresponding to the intact drug (A1) and the metabolites A4 and A5 were detected in urine from both the chimeric mouse (Fig. 6b) and human (Fig. 6c). In the urine collected from the nonchimeric mouse only the parent drug was detected (Fig. 6d).

SRM chromatograms obtained for (a) urine from a chimeric mouse collected before methyltestosterone administration, (b) urine from a chimeric mouse collected 24 h after methyltestosterone administration, (c) human urine collected 24 h after methyltestosterone administration, and (d) urine from a nonchimeric mouse collected 24 h after methyltestosterone administration.
Application to Excretion Studies and Other Positive Samples.
SRM and SIM methods were also applied to the urine samples from an excretion study after the intake of 10 mg of methyltestosterone. None of the metabolites described were detected in the urine collected before the intake (Fig. 7a). With the SRM method A1 was only detectable in the urine samples collected 2 and 4 h after the intake and only after hydrolysis confirming the conjugation of the parent drug. With the SIM method, previously reported metabolites A2 and A3 were detectable after hydrolysis until 2 and 3 days, respectively.
Detection of methyltestosterone misuse in human urine. a, SRM chromatograms for a negative urine sample. b, GC-MS chromatogram for a urine sample suspicious of being positive for methyltestosterone. c, SRM chromatogram confirming the misuse of methyltestosterone.
A4 was detected in both hydrolyzed and unhydrolyzed samples. In the hydrolyzed fraction it could be detected by LC-MS/MS until 36 h after the intake, whereas the detectability increased to 3 days by analyzing the unhydrolyzed fraction. The higher amount of endogenous interferences released after hydrolysis and the associated ion suppression could be the reason for the longer detectability in the unhydrolyzed fraction. By GC-MS A4 was detected in the unhydrolyzed fraction until 12 h after intake.
With LC-MS/MS after sample preparation with and without hydrolysis, A5 was the longest detectable metabolite. It could be detected until 7 days after the intake, which was twice as long as for the other three metabolites. By SIM in GC-MS, A5 was not detectable in the hydrolyzed fraction, probably because the large amounts of A2 and A3 released after hydrolysis hampered its detection due to the poor GC resolution. In the unhydrolyzed fraction A5 was detected by GC-MS until 3 days after the intake.
Four other samples declared positive for methyltestosterone after routine GC-MS analysis were also analyzed by both SRM and SIM methods. All metabolites reported in this study were detected in all samples. In one of these samples, only A3 was detected by GC-MS (Fig. 7b) and therefore, the unequivocal assignment of the methyltestosterone misuse was difficult. The application of the SRM method to the unhydrolyzed sample showed a peak for A5 (Fig. 7c), however, supporting the intake of methyltestosterone.
Discussion
The metabolism of methyltestosterone has been reevaluated by LC-MS/MS. The application of a precursor ion scan method has revealed the presence of two metabolites (A4 and A5), which are not included in the common methods for the detection of methyltestosterone misuse. The presence of both compounds in urine samples collected from the uPA-SCID mouse with humanized liver after methyltestosterone administration confirmed their metabolic nature. In addition, A4 and A5 were not detected in a nonchimeric mouse. Therefore, it can be concluded that both metabolites are produced by the human liver because the only difference between chimeric and nonchimeric mice is the presence of primary human hepatocytes in the liver of the chimeric mouse. These results show the usefulness of the chimeric mouse model for the confirmation of steroid metabolites.
Both metabolites have been characterized by ESI-MS/MS and EI-MS using accurate mass results obtained by a TOF analyzer, and one structure for each metabolite has been suggested according to these data. Whereas A4 can be assigned to the previously reported minor metabolite 17-epimethyltestosterone, no proposal for A5 was found in literature.
Proposal of Structure for A5.
The molecular formula of A5 contained two hydrogen atoms less than methyltestosterone. Therefore, the inclusion of an additional double bond seemed to be the most feasible metabolic pathway. The CID spectrum of A5 was completely different from that of A1 (Fig. 2, c and d). This finding is in agreement with a previous study stating that the addition of a double bond in the steroid structure results in a significantly different CID spectrum (Guan et al., 2006). To suggest a possible structure for A5 two zones of the spectrum were studied: the region close to the [M + H]+ and the most abundant ions at 30 eV of collision energy.
Regarding the first area, the metabolite A5 exhibited two losses of water (m/z 283 and 265), identical to the number of oxygen atoms present in the molecule, which is common for those 3-oxo-steroids without either a 1,4-diene or a 4,9,11-triene function (Pozo et al., 2008c). In addition, the ion at m/z 225 could be explained by the subsequent losses of H2O and acetone, suggesting the presence of a 17-hydroxy-17-methyl moiety in the analyte. Several OE+ were also found (m/z 268 and 210). The occurrence of OE+ in the CID spectrum of steroids is not common and can be related to losses of alkyl groups from C10 and C13 in those steroids in which the radical formed after homolytic fragmentation is sufficiently stabilized by a double bond (Pozo et al., 2008c).
At 30 eV collision energy, four abundant ions were obtained (m/z 210, 195, 183, and 169). The fragmentation pathway for ions at m/z 183 and 169 involves a loss of acetylene, indicating the presence of a HC CH group in the structure. Therefore, the most feasible location for the double bond was position 11 or 6.
OE+ is more commonly found in steroids with a double bond in the C ring (Pozo et al., 2008c). Thus, 11-ene-methyltestosterone was postulated as a feasible structure for A5 (Pozo et al., 2009).
The EI spectra of A5 and the parent drug (Fig. 3, c and a) were compared. They showed common ions and ions differing by 2 Da. The use of GC-TOF data (Table 2) helped in the identification of the fragments obtained.
The ions at m/z 143 and 193 obtained from rings D and A, respectively, were common for both analytes. Therefore, the additional double bond was considered to be located either in ring B or in ring C. Because the ion at m/z 247 (proposal of fragment structure in Fig. 4) present in the structure of A1 was observed at m/z 245 in A5, only five positions for the double bond were possible: 6, 7, 8(9), 9(11), and 11.
Therefore, the structure of A5 (17α-hydroxy-17β-methylandrost-4,6-dien-3-one) was confirmed by the synthesis of the reference compound before the structure could be assigned to this metabolite with absolute certainty. In addition, the synthesis will also reveal some aspects of the metabolite structure such as the orientation of the methyl group of the C17, which cannot be concluded solely from the MS/MS analysis.
Fragmentation Pathway of A5.
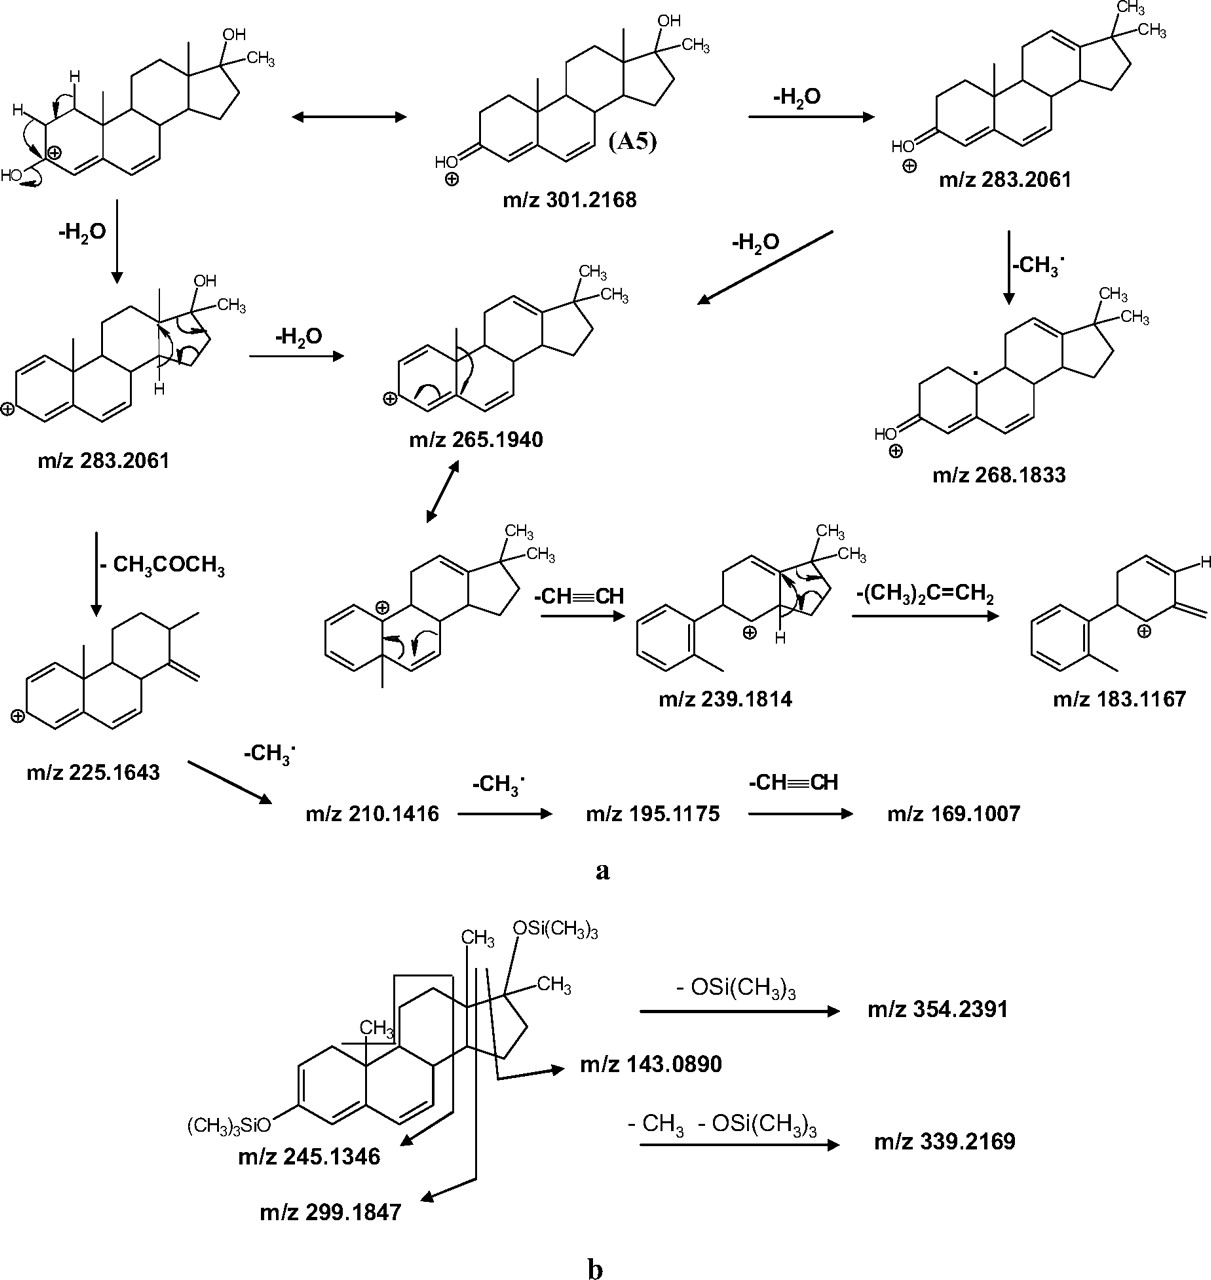
A suggested fragmentation pathway for the ions present in the CID spectrum is shown in Fig. 8. The molecular formulae of these ions were in agreement with those calculated from accurate mass experiments with mass errors less than 2 mDa (Table 2). MS3 experiments also supported these fragmentation pathways. In addition, the proposed EI fragmentation for the bis-TMS derivative of A5 is also presented (Fig. 8).

Proposed pathway for (a) CID fragmentation of metabolite A5 and (b) EI fragmentation of metabolite A5 as a bis-TMS derivative.
Applicability of A4 and A5 to Doping Control Analysis.
A4 was detected by LC-MS/MS as long as A2 and A3 by GC-MS, and A5 was detected even longer. In addition, both A4 and A5 are detected in the unconjugated fraction, which reduces the number of interferences and the total analysis time compared with those for A2 and A3, which are excreted as glucuronides. It is unfortunate that these results have been obtained by a single excretion study and, therefore, a study dealing with a large number of individuals would be necessary to evaluate the detection times. The application of the SRM method to several positive samples (Fig. 7) also indicated that the detection of A4 and A5 can be useful for the unequivocal assignment of methyltestosterone misuse because commonly screened metabolites A2 and A3 are also common for other steroids. Therefore, the detection of A4 and A5 seems to be an efficient alternative to the classic monitoring of methyltestosterone abuse normally performed with A2 and A3.
Acknowledgments.
We gratefully acknowledge the technical assistance of K. Roels, T. Portoles, P. Premereur, and L. Verhoye. We are very grateful to Serveis Centrals d'Instrumentació Científica of University Jaume I for use of the ultraperformance liquid chromatography-QTOF and GC-TOF analyzers.
Footnotes
-
This study was supported by the World Anti-Doping Agency; the Belgian State [IUAP P6/36-HEPRO]; and Ghent University via the Special Research Fund and a Concerted Action Grant [01G00507].
-
Article, publication date, and citation information can be found at http://dmd.aspetjournals.org.
doi:10.1124/dmd.109.028373
- Received May 4, 2009.
- Accepted August 17, 2009.
- Copyright © 2009 by The American Society for Pharmacology and Experimental Therapeutics


