


Abstract
The cytochrome P450 (P450) family of enzymes is a major player in the metabolism of therapeutic drugs available on the market, and the development of novel drugs has to take into account these enzymes in the fate of new drugs. Testing the pharmacokinetic behavior of new drugs in animals is a common part of the drug development process. Pigs are increasingly used for this purpose because of their similarity of enzymatic pattern to humans. In this study, adult Suffolk White pig liver microsomal samples were analyzed using mass-spectrometry-based techniques to identify and relatively quantify the porcine hepatic P450 enzymes. The total corrected microsomal protein content (milligrams of protein per gram of liver tissue) was estimated at 32.6 and 36.2 mg/g liver tissue in two samples, and the main identified liver P450 subfamilies were CYP1A, CYP2A, CYP2C, CYP2D, CYP2E, and CYP3A. Label-free quantification was performed using the exponentially modified protein abundance index, and the highest abundance enzymes were CYP2A19 at 34% and CYP2D25 at 26% of the total identified drug-metabolizing P450 enzymes. The highest abundance subfamilies were CYP2A (34%), CYP2C (16%), CYP2D (26%), and CYP3A (14%). Moreover, primary sequence alignment was used to identify human homologs of the identified porcine P450s. Porcine CYP1A2 and CYP2E1 were shown to be equivalent to human CYP1A2 and CYP2E1, respectively. Porcine CYP2A19 has the highest sequence homology to human CYP2A6 and CYP2A13, and pig CYP2C33v4 and CYP2C49 are the porcine equivalent of human CYP2C9 and CYP2C18, respectively. Both identified pig CYP3A enzymes (CYP3A29 and CYP39) were highly homologous to CYP3A4/5.
Introduction
The pig is a mammalian species of particular interest in pharmacological and toxicological studies because it can be used as a laboratory model for human metabolism without the requirement to induce the enzymes that carry out biotransformations (Hughes and Williams, 1996; Soucek et al., 2001). Pigs are also of wider interest to developing new medicines because they have been considered as a source of liver xenografts and hepatocyte-based liver transplants for patients with liver failure (Hughes and Williams, 1996). Cytochrome P450 (P450) enzymes have a primary role in the metabolism of xenobiotics and a wide range of endogenous compounds. P450 enzymes responsible for drug metabolism have been extensively studied in the pig, and enzymes equivalent to human P450s (e.g., CYP1A, CYP2A6, CYP2E1, and CYP3A4) have been identified in the pig liver using several techniques including enzyme activity assays and Western blotting (Anzenbacher et al., 1998; Desille et al., 1999; Myers et al., 2001; Soucek et al., 2001; Szotakova et al., 2004). However, to date, no proteomics-based studies have been performed to confirm the presence of these homologs and to assess their abundances in the porcine hepatic tissue. Proteomics methods, based on mass spectrometry, have been applied to the human liver, and estimates of the relative abundance of the different P450 enzymes have been made (Seibert et al., 2009). The sensitivity and selectivity of mass spectrometry are attractive for this type of study. The difficulty is that signal intensity depends on many factors, of which analyte concentration is only one, which makes quantification challenging. However, in recent years, numerous stable isotopic and label-free methods for quantification of proteins by mass spectrometry have been developed (Ishihama et al., 2005; Pratt et al., 2006; Silva et al., 2006), and many of these are applicable to P450 enzymes.
In the study presented here, the total protein content in pig liver microsomes was determined using the Bradford assay (Bradford, 1976) and the NADPH P450 reductase activity as a marker for loss of microsomal protein during sample preparation. Pig P450 enzymes equivalent to the main human drug-metabolizing P450s were identified and relatively quantified using label-free proteomics methods. Human homologs of the identified porcine P450 enzymes were found by sequence alignment.
Materials and Methods
Materials and Chemicals.
All chemicals used in this work were purchased from Sigma-Aldrich (Poole, Dorset, UK) unless otherwise stated.
Preparation of Porcine Liver Microsomes.
Liver samples from two Suffolk White adult pigs (Blythburgh Free Range Pork, Blythburgh, UK) were used to produce the microsomal fraction using differential centrifugation (Langenfeld et al., 2009). Homogenization of the liver tissue (1 g) was performed using a Potter-Elvehjem (CamLab, Cambridge, UK) system in potassium phosphate buffer (0.25 M, pH 7.25, and 1.15% KCl) at 10 ml for each gram of liver tissue. The homogenate was centrifuged at 10,000g for 20 min at 4°C, and the supernatant was collected and centrifuged with an OptimaTM L-100 ultracentrifuge (Beckman Coulter, Inc., Fullerton, CA) at 100,000g for 75 min at 4°C. The microsomal pellet was resuspended in 1 ml of storage buffer (0.25 M potassium phosphate, pH 7.25, and 30% v/v glycerol) per gram of liver tissue before storage at −80°C.
Measurement of Cytochrome P450 Reductase Activity.
To estimate the loss of cytochrome P450 enzymes due to fractionation, the activity of NADPH P450 reductase was measured in homogenates and microsomal fractions produced from the same amount of liver tissue (1 μg). The protocol was adapted from that of Guengerich et al. (2009). Oxidized equine cytochrome c (0.5 mM, 80 μl) was mixed with 10 μl of homogenate, and the mixture was made up to 990 μl with potassium phosphate buffer containing 1 mM KCN. Baseline absorbance at 550 nm of this diluted solution was measured in kinetic mode every 20 s for 2 min. After this period, 10 μl of reduced NADPH solution (10 mM) was added to initiate the reaction of cytochrome c reduction. Absorbance was then monitored for a further 4 min. To monitor the activity of NADPH P450 reductase in the microsomal fraction obtained from the same amount of liver tissue (1 μg), the microsomal fraction was diluted 1 in 10, and 10 μl of diluted suspension was used to monitor P450 reductase activity in the same way. The amount of protein in the microsomal fraction was estimated according to the Bradford protein assay using Coomassie protein assay reagent. The slope of the initial phase of the cytochrome P450 reductase activity is directly proportional to the amount of this enzyme in the sample (Guengerich et al., 2009). The ratio of the slopes in the homogenate and the microsomal fraction provides the percentage loss of this enzyme, which can be used as an estimate of total loss of microsomal protein.
SDS-PAGE and In-Gel Digestion of Microsomal Protein Bands.
Electrophoresis was performed on a vertical mini Protean 3 system (Bio-Rad Laboratories, Hercules, CA). A 10% polyacrylamide resolving gel (10 ml) was prepared by mixing distilled water (4 ml), 30% acryl-bisacrylamide mix (3.3 ml, Bio-Rad), 1.5 M Tris-HCl buffer (pH 8.8; 2.5 ml), 10% SDS (0.1 ml), 10% ammonium persulfate solution (0.1 ml), and TEMED (4 μl). A 5% stacking gel (3 ml) was prepared by mixing H2O (2.1 ml), 30% acryl-bisacrylamide (0.5 ml), 1.5 M Tris-HCl (pH 6.8; 0.38 ml), 10% SDS (30 μl), 10% ammonium persulfate solution (30 μl), and TEMED (3 μl). Solubilized microsomal proteins (15 μg as measured by the Bradford assay) were loaded on each well after mixing with a sample buffer and heating for 10 min at 95°C. Ten bands were visible on each lane and all of them were excised and in-gel digested using 2% w/w trypsin overnight at 37°C in 50 mM ammonium bicarbonate buffer.
MALDI-TOF Data Acquisition and Analysis.
MALDI-TOF mass spectrometry was performed on an Ultraflex II (Bruker, Bremen, Germany) instrument. To confirm that the fractionation protocol was adequate, digested proteins from bands 1 to 10 were analyzed using MALDI-TOF mass spectrometry. A MALDI matrix was prepared by dissolving 10 mg of α-cyano-4-hydroxycinnamic acid (Fluka, Buchs, Switzerland) in 0.1% trifluoroacetic acid in 50% acetonitrile in water (0.5 ml). Sample (0.5 μl) and matrix solution (0.5 μl) were mixed and then spotted on a MALDI target and left to dry at room temperature. QCal (Michael Barber Center for Mass Spectrometry, Manchester, UK), calibrant (Eyers et al., 2008) was used for MALDI MS calibration. Spectra were acquired in the range m/z 500 to 4000. A laser frequency of 100 Hz and an intensity of 30 to 35% was used. Five hundred laser shots were fired per spectrum, and four spectra were acquired per spot. Analysis of data was performed using FlexAnalysis software (Bruker).
Peptide mass fingerprinting was used for the purpose of identification using the SwissProt, MSDB, and trEMBL databases searched with Mascot 2.3 (Matrix Science Ltd., London, UK). The search of spectral data was repeated twice to identify less abundant proteins in the same band by removing the most abundant peptides from the analysis. The criteria used for accepting protein identities in the search were the species (Sus scrofa), the molecular weight estimation, and the subcellular location of the proteins.
LC Electrospray Ionization MS/MS Data Acquisition and Analysis.
LC MS/MS experiments were performed using an Ultimate 3000 LC system (Dionex, Sunnyvale, CA) connected in-line to a quadrupole TOF Global mass spectrometer (Waters, Milford, MA). For the LC, buffer A (2% acetonitrile and 0.1% formic acid in water) and buffer B (95% acetonitrile and 0.1% formic acid in water) were used at a flow rate of 200 nl · min−1. Peptides were eluded with a linear gradient of 10 to 50% buffer B over 45 min. MS data were collected for m/z 350 to 1600. For MS/MS data generation, the collision-induced dissociation mode with argon as the collision gas was used, and data were collected over m/z 50 to 1600.
Peak list files were generated from MS/MS data using MassLynx version 4.0 (Waters) and were submitted to Mascot to search against the SwissProt, MSDB, TrEMBL, and NBCInr databases. BLAST searches of identified peptides were performed against the first draft of the pig genome/proteome, PiGenome (Department of Agricultural Biotechnology, Seoul National University, Seoul, South Korea) (Lim et al., 2009).
Label-Free Quantification Using MS/MS Data.
Label-free quantification was used to estimate the relative abundances of the identified enzymes using the exponentially modified protein abundance index (emPAI) (Ishihama et al., 2005). These values were provided by the Mascot search engine and are proportional to the MS/MS spectral counts of detected peptides in each identified protein. The following equation was used to calculate the percentage relative abundance of each P450 enzyme:

The following equations are used to calculate the emPAI values:
 where the number of observable peptides is the number of peptides obtained in a theoretical digest.
emPAI values rely on spectral counting and have been shown empirically to be proportional to the amount of protein in mixtures (Ishihama et al., 2005). A similar method was used by Seibert et al. (2009) to determine the approximate abundance of human P450 enzymes.
Sequence Homology Analysis of Porcine P450 Enzymes.
Sequence alignment of human and porcine P450 enzymes was performed to identify the human homologs of the identified pig enzymes. Sequences of human P450 enzymes were accessed through the UniProt database (www.uniprot.org), and the porcine cytochrome P450 sequences were obtained from the MSDB, NCBInr, and the PiGenome databases. The alignment was performed using the EMBOSS (European Molecular Biology Open Software Suite) Needleman-Wunsch pairwise alignment algorithm (Needleman and Wunsch, 1970) provided by the European Bio-Informatics Institute (www.ebi.ac.uk). Sequences from the same and different subfamilies were compared. Percentage sequence identity and similarity were calculated. Similarity indicates closely related residues with regard to their size and physicochemical properties.
Results
Estimation of Microsomal Protein Content (mg protein per gram liver tissue, MPPGL).
The protein content in both liver microsomal samples was estimated using the Bradford assay. These measurements were corrected for protein loss using recovery ratios generated from NADPH cytochrome P450 reductase activity plots. NADPH P450 reductase activity was measured in the homogenate and microsomal fraction, and activity was plotted against time (Fig. 1). The slope of the initial linear phase is directly proportional to the concentration of P450 reductase enzyme, and the ratio of the activity slopes relating to the microsomes and homogenates enables the correction of the protein content measurement by taking protein loss into account. The amounts estimated using the Bradford assay were divided by the percentage loss of protein due to fractionation. The mean corrected microsomal protein content was estimated at 34.4 mg/protein per gram of liver tissue (Table 1).
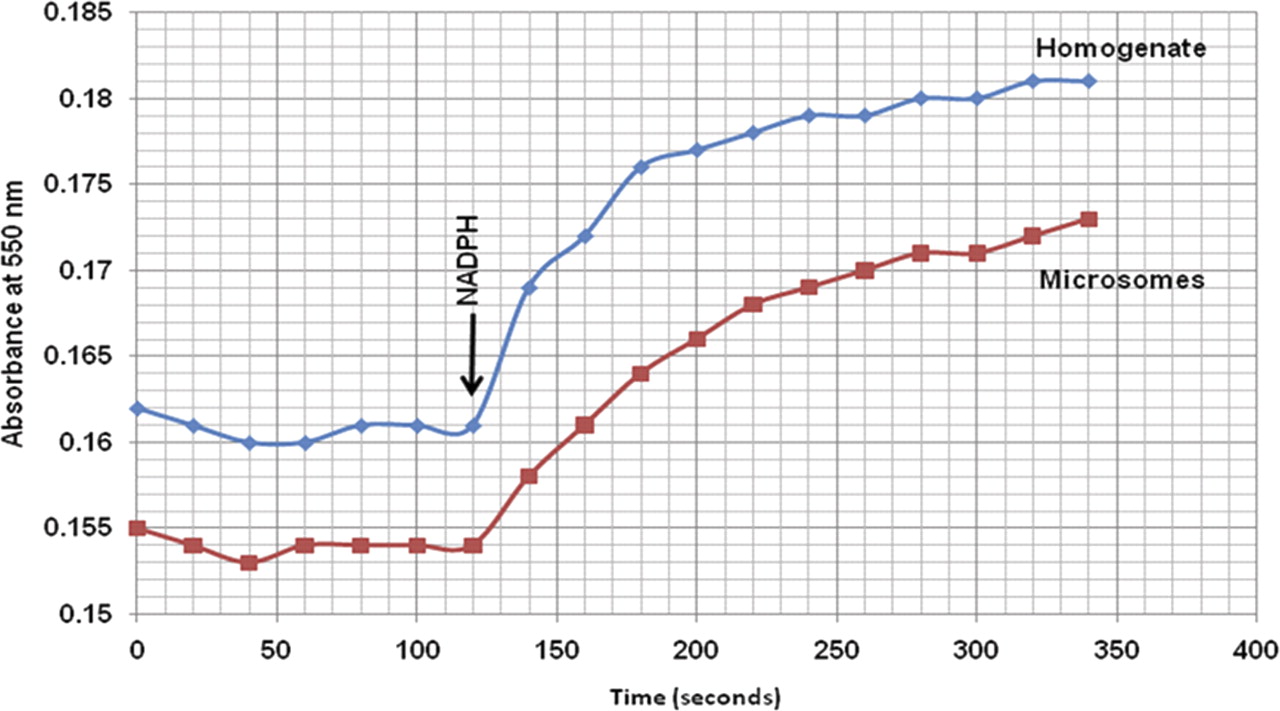
NADPH P450 reductase activity in homogenate and microsomal suspensions of pig liver tissue. NADPH was added after 120 s. Absorbance was measured at 550 nm to represent the amount of reduced equine cytochrome c. Recovery ratios were calculated based on the slopes the initial linear phase of the graphs, which are proportional to the amount of NADPH cytochrome P450 reductase in the samples.
Total microsomal protein content before and after correction
The Bradford assay was used to measure total protein in the microsomal fraction. Ratios were obtained from NADPH P450 reductase activity measurements. The average amount of microsomal protein was estimated at 34.4 mg/g liver tissue.
Solubilization of Microsomal Proteins and MALDI MS Data.
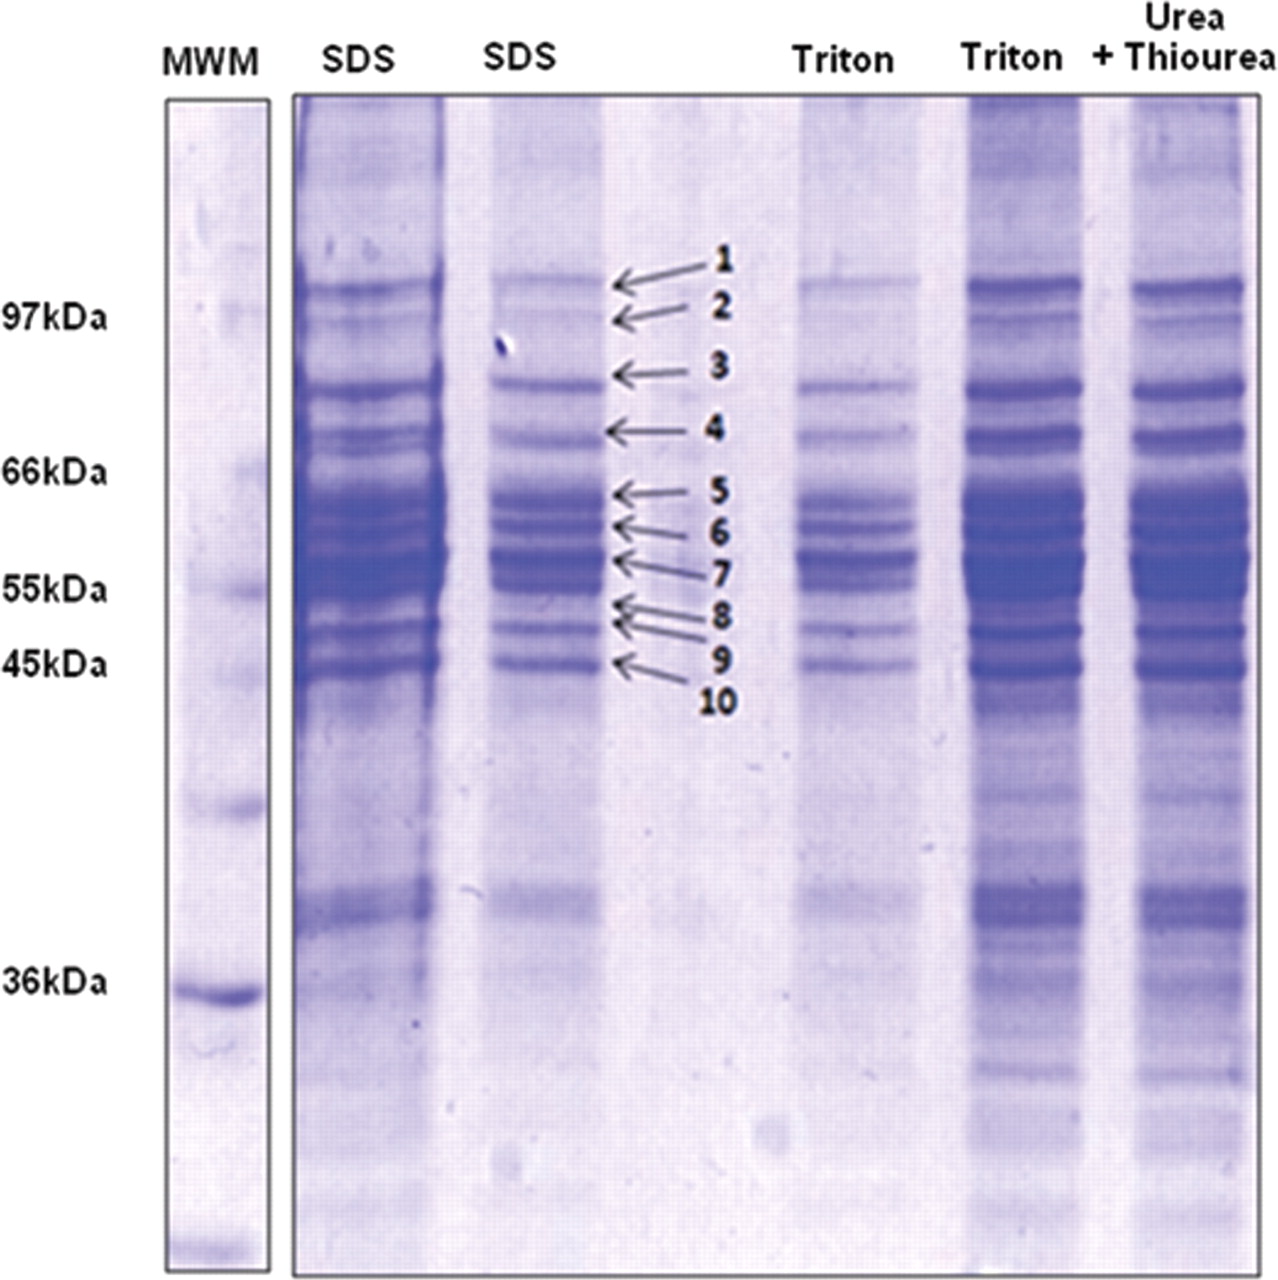
Three established methods for solubilization of membrane-bound proteins were compared. Protocols based on SDS and Triton X-100 solubilized a comparable range of P450 enzymes, as identified by MALDI MS, whereas urea and thiourea solubilized fewer P450 proteins (Table 2). All 10 bands in the one-dimensional SDS-PAGE gel were analyzed, but only bands 7, 8, and 9 (molecular mass 45–60 kDa) contained P450 enzymes (Fig. 2). The Triton X-100 and urea/thiourea methods each involved a protein precipitation step using either ice-cold acetone or a methanol/chloroform mixture. This resulted in a protein loss of 40 to 60% and a reduction in the range of identified P450 enzymes. For these reasons, only samples solubilized with SDS were analyzed by LC MS/MS for the purpose of identification and relative quantification of drug-metabolizing P450 enzymes.
Cytochrome P450 proteins identified from tryptic digests of protein bands 7, 8, and 9 resolved using SDS-PAGE
Identification was carried out by submitting MALDI-TOF MS data to a peptide mass fingerprint search using Mascot and suitable databases. The P450 region was shown to be 45 to 60 kDa.

Coomassie-stained SDS-PAGE of the microsomal fraction of Suffolk White pig liver. Solubilization of proteins from the microsomal bilayer was performed using SDS, Triton X-100, or chaotropic agents (urea and thiourea). MWM, molecular weight marker.
LC-MS/MS Data and Relative Quantification of Porcine Liver Drug-Metabolizing P450 Enzymes.
LC-MS/MS data confirmed the range of P450 enzymes identified by MALDI MS and allowed for the identification of additional enzymes (Table 3). For the purpose of quantification, the whole P450 region (bands 7–9, molecular mass 45–60 kDa) was analyzed with LC in conjunction with MS/MS, and the values of the exponentially modified protein abundance index were generated by Mascot using the Swissprot, MSDB, NCBInr, and trEMBL databases. These were used to generate molar percentage abundances of different drug-metabolizing P450 enzymes (Fig. 3). The main identified P450 subfamilies were CYP2A (34% of the total identified drug-metabolizing P450 enzymes), CYP2C (16%), CYP2D (26%), CYP2E (8%), and CYP3A (14%). The highest abundance individual P450 enzymes were CYP2A19 and CYP2D25, comprising 60% of the total identified drug-metabolizing P450 enzymes.
P450 enzymes identified using LC MS/MS data and database searching with Mascot
Microsomal proteins were resolved using SDS-PAGE, and gel bands 7, 8, and 9 were used for identification and relative quantification of P450 enzymes. The databases used for identification were Swissprot, MSDB, trEMBL, and NCBInr. The best proteotypic peptides were used to confirm the identified proteins and can be used for absolute quantification with AQUA or QconCAT. These peptides were unique for each of the proteins and were selected to ensure complete digestion with trypsin and limited modifications for highly reactive amino acid residues (cysteines and methionines).

Relative abundances of the pig liver drug-metabolizing P450 enzymes identified by LC quadrupole TOF MS/MS and database searching. The abundances were calculated using the emPAI. Enzymes are in alphanumerical order. n = 2.
Unique peptides that can be used for absolute quantification of porcine P450 enzymes were also identified by performing BLAST searches of each peptide used for identification and label-free quantification against different databases, including NCBI, UniProt, and PiGenome. These peptides were selected to avoid missed cleavages by trypsin (adjacent arginines and lysines) and highly modifiable residues (cysteines and methionines). The results are summarized in Table 3.
Homology Analysis of Identified Porcine P450s to Identify Human Analogs.
The primary amino acid sequence alignment of porcine and human enzymes showed the probable human homologs of the identified porcine P450 enzymes. The alignment followed the EMBOSS Needleman-Wunsch algorithm provided by the European Bioinformatics Institute (http://www.ebi.ac.uk). Table 4 shows the human isoforms that show the highest sequence homology, identity and similarity, to the identified porcine P450 enzymes. Porcine CYP2A19 was shown to be equivalent to human CYP2A13 and CYP2A6, whereas CYP2C33v4 and CYP2C49 are the porcine homologs of human CYP2C9 and CYP2C18, respectively. CYP2D25 was shown to be the porcine CYP2D6, whereas CYP3A29 and CYP3A39 are the homologs of human CYP3A4 and CYP3A5. CYP1A2 and CYP2E1 enzymes were shown to be conserved in both species.
The identified porcine P450 enzymes and the human P450 analogs that showed high primary sequence identity and similarity
The alignment was performed using the EMBOSS pairwise alignment algorithm tool provided by the European Bioinformatics Institute.
Discussion
The relationship between the intensity of a signal and the concentration of the analyte in mass spectrometry is complex and not well understood. Label-free methods of quantification are therefore empirical, and the theoretical basis still needs to be established. However, Ishihama et al. (2005) have demonstrated excellent correlation with methods based on stable isotope labeling over a wide range of molecular weights. For similar, abundant proteins, such as those measured here, the method is expected to be especially robust.
There is an increasing interest in the use of pigs and mini-pigs for the purpose of studying pharmacokinetics. However, for the pig (or mini-pig) to be established as an alternative model in pharmacological and toxicological studies to other mammalian species, the range and abundance of P450 enzymes that are expressed in the porcine hepatocytes have to be examined. In this study, the main drug-metabolizing P450 enzymes were investigated to confirm their existence at the protein level and to relatively quantify them using proteomic methods. The presence of P450 subfamilies CYP1A, CYP2A, CYP2C, CYP2D, CYP2E, and CYP3A was demonstrated by MALDI-TOF MS and LC electrospray ionization QTOF MS/MS, and the sequences were analyzed to define the best representative peptides for absolute quantification studies. These findings are in line with the data obtained using activity assays and Western blotting on farm pig and mini-pig liver microsomal samples (Anzenbacher et al., 1998; Soucek et al., 2001).
The mean corrected MPPGL of the pig was found to be approximately 34.4 mg/g, a value that is close to the mean human MPPGL estimated recently at 32 mg/g (Barter et al., 2007). The relative quantification of pig P450 enzymes showed that the main P450 subfamilies are CYP2A, CYP2D, CYP2C, and CYP3A in order of abundance, among which CYP2A19 and CYP2D25 are the most abundant isoforms. This is an interesting contrast to mRNA data obtained using reverse-transcriptase polymerase chain reaction in a recent study. The most highly expressed mRNAs were found to be CYP2C33v4, CYP2C49, and CYP2E1 followed by CYP2A19. The expression levels of CYP2D and CYP3A were not examined (Kojima and Morozumi, 2004). The subfamily data were similar to our data, with the highest levels of mRNA observed encoding the CYP2C, CYP2E, and CYP2A subfamilies. Transcription and translation are separately controlled, and mRNA and protein levels do not necessarily correlate.
The sequence homology between the human and porcine P450 enzymes is striking, with identity in the range 72 to 95% and similarity rising to nearly 98%. Substrate specificities of porcine P450 enzymes have previously been compared with human enzymes, and our results are in reassuring accord with these data (Anzenbacher et al., 1998; Kojima and Morozumi, 2004). The data on sequence homology seem to agree with studies of metabolic specificity in the sense that the porcine and human enzymes from the same P450 subfamily seem to have the highest sequence homology and the same substrate specificity. Porcine and human CYP1A2 and CYP2E1 sequences were especially similar, and this observation was in agreement with the fact that CYP1A and CYP2E are conserved across mammalian species (Gonzalez, 2002). CYP2A19 was highly homologous to human CYP2A6 and CYP2A13 at the amino acid level and the nucleotide level as shown in a previous study (Kojima and Morozumi, 2004), and CYP2A19 showed human CYP2A6 activity (coumarin 7-hydroxylation) (Anzenbacher et al., 1998). Human CYP2C18 showed the highest amino acid sequence homology to porcine CYP2C49, and homology was also shown at the nucleotide level (Kojima and Morozumi, 2004).
Human CYP2C9 was very similar to porcine CYP2C33v4. Sequence alignment of CYP2C49 and CYP2C33v4 showed that there is low identity between them (61.3%), indicating that they may have different substrate specificities. The high similarity between the sequences of CYP2D25 and human CYP2D6 is in agreement with the data from activity assays, which suggested that CYP2D6 and CYP2D25 have the same metabolic activity (bufuralol 1′-hydroxylation) (Anzenbacher et al., 1998). Moreover, sequence analysis showed that CYP3A29 and CYP3A39 were homologous to human CYP3A4 and CYP3A5. The sequences of CYP3A29 and CYP3A39 were also similar (identity of 88.9%), possibly indicating a common scope of metabolic specificity. Enzyme activity assays showed that porcine CYP3A has the same specificity as human CYP3A (nifedipine oxidation and testosterone 6β-hydroxylation) (Anzenbacher et al., 1998).
Conclusions
The Pig Liver Pie has been established using proteomic techniques. Extensive sequence homology (Kojima and Morozumi, 2004) and metabolic activity (Anzenbacher et al., 1998) between the human and pig liver P450 enzymes have been demonstrated by others. To this, we add critical quantitative data that illustrate that the distribution of the different families of P450 enzymes in the liver is also similar in these two species.
Authorship Contributions
Participated in research design: Achour, Barber, and Rostami-Hodjegan.
Conducted experiments: Achour.
Contributed new reagents or analytic tools: Achour and Barber.
Performed data analysis: Achour and Barber.
Wrote or contributed to the writing of the manuscript: Achour, Barber, and Rostami-Hodjegan.
Acknowledgments
We thank Dr. Matthew Russell for critical review of the work and James Kay for assisting with the preparation of the manuscript.
Footnotes
Article, publication date, and citation information can be found at http://dmd.aspetjournals.org.
doi:10.1124/dmd.111.040618.
-
ABBREVIATIONS:
- P450
- cytochrome P450
- PAGE
- polyacrylamide gel electrophoresis
- TEMED
- N,N,N′,N′-tetramethylethylenediamine
- MALDI-TOF
- matrix-assisted laser desorption ionization/time-of-flight
- MS
- mass spectrometry
- LC
- liquid chromatography
- MS/MS
- tandem mass spectrometry
- emPAI
- exponentially modified protein abundance index
- MPPGL
- mg protein per gram liver tissue.
- Received May 31, 2011.
- Accepted July 27, 2011.
- Copyright © 2011 by The American Society for Pharmacology and Experimental Therapeutics


