


Abstract
We studied the effects of the CYP2C8 inhibitor trimethoprim and CYP2C8 genotype on the pharmacokinetics of the antidiabetic pioglitazone. In a randomized crossover study, 16 healthy volunteers with the CYP2C8*1/*1 (n = 8), *1/*3 (n = 5), or *3/*3 (n = 3) genotype ingested 160 mg of trimethoprim or placebo twice daily for 6 days. On day 3, they ingested 15 mg of pioglitazone. The effects of trimethoprim on pioglitazone were characterized in vitro. Trimethoprim raised the area under the plasma pioglitazone concentration-time curve (AUC0–∞) by 42% (p < 0.001) and decreased the formation rates of pioglitazone metabolites M-IV and M-III (p < 0.001). During the placebo phase, the weight-adjusted AUC0–∞ of pioglitazone was 34% smaller in the CYP2C8*3/*3 group and 26% smaller in the CYP2C8*1/*3 group than in the CYP2C8*1/*1 group (p < 0.05). Trimethoprim inhibited M-IV formation in vitro (inhibition constant 38.2 μM), predicting the in vivo interaction. In conclusion, drug interactions and pharmacogenetics affecting the CYP2C8 enzyme may change the safety of pioglitazone.
The thiazolidinedione pioglitazone is a peroxisome proliferator-activated receptor γ agonist used in the treatment of type 2 diabetes. The oral bioavailability of pioglitazone is >80%, and it is extensively (>97%) bound to plasma proteins (Eckland and Danhof, 2000). Pioglitazone is metabolized by hydroxylation and oxidation to several metabolites (Eckland and Danhof, 2000). The pharmacologically active metabolites M-IV and M-III (a secondary metabolite formed from M-IV) are the main metabolites found in human serum (Eckland and Danhof, 2000). Unlike some earlier reports (Eckland and Danhof, 2000; Hanefeld, 2001), recent in vitro and in vivo studies strongly suggest that pioglitazone is metabolized mainly by cytochrome P450 (P450) 2C8, and to a lesser extent by CYP3A4 (Jaakkola et al., 2005; Jaakkola et al., 2006b). Gemfibrozil, which is in vivo a strong inhibitor of CYP2C8 (Backman et al., 2002; Ogilvie et al., 2006) and of the hepatic uptake transporter organic anion-transporting polypeptide 1B1 (Shitara et al., 2004), has increased the mean area under the plasma concentration-time curve (AUC) of pioglitazone by 3.2-fold (Jaakkola et al., 2005). On the other hand, itraconazole, a strong inhibitor of CYP3A4 (Back and Tjia, 1991; Olkkola et al., 1994), has had no effect on the pharmacokinetics of pioglitazone (Jaakkola et al., 2005), indicating that the role of CYP3A4 in the metabolism of pioglitazone in vivo is limited.
The CYP2C8 enzyme is genetically polymorphic, and certain variants causing functional effects on enzyme activity have been described (Dai et al., 2001). CYP2C8.3 (CYP2C8*3), with Arg139Lys and Lys399Arg amino acid substitutions, has shown a reduced turnover rate for paclitaxel, arachidonic acid, and amodiaquine in vitro (Dai et al., 2001; Parikh et al., 2007). In contrast to these in vitro findings, the CYP2C8*3 allele has been associated with increased clearance and decreased plasma concentrations of the oral antidiabetics repaglinide and rosiglitazone (Niemi et al., 2003c, 2005; Kirchheiner et al., 2006). On the other hand, the clearance of the CYP2C8 substrate R-ibuprofen has been reduced in subjects carrying the CYP2C8*3 allele, compared with subjects with the CYP2C8*1/*1 reference genotype (García-Martín et al., 2004). Accordingly, the in vivo significance of the CYP2C8*3 allele has been somewhat controversial. The frequency of CYP2C8*3 in white subjects is approximately 10 to 20% and is only approximately 2% in black subjects (Totah and Rettie, 2005).
The antimicrobial drug trimethoprim is a selective and moderately potent inhibitor of CYP2C8 in vitro (Wen et al., 2002). In vivo, trimethoprim has raised the AUC of the CYP2C8 substrates repaglinide and rosiglitazone by 61 and 37%, respectively (Niemi et al., 2004a,b). In the present study, we investigated the effects of trimethoprim, given at 160 mg twice daily, and of the CYP2C8 genotype on the pharmacokinetics of 15 mg of pioglitazone in eight noncarriers and eight carriers of the CYP2C8*3 allele (Table 1). The predictability of the trimethoprim-pioglitazone interaction was also evaluated using in vitro pharmacokinetic studies.
Characteristics of subjects
Materials and Methods
Subjects. Sixteen healthy volunteers (8 men and 8 women; mean age 21 years, range 19–25 years) (Table 1) participated in the study after giving written informed consent. They were recruited from a pool of more than 400 pharmacogenetically characterized subjects genotyped for CYP2C8 alleles. Genotyping for the CYP2C8*3 (c.416G>A, c.1196A>G) and CYP2C8*4 (c.792C>G) alleles was achieved by using Custom TaqMan single nucleotide polymorphism genotyping assays on an Applied Biosystems 7300 real-time polymerase chain reaction system (Applied Biosystems, Foster City, CA). Genotyping accuracy was validated against a previously described method (Niemi et al., 2003c). The participants were selected on the basis of the CYP2C8 genotype and allocated into three groups: CYP2C8*1/*1 (i.e., noncarriers of CYP2C8*3; n = 8), CYP2C8*1/*3 (n = 5), and CYP2C8*3/*3 (n = 3). Only noncarriers of the CYP2C8*4 allele were recruited. None of the subjects had participated in our previous studies on the effects of the CYP2C8*3 allele on the pharmacokinetics of repaglinide (Niemi et al., 2003c,2005). The volunteers were ascertained to be healthy by medical history, physical examination, and routine laboratory tests before entering the study. None of the volunteers used continuous medication, e.g., oral contraceptives, or were smokers. The sample size was chosen so that a possible clinically significant pharmacokinetic drug interaction could be verified statistically without the use of an unnecessarily large group of healthy subjects. The number of subjects was estimated to be sufficient to detect a 25% change in the AUC0–∞ of pioglitazone with a power of 90% (α level 5%).
Study Design. The study protocol was approved by the Coordinating Ethics Committee of the Helsinki and Uusimaa Hospital District and the National Agency for Medicines. A randomized, two-phase crossover study with a washout period of 4 weeks was carried out. The volunteers received 160 mg of trimethoprim orally for 6 days (Trimetin, 160 mg tablet; Vitabalans, Hämeenlinna, Finland) or placebo (Yliopiston apteekki, Helsinki, Finland) twice daily at 8 AM and 8 PM with the exception of the evening dose on day 3, which was administered at 9 PM. On day 3, a single oral dose of 15 mg of pioglitazone (Actos, one 15-mg tablet; Takeda Europe, London, UK) was administered with 150 ml of water at 9 AM, i.e., 1 h after trimethoprim. The volunteers fasted overnight and had a warm standard meal 3 h and a light standard meal 7 and 11 h after pioglitazone intake.
Sampling. On the days of administration of pioglitazone, a forearm vein of each subject was cannulated with a plastic cannula, which was kept patent with an obturator. Timed blood samples were drawn before and 1, 2, 3, 4, 5, 7, 9, 12, 24, 48, 72, and 96 h after the administration of pioglitazone. The blood samples (10 ml each) were taken into tubes that contained EDTA. Plasma was separated within 30 min after blood sampling and stored at -70°C until analysis.
Determination of Drug Concentrations. Pioglitazone plasma and in vitro samples (0.5 ml) were spiked with 50 μl of internal standard (3 μg/ml rosiglitazone in 20% methanol) and 100 μl of perchloric acid (35%), vortex mixed and centrifuged. The supernatants were applied to the MCX solid-phase extraction cartridges (Waters, Milford, MA), which had been conditioned with 1 ml of methanol and 1 ml of water. The cartridges were then washed with 1 ml of 0.1 M hydrochloric acid and 1 ml of 70% methanol before elution with 1 ml of 2% ammonium hydroxide in methanol. The eluent was evaporated to dryness under a nitrogen stream (50°C), after which the residues were dissolved in 100 μl of acetonitrile-water (45:55 v/v) and transferred to autosampler vials.
The concentrations of pioglitazone and its metabolites M-IV and M-III were measured by use of a PE SCIEX API 2000 liquid chromatography-tandem mass spectrometry system (Sciex Division of MDS, Toronto, ON, Canada) (Lin et al., 2003). Chromatography was performed on an XTerra RP C18 column (3.9 × 100 mm; Waters, Milford, MA) using gradient elution. The mobile phase consisted of 10 mM ammonium acetate (pH 9.5, adjusted with 25% ammonia solution) (A) and acetonitrile (B), and the flow rate was 400 μl/min. The mobile phase gradient comprised 0 min at 5% B, 1 min to 20% B, 12 min to 60% B, 2 min at 100% B, and 5 min at 5% B, giving a total chromatographic run time of 20 min. The mass spectrometer was operated in the atmospheric pressure chemical ionization with the positive ion detection mode. The ion transitions monitored were m/z 357 to m/z 134 for pioglitazone, m/z 373 to m/z 150 for M-IV, m/z 371 to m/z 148 for M-III, and m/z 358 to m/z 135 for rosiglitazone. These transitions represent the product ions of the [M + H]+ ions of the parent pioglitazone, its two metabolites, and the internal standard (Jaakkola et al., 2006a). The limit of quantification for pioglitazone, M-IV, and M-III was 0.1 ng/ml and the interday coefficients of variation were 5 to 10%, 9 to 14%, and 5 to 7% at relevant plasma concentrations, respectively. Trimethoprim did not interfere with the assay.
Plasma trimethoprim concentrations were measured by high-performance liquid chromatography with ultraviolet detection (Weber et al., 1983; Svirbely and Pesce, 1987). The limit of quantification was 0.1 μg/ml, and the interday coefficients of variation were less than 5% at relevant concentrations.
Pharmacokinetics. The pharmacokinetics of pioglitazone were characterized by Cmax, time to Cmax, AUC0–∞, the dominant elimination half-life (t1/2, the half-life of the phase contributing most to the area under the curve), and the terminal half-life (t1/2, terminal). The pharmacokinetics of the metabolites M-IV and M-III were characterized by Cmax, AUC0–∞ and t1/2. Apparent formation rate constants were calculated for metabolites M-IV and M-III by individual modeling with a one-compartment first-order formation model. In 15 of the 16 subjects, the plasma concentrations of pioglitazone declined biphasically during both study phases. In one subject (number 5), the concentration declined monophasically during both phases. Therefore, for the dominant elimination phase, the elimination rate constant (ke) was determined by linear regression analysis using the first log-linear phase of the descending plasma concentration curve. For the slow elimination phase, a terminal elimination rate constant (ke, terminal) was determined. The plasma concentrations of M-IV and M-III declined monophasically, and their ke values were determined as above. The t1/2 values were calculated from the equation t1/2 = ln2/ke. The AUC values were calculated by use of the linear trapezoidal rule for the rising phase of the plasma concentration-time curve and the log-linear trapezoidal rule for the descending phase, with extrapolation to infinity, by division of the last measured concentration by ke, terminal for pioglitazone, and ke for M-IV and M-III. The pharmacokinetics of trimethoprim was characterized by Cmax and AUC0–13 h after the morning dose of trimethoprim on day 3. All of the calculations were performed with MK-Model (version 5.0; Biosoft, Cambridge, UK).
Statistical Analysis. The results are expressed as mean values ± S.D. in the text, tables, and figures, unless otherwise indicated. The pharmacokinetic variables of pioglitazone and its metabolites between trimethoprim and placebo phases were compared with repeated-measures ANOVA with the CYP2C8 genotype as a between-subjects factor. Logarithmic transformation was applied for Cmax and AUC values. The differences between genotype groups were tested with one-way ANOVA and post hoc comparisons with least significant differences. All of the data were analyzed with SPSS for Windows (version 15.0.1; SPSS Inc., Chicago, IL). Differences were considered statistically significant at p < 0.05.
In Vitro Study. Pooled human liver microsomes (new catalog number 452161, lot 20567), representing a pool from 18 individuals, and recombinant human CYP2C8 (new catalog number 456252, lot 17461) and CYP3A4 (new catalog number 456202, lot 18673) isoforms were purchased from BD Biosciences (Woburn, MA). Human liver tissue had been collected in accordance with all pertinent regulations. The procedures of organ collection had been reviewed and accepted by the respective institutional human subjects committee. Pioglitazone hydrochloride (Toronto Research Chemicals Inc., North York, ON, Canada), pioglitazone metabolites M-IV and M-III (Synfine Research, Richmond Hill, ON, Canada), and trimethoprim and β-NADPH (Sigma-Aldrich, Steinheim, Germany) were used in this study. Other chemicals were obtained from Merck (Darmstadt, Germany).
The incubations were performed in 0.1 M sodium phosphate buffer (pH 7.4), containing 5.0 mM MgCl2, 0.3 mg/ml microsomal protein, or 20 pmol/ml recombinant P450, pioglitazone with or without trimethoprim, and 1.0 mM β-NADPH (Jaakkola et al., 2006b). The incubations were commenced by the addition of β-NADPH. Pioglitazone and trimethoprim were dissolved in methanol, and the final methanol concentration was 1% in all incubations. The samples were incubated in duplicate at 37°C for 8 min, and the reactions were terminated by adding 100 μl of perchloric acid (35%) to an aliquot (0.5 ml) and cooling on ice. The mean values of the duplicates were used in calculations.
The kinetics of pioglitazone M-IV metabolite formation was determined by incubating pioglitazone (0.375–50 μM) with HLM, recombinant CYP2C8, and CYP3A4. Using nonlinear regression, a model for either Michaelis-Menten kinetics (with or without substrate inhibition) or sigmoidal (Hill) kinetics was fitted to the data. The inhibition constant (Ki) for trimethoprim was determined by incubating pioglitazone (1.25–10 μM) with either HLM or recombinant CYP2C8 and trimethoprim (0–200 μM), followed by fitting different models of enzyme inhibition to the data. The nonlinear regression analysis was carried out with the program SigmaPlot for Windows (version 9.01; Systat Software Inc., San Jose, CA).
In Vitro-in Vivo Correlations. To investigate the relationship between the in vitro inhibition of pioglitazone metabolism and the increase in the AUC of pioglitazone by trimethoprim (AUCinhibited/AUCcontrol), the following equation was fitted to the observed individual data using regression analysis:  The Cliver/Cplasma ratio is the liver (unbound, available to the enzyme)/plasma (total) concentration ratio of trimethoprim, Ki is the observed Ki of trimethoprim, and the Cavg, trimethoprim is the observed average (total) plasma concentration of trimethoprim, which was calculated as follows:
  where AUC0–13 h is the AUC of trimethoprim during the study day. The regression analysis was performed with SPSS for Windows, version 15.0.1.

Mean ± S.D. plasma concentrations of pioglitazone and its metabolites M-IV and M-III in 16 healthy volunteers after a single oral dose of 15 mg of pioglitazone on day 3 of a 6-day treatment with placebo or 160 mg of trimethoprim twice daily. ○, pioglitazone during placebo; •, pioglitazone during trimethoprim. Inset depicts the same data on a semilogarithmic scale.
Results
Effect of Trimethoprim. Trimethoprim raised the mean AUC0-∞ of unchanged pioglitazone by 42% (range -19 to 128%; p < 0.001), compared with placebo (Table 2; Fig. 1). The dominant elimination t1/2 of pioglitazone was prolonged from 3.9 to 5.1 h (p < 0.001). However, the peak concentration in plasma (Cmax), the time to Cmax (data not shown), and the terminal t1/2 (data not shown) of pioglitazone were not changed significantly by trimethoprim.
Pharmacokinetic variables of pioglitazone after a single oral dose of 15 mg of pioglitazone on day 3 of a 6-day treatment with placebo or 160 mg trimethoprim twice daily in subjects with the CYP2C8*1/*1 genotype (n = 8), CYP2C8*1/*3 genotype (n = 5), and CYP2C8*3/*3 genotype (n = 3) Values are mean ± S.D., unless otherwise indicated.
The apparent formation rate constant (kf) of the pioglitazone metabolite M-IV was 39% lower (p < 0.001) during the trimethoprim phase than during the placebo phase (Table 3). Trimethoprim also lowered the M-IV/pioglitazone AUC0–∞ ratio (p < 0.001). However, despite the reduced formation rate of the metabolite, the AUC0–∞ of M-IV was increased by 10% by trimethoprim (p < 0.05). The kf values of the secondary pioglitazone metabolite M-III (formed from M-IV) and the M-III/pioglitazone AUC0–∞ ratio (mean ± S.D.) were 0.13 ± 0.044 (range 0.07–0.21) h-1 and 0.74 ± 0.12 (range 0.60–0.98) during the trimethoprim phase and 0.17 ± 0.080 (range 0.10–0.36; p < 0.001) h-1 and 0.97 ± 0.32 (range 0.5–1.7; p = 0.006) during the placebo phase. No other significant changes were observed in the pharmacokinetic variables of M-III (data not shown).
Pharmacokinetic variables of the pioglitazone main primary metabolite M-IV after a single oral dose of 15 mg of pioglitazone on day 3 of a 6-day treatment with placebo or 160 mg of trimethoprim twice daily in subjects with the CYP2C8*1/*1 genotype (n = 8), CYP2C8*1/*3 genotype (n = 5), and CYP2C8*3/*3 genotype (n = 3)
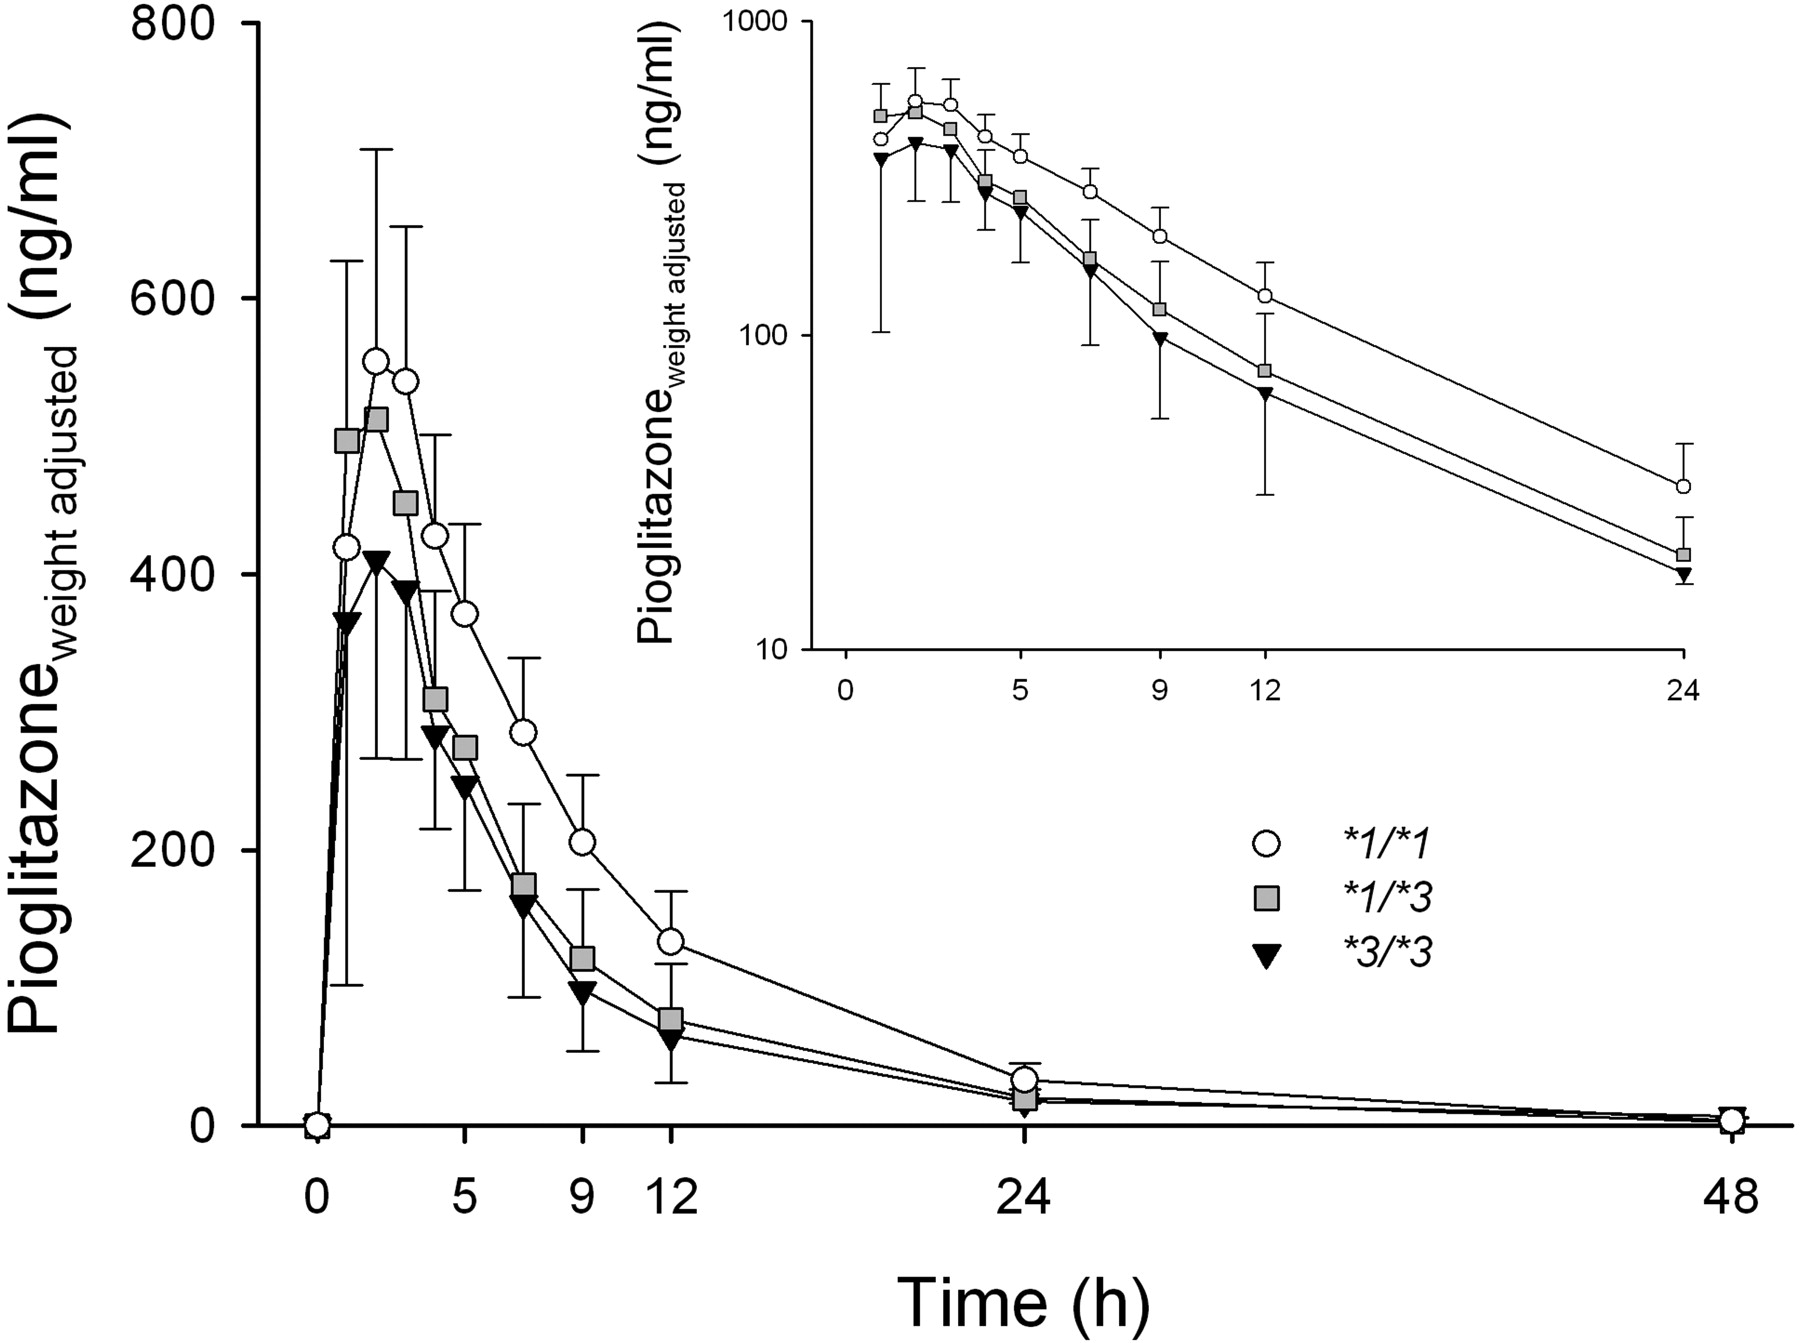
Effect of CYP2C8 Genotype. During the placebo phase, the subjects with the CYP2C8*1/*3 or *3/*3 genotype had lower mean plasma concentrations of the parent pioglitazone than did the subjects with the CYP2C8*1/*1 genotype (Fig. 2). The weight-adjusted AUC0–∞ of pioglitazone was 34% smaller in the CYP2C8*3/*3 group (3.25 ± 0.87 mg · h/l, p < 0.05), and 26% smaller in the CYP2C8*1/*3 group (3.67 ± 0.92 mg · h/l, p < 0.05) than in the CYP2C8*1/*1 group (4.95 ± 0.96 mg · h/l) (Table 2). In line with this finding, the M-IV/pioglitazone and M-III/pioglitazone AUC0–∞ ratios and apparent formation rate constants were higher in the variant groups than in the CYP2C8*1/*1 group (Table 3; Fig. 3). However, no statistically significant differences existed between the genotype groups in the AUC0–∞ values of M-IV (Table 3) or M-III (data not shown), not even after weight-adjustment (data not shown). During the trimethoprim phase, the differences in the pharmacokinetics of pioglitazone between the genotype groups were similar to those during the placebo phase or slightly smaller (Tables 2 and 3). There was no significant difference or even a tendency for differences in the extent of the trimethoprim-pioglitazone interaction between the three genotype groups (Table 2).
Metabolism of Pioglitazone in Vitro. The metabolism of pioglitazone to M-IV by pooled HLM was adequately described by a Michaelis-Menten equation with a Michaelis-Menten constant (Km) of 9.8 μM and maximum velocity (Vmax) of 640 pmol/min/mg of protein (data not shown). The formation of M-IV by recombinant CYP2C8 was best described by a model for Michaelis-Menten kinetics with substrate inhibition, whereas the formation by CYP3A4 was best described by sigmoidal (Hill) kinetics (Fig. 4A). The formation rate of the M-IV metabolite was 5 to 10 times higher by CYP2C8 than by CYP3A4 at clinically relevant pioglitazone concentrations (<2 μM). Trimethoprim concentration dependently inhibited M-IV formation in human liver microsomes and recombinant CYP2C8, and the inhibitory effect was best described by the competitive inhibition model, with mean ± S.E. Ki values of 38.2 ± 3.9 and 34.1 ± 4.0 μM, respectively (Fig. 4B).

Mean ± S.D. weight-adjusted plasma concentrations of pioglitazone in different CYP2C8 genotype groups after a single oral dose of 15 mg of pioglitazone during the placebo phase. ○, CYP2C8*1/*1 genotype (n = 8); ▒ CYP2C8*1/*3 genotype (n = 5); ▾, CYP2C8*3/*3 genotype (n = 3). Inset depicts the data on a semilogarithmic scale. For clarity, some error bars have been omitted.
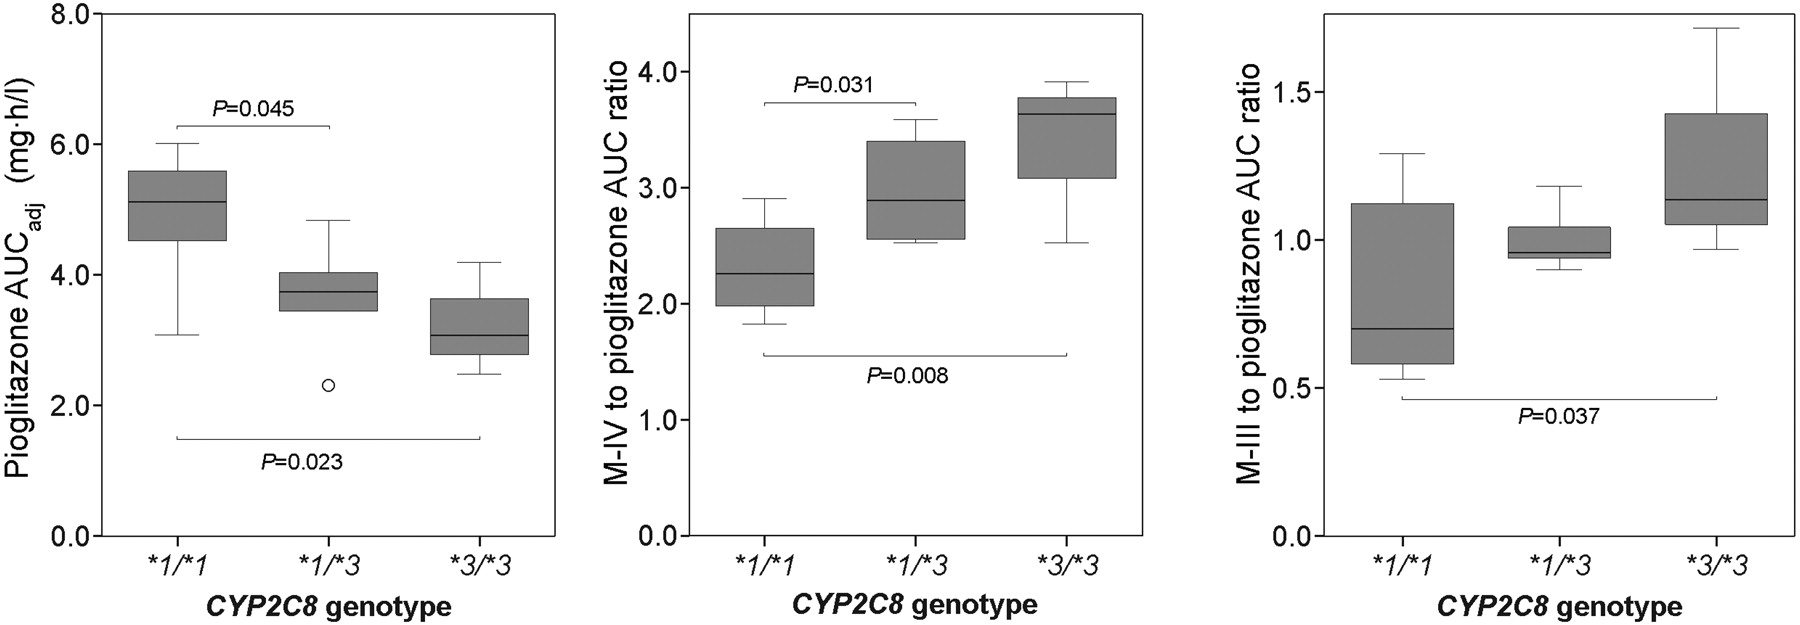
Box plot diagram showing the weight-adjusted pioglitazone AUC0–∞, the M-IV/pioglitazone AUC0–∞ ratio, and the M-III/pioglitazone AUC0–∞ ratio in subjects with the CYP2C8*1/*1 (n = 8), *1/*3 (n = 5), and *3/*3 (n = 3) genotypes during the placebo phase. Boxes represent the range between the 25th and 75th percentiles. The horizontal lines within the boxes are medians, and the whiskers represent the range except for the outliers (○).

A, formation of the main primary metabolite M-IV from pioglitazone by recombinant human CYP2C8 and CYP3A4 enzymes in vitro and the corresponding kinetic parameters (±S.E.). The fitted lines represent the Michaelis-Menten model with substrate inhibition for CYP2C8, and the sigmoidal kinetic model for CYP3A4. Km, Michaelis-Menten constant; Vmax, maximum reaction velocity; Ki, inhibition constant for substrate inhibition; n, Hill coefficient; •, CYP2C8; ○, CYP3A4. B, Michaelis-Menten plots and the Ki (±S.E.) for inhibition of M-IV formation by trimethoprim in human liver microsomes. All data points are means ± S.D. from duplicate determinations.

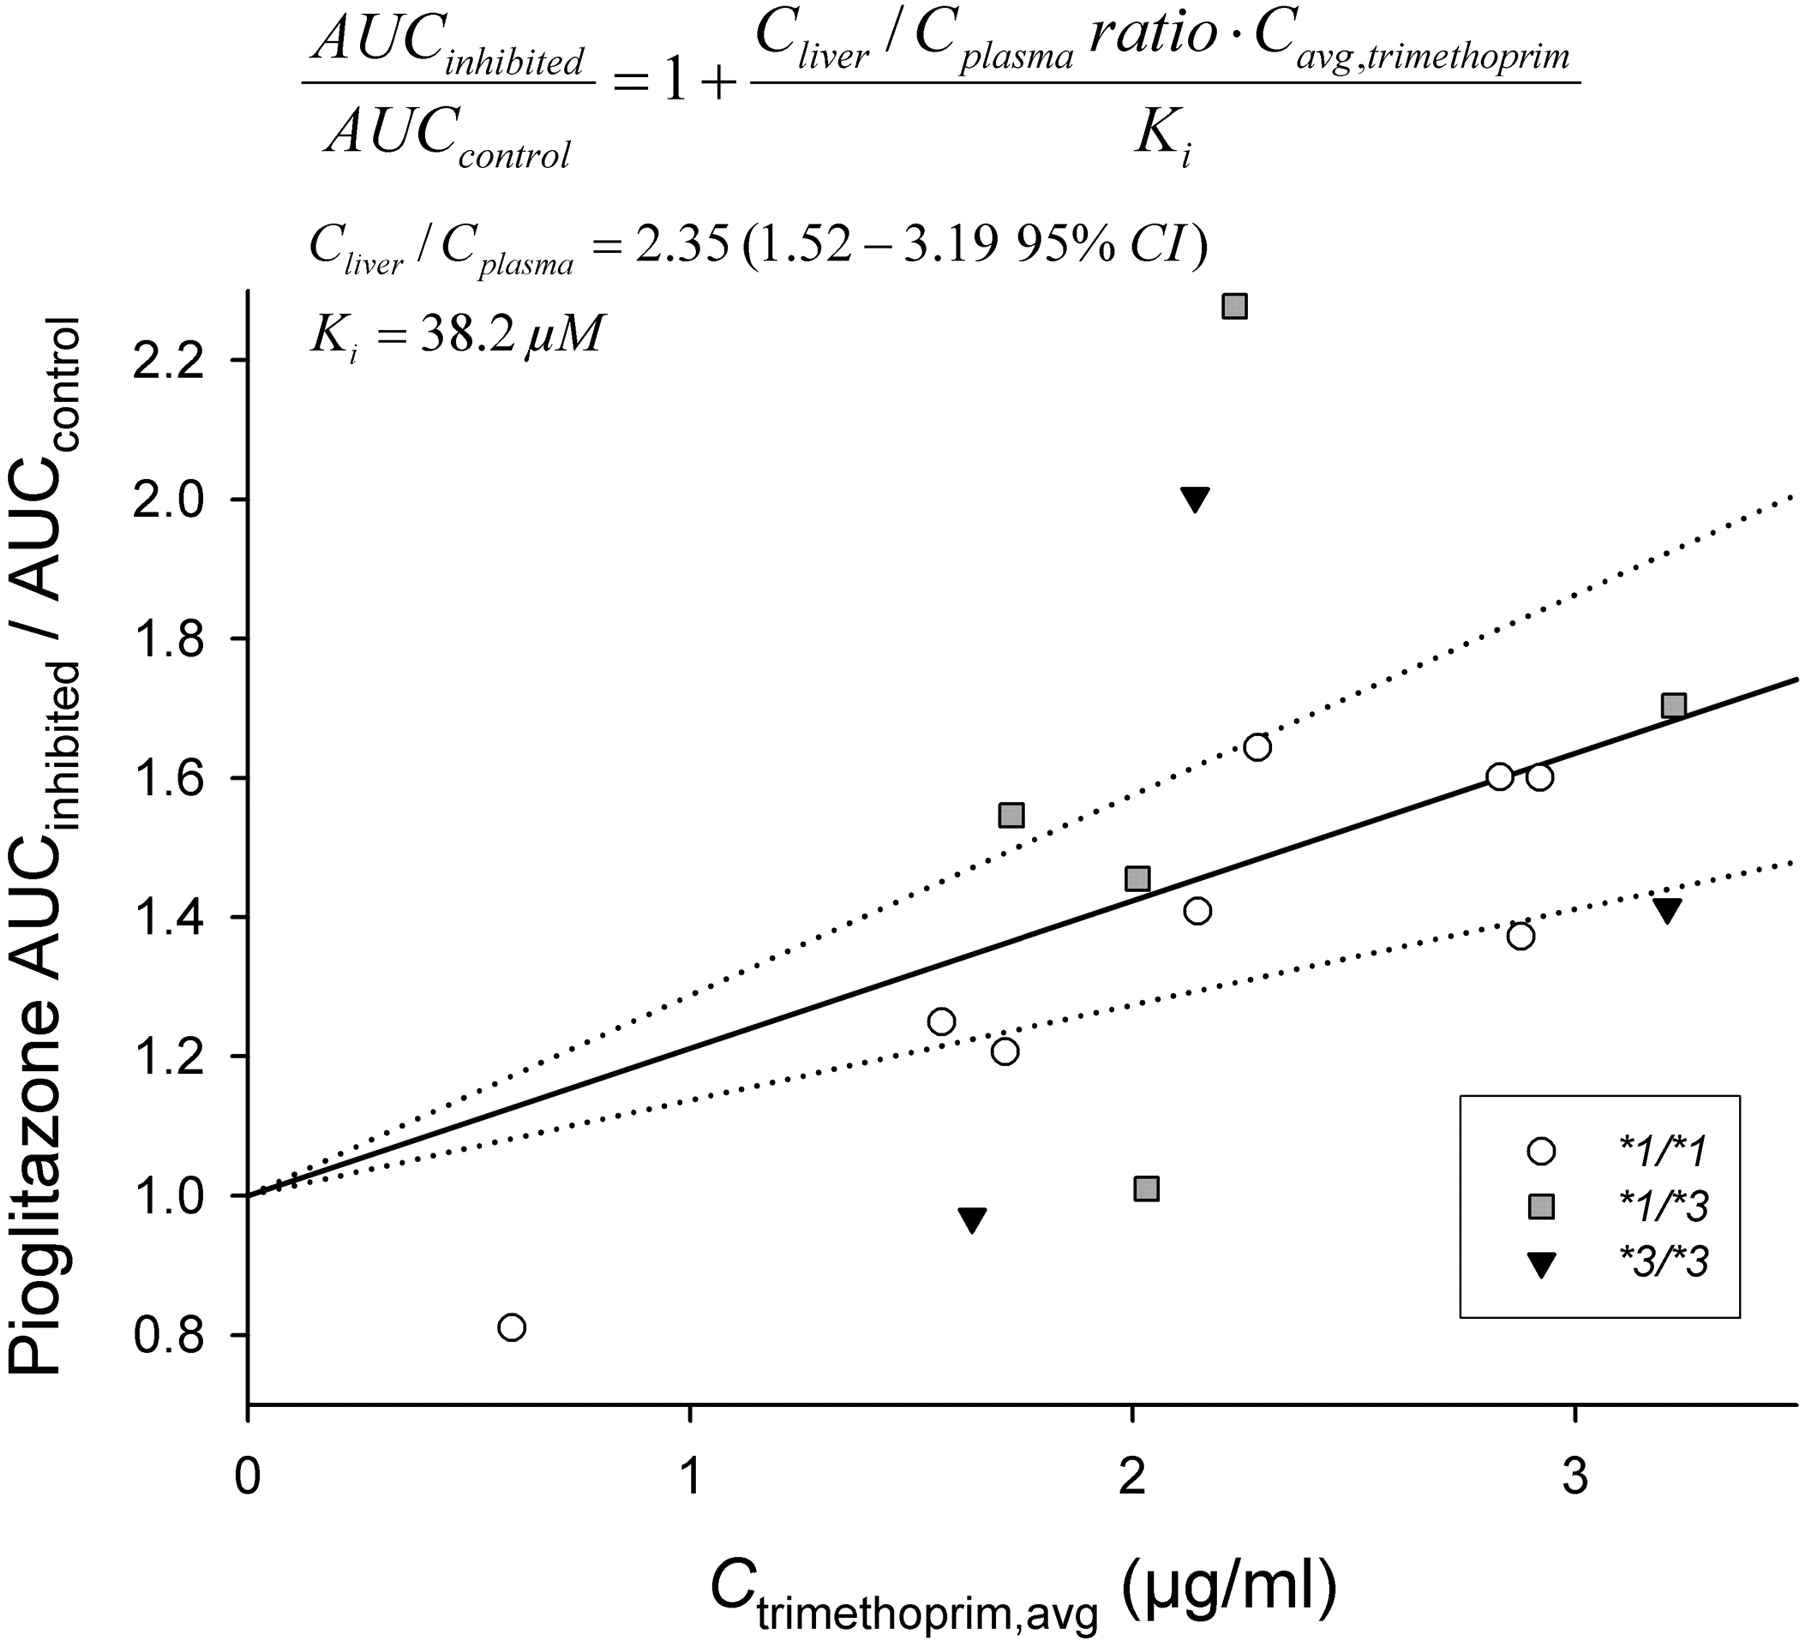
Relationship between trimethoprim average concentration and the fold change in pioglitazone AUC (AUCinhibited/AUCcontrol) in 16 healthy volunteers. ○, CYP2C8*1/*1 genotype; ▒ CYP2C8*1/*3 genotype; ▾, CYP2C8*3/*3 genotype. The fitted lines represent the Cliver/Cplasma ratio of trimethoprim (2.35 ± 0.39) and its 95% confidence interval (dotted lines) derived by fitting the equation depicted in the figure to the data. Ctrimethoprim, avg, trimethoprim average concentration derived from trimethoprim AUC0–13 h.
Pharmacokinetics of Trimethoprim and in Vitro-in Vivo Correlations. The AUC0–13 h and Cmax of trimethoprim on the day of pioglitazone administration were 28.6 ± 9.0 (range 7.8–42) mg · h/l and 3.1 ± 0.94 (range 1.2–4.7) μg/ml, respectively. One of the male subjects in the CYP2C8*1/*1 group had exceptionally low trimethoprim concentrations (Table 1). The AUC0–13 h of trimethoprim correlated significantly with the change in pioglitazone AUC0–∞ between the phases (pioglitazone AUCinhibited - pioglitazone AUCcontrol) (Pearson r2 = 0.577, p < 0.001).
The extent of the trimethoprim-pioglitazone interaction (pioglitazone AUCinhibited/pioglitazone AUCcontrol) could be predicted reasonably accurately in two-thirds of the subjects on the basis of the in vitro Ki of trimethoprim and its average plasma concentration using a competitive inhibition model with a Cliver/Cplasma ratio of 2.35 for trimethoprim (Fig. 5). The equation obtained using regression analysis explained 24% of the variability in the extent of interaction with a mean prediction error of -6 ± 22%. For 11 of the 16 subjects, the predictions were within ±20% of the observed extent of interaction. Of the five subjects outside the ±20% range, two had the CYP2C8*3/*3 genotype, and two had the CYP2C8*1/*3 genotype.
Discussion
In the current study, trimethoprim moderately and concentration dependently increased the AUC0–∞ of pioglitazone and lowered the ratio of the main primary metabolite M-IV to pioglitazone in plasma, indicating that trimethoprim inhibited the CYP2C8-mediated metabolism of pioglitazone. Trimethoprim also prolonged the dominant elimination t1/2 of pioglitazone. However, the terminal t1/2, which seems to reflect a release of pioglitazone from peripheral tissues and is insensitive also to the effect of induction (Jaakkola et al., 2006a), was unaffected by trimethoprim. Compared with individuals with the CYP2C8*1/*1 genotype, those homozygous or heterozygous for the CYP2C8*3 variant allele had lower plasma concentrations of pioglitazone and a higher rate of metabolite formation. Both the weight-adjusted AUC0–∞ and the M-IV/pioglitazone and M-III/pioglitazone AUC0–∞ ratios showed a gene-dose effect, with the heterozygous CYP2C8*3 allele carriers in between the homozygous carriers and the noncarrier group. The extent of the trimethoprim-pioglitazone interaction, which was independent of the CYP2C8 genotype, could be predicted using the Ki value of trimethoprim for CYP2C8 and plasma trimethoprim concentrations.
The adverse effects of the thiazolidinediones pioglitazone and rosiglitazone include fluid retention and peripheral edema and seem to be dose (concentration)-dependent (Hanefeld and Belcher, 2001; Kermani and Garg, 2003). Rosiglitazone has also been suspected of increasing the risk of cardiovascular death (Nissen and Wolski, 2007). Although the interaction of trimethoprim with pioglitazone was moderate, the increase in the AUC of pioglitazone was more than 2-fold in some subjects, and also the AUC of the active metabolite M-IV was increased by trimethoprim. Accordingly, it is possible that concomitant administration of trimethoprim or other inhibitors of CYP2C8 with pioglitazone could lead to an increased risk of concentration-dependent adverse effects. The pharmacokinetic profile of pioglitazone in patients with type 2 diabetes is similar to that in healthy volunteers (Eckland and Danhof, 2000). Thus, it is likely that the interaction observed in the present study is also similar in patients with type II diabetes. The opposite effect of the CYP2C8*3 allele is of the same magnitude as the trimethoprim-pioglitazone interaction. Most probably, the genotype effect is maintained also during long-term treatment with pioglitazone, as is the case with rosiglitazone, on which the CYP2C8*3 allele was recently found by Kirchheiner et al. (2006) to have a similar effect. The efficacy of pioglitazone could be reduced and the dose requirement be increased in the CYP2C8*3 variant allele carriers, but these effects were not investigated in the current study. Furthermore, it is reasonable to assume that the risk of concentration-dependent adverse effects of pioglitazone (and rosiglitazone) could be dependent on the CYP2C8 genotype, but further studies are needed to test this hypothesis.
There has been a lot of controversy concerning the effect of the CYP2C8*3 allele on the disposition of different drugs, and no studies concerning its effect on the pharmacokinetics of pioglitazone have been published previously. In in vitro studies, the activity of CYP2C8.3 to metabolize paclitaxel, arachidonic acid and amodiaquine has been reduced (Dai et al., 2001; Bahadur et al., 2002; Parikh et al., 2007). Surprisingly, in the first human studies, carriers of the CYP2C8*3 allele were found to have lower plasma concentrations of repaglinide than the control group homozygous for the CYP2C8*1 allele (Niemi et al., 2003c, 2005). Also with rosiglitazone, subjects homozygous for CYP2C8*3 have had an increased clearance compared with subjects homozygous for the CYP2C8*1 allele (Kirchheiner et al., 2006). On the other hand, some studies have found no significant effects of the CYP2C8*3 genotypes on the pharmacokinetics of repaglinide, rosiglitazone, or paclitaxel (Henningsson et al., 2005; Bidstrup et al., 2006; Pedersen et al., 2006). Moreover, the CYP2C8*3 allele has been associated with reduced clearance and prolonged t1/2 of both enantiomers of ibuprofen (García-Martín et al., 2004). Because of strong linkage disequilibrium, the CYP2C9*2 allele exists commonly in the same haplotype with the CYP2C8*3 allele (Yasar et al., 2002), which could affect these findings, as ibuprofen is metabolized by both of these P450 enzymes (Hamman et al., 1997). Thus, the result of the current study, that pioglitazone concentrations are lower in carriers of CYP2C8*3 allele than in noncarriers, and the previous in vivo results with repaglinide and rosiglitazone (Niemi et al., 2003c, 2005; Kirchheiner et al., 2006) suggest that the CYP2C8*3 allele is often associated with an increased CYP2C8 activity phenotype. The extent of the interaction between trimethoprim and pioglitazone, however, did not appear to depend on the CYP2C8 genotype.
The earlier information on the contribution of different P450 enzymes to the metabolism of pioglitazone has been inconsistent. Thus, the European product information for Actos stated that the metabolism of pioglitazone occurs predominantly via CYP3A4 and CYP2C9 (Lääketietokeskus, 2007), whereas the U.S. label stated that the major P450 isoforms are CYP2C8 and CYP3A4 (Food and Drug Administration, Actos prescribing information, http://www.fda.gov/cder/foi/label/1999/21073lbl.pdf). According to our recent in vitro study, pioglitazone (at 1 μM concentration) is metabolized mainly (60–90%) by CYP2C8 and to a lesser extent (10–40%) by CYP3A4, whereas other P450 forms play a negligible role (Jaakkola et al., 2006b). However, previous findings that itraconazole has no effect on the pharmacokinetics of pioglitazone in humans (Jaakkola et al., 2005) suggest that CYP3A4 also has a negligible role in the metabolism of pioglitazone in vivo. The present in vitro results can provide an explanation for these apparent discrepancies between the in vitro and in vivo findings, as the role of CYP3A4 in the metabolism of pioglitazone became very small (<10% of the activity of CYP2C8) (Fig. 4A) at clinically relevant pioglitazone concentrations of <2 μM (<720 ng/ml) (Eckland and Danhof, 2000), because of the sigmoidal kinetics of M-IV formation by CYP3A4. Sigmoidal kinetics is a common feature of CYP3A4-mediated reactions and a possible cause of overestimation of the role of the P450 form, if too high substrate concentrations are used in vitro. It should be noted that the free fraction of pioglitazone in plasma is less than 3%, and therefore its unbound concentrations at the enzyme site (in the liver) are probably much smaller than its total plasma concentrations. This example emphasizes the need for using relevant concentrations when in vitro to in vivo correlations are made.
Repaglinide and rosiglitazone have been recommended to be used as in vivo probes for CYP2C8-mediated metabolism (Huang et al., 2007). Repaglinide is a sensitive probe drug, but unlike pioglitazone and rosiglitazone it easily causes hypoglycemia (Niemi et al., 2003b). Moreover, repaglinide is also a substrate of organic anion-transporting polypeptide 1B1, and its pharmacokinetics are affected by the SLCO1B1 genotype (Niemi et al., 2005), unlike those of pioglitazone (Kalliokoski et al., 2007). Gemfibrozil has raised the AUC of rosiglitazone and pioglitazone by 2.3- and 3.2-fold, respectively (Niemi et al., 2003a; Jaakkola et al., 2005). In the present study, trimethoprim increased the AUC of pioglitazone slightly more (by 42%) than it has raised the AUC of rosiglitazone (by 37%), suggesting that the role of CYP2C8 is slightly greater in the metabolism of pioglitazone than in the metabolism of rosiglitazone. In addition, pioglitazone does not inhibit CYP2C8 in vivo (Kajosaari et al., 2006). Taken together, pioglitazone could serve as a more sensitive in vivo probe for CYP2C8 than rosiglitazone, while having a better single dose safety profile than repaglinide.
In human liver microsomes, trimethoprim inhibited the formation of M-IV from pioglitazone with a Ki of 38 μM, which is comparable to the Ki value (32 μM) of trimethoprim for the CYP2C8 model reaction, paclitaxel 6α-hydroxylation (Wen et al., 2002). If these data were directly extrapolated from in vitro to in vivo, assuming similar trimethoprim concentrations in plasma and at the enzyme site in the liver, the actual interaction between trimethoprim and pioglitazone would be somewhat underestimated. The liver/plasma ratio of trimethoprim in rhesus monkeys has been approximately 6.5 (Craig and Kunin, 1973), suggesting that trimethoprim may be concentrated into the liver in humans also. In fact, incorporating the observed Ki, average total plasma trimethoprim concentration, and degree of interaction into a predictive model, the liver/plasma concentration ratio of trimethoprim was estimated to average 2.4 in the current study. Including the assumption that only 80% of pioglitazone is metabolized by CYP2C8, the Cliver/Cplasma ratio of trimethoprim was calculated to be 3.4 (data not shown). Thus, the (unbound) trimethoprim concentration available to CYP2C8 in the liver seems to be several-fold higher than the total plasma trimethoprim concentration. Furthermore, it should be noted that the unbound fraction of trimethoprim in plasma is approximately 55%.
To conclude, trimethoprim moderately increases the plasma concentrations of pioglitazone by inhibiting its CYP2C8-catalyzed biotransformation. The CYP2C8*3 allele is associated with reduced pioglitazone plasma concentrations and increased activity of its CYP2C8-mediated metabolism. Thus, both drug interactions and genetic factors can change the pharmacokinetics of pioglitazone, potentially affecting its efficacy and safety.
Footnotes
-
This study was supported by grants from the Helsinki University Central Hospital Research Fund and the Sigrid Jusélius Foundation, Finland.
-
Article, publication date, and citation information can be found at http://dmd.aspetjournals.org.
-
doi:10.1124/dmd.107.018010.
-
ABBREVIATIONS: P450, cytochrome P450; AUC, area under concentration-time curve; ANOVA, analysis of variance; HLM, human liver microsomes.
- Received August 1, 2007.
- Accepted October 2, 2007.
- The American Society for Pharmacology and Experimental Therapeutics


