


Abstract
The chemical reactivity of acyl glucuronide (AG) has been thought to be associated with the toxic properties of drugs containing carboxylic acid moieties, but there has been no direct evidence that AG formation was related to the toxicity. In the present study, the cytotoxicity and genotoxicity of AGs were investigated. Human embryonic kidney (HEK) 293 cells stably expressing UDP-glucuronosyltransferase (UGT) 1A3 (HEK/UGT1A3) were constructed to assess the cytotoxicity of AGs, and HEK/UGT1A4 cells were also used as a negative reference. After exposure to nonsteroidal anti-inflammatory drugs (NSAIDs) such as naproxen (1 mM), diclofenac (0.1 mM), ketoprofen (1 mM), or ibuprofen (1 mM) for 24 h, HEK/UGT1A3 cells produced AG in a time-dependent manner. However, HEK/UGT1A4 cells hardly produced AG. The cytotoxicity of HEK/UGT1A3 cells was not increased compared with that of HEK/UGT1A4 cells. In addition, the AG formed in NSAID-treated human hepatocytes was decreased from one-third to one-ninth by treatment with (−)-borneol, an inhibitor of acyl glucuronidation, but the cytotoxicity was increased. These results indicated that AG formation reflected the detoxification process in human hepatocytes. Furthermore, the possibility of genotoxicity from the AG formed in NSAID-treated HEK/UGT cells was investigated by the comet assay, and DNA damage was not detected in any HEK/UGT cell lines. In conclusion, the in vitro cytotoxic and genotoxic effects of the AGs of NSAIDs were investigated and AG was not found to be a causal factor in the toxicity.
Introduction
Some of the most commonly prescribed medications and over-the-counter drugs are carboxylate compounds, including many nonsteroidal anti-inflammatory drugs (NSAIDs) and fibrate lipid-lowering drugs. Approximately 25% of drugs withdrawn from the market around the world because of severe toxicity have been carboxylic acids, such as the NSAIDs ibufenac, zomepirac, bromfenac, suprofen, and benoxaprofen. Among drugs containing carboxylic acid, NSAIDs are associated with some degree of hepatotoxicity, immune cytopenias, and hypersensitivity reactions (Bailey and Dickinson, 2003). However, the essential cause of the toxicity is uncertain because of the structural diversity of NSAIDs. For example, diclofenac is associated with hepatotoxicity with a low incidence of 6 to 18 cases/100,000 person-years (Walker, 1997). Both immunological and nonimmunological mechanisms have been proposed to be responsible for the diclofenac hepatotoxicity (Banks et al., 1995; Wade et al., 1997).
Glucuronidation is one of the most important phase II metabolic pathways for endogenous and exogenous substrates in humans. Because glucuronides usually possess less intrinsic biological or chemical activity than their parent aglycones and are rapidly excreted, glucuronidation is considered to be a detoxification reaction (Shipkova et al., 2003). However, acyl glucuronide (AG), which is characterized by its electrophilic reactivity, has been implicated in a wide range of adverse drug effects including drug hypersensitivity reactions and cellular toxicity (Ritter, 2000). It is well known that AG is unstable in physiological conditions and consequently undergoes hydrolysis or intramolecular rearrangement, which occurs by migration of the drug moiety from the 1-O-β position to 2-, 3-, and 4-positions on the glucuronic acid ring (Bailey and Dickinson, 2003; Shipkova et al., 2003). As a result, AG potentially binds to cellular macromolecules covalently and has been suspected to mediate idiosyncratic drug toxicities associated with carboxylic drugs (Boelsterli et al., 1995). Until now, both direct toxic effects and immune-mediated toxicity have been suggested as possible mechanisms of idiosyncratic liver injury. With direct toxicity, covalent protein binding via AG may disrupt the normal physiological function of a “critical” protein or some critical regulatory pathway, leading to cellular necrosis (Pirmohamed et al., 1996). In addition, it has been reported that electrophilic AG can covalently interact with nucleic acids. For example, clofibrate AG and gemfibrozil AG can form DNA adducts, resulting in genotoxicity that can be measured by the single-cell gel electrophoresis (comet) assay (Sallustio et al., 1997). Furthermore, probenecid and clofibric acid induced DNA damage in isolated hepatocytes and UDP-glucuronosyltransferase (UGT)-transfected HEK293 cells via a glucuronidation-dependent pathway (Sallustio et al., 2006; Southwood et al., 2007). The significance of these finding is not yet clear.
Among UGT isoforms, the glucuronidation of carboxylic acid drugs is mediated by UGT1A3, UGT1A9, or UGT2B7 (Sakaguchi et al., 2004). Of interest, despite high sequence identity (amino acid homology of 93%), human UGT1A3 and UGT1A4 differ in terms of substrate selectivity, i.e., UGT1A3 catalyzes the acyl glucuronidation but UGT1A4 hardly does (Kubota et al., 2007). HEK293 cells can express human recombinant UGTs for cytotoxicity studies and effectively glycosylate them (Nakajima et al., 2010; Nishiyama et al., 2010). Therefore, HEK293 cells stably expressing UGT1A3 (HEK/UGT1A3) and UGT1A4 (HEK/UGT1A4) could be useful for toxicity assessment.
Among the drugs containing the carboxylic acid moieties, naproxen, diclofenac, ketoprofen, and ibuprofen were selected. Naproxen, diclofenac, and ibuprofen infrequently show severe drug-induced liver injury, but ketoprofen almost never does (Cuthbert, 1974; Banks et al., 1995; Boelsterli et al., 1995; Walker, 1997; Riley and Smith, 1998). In addition, these NSAIDs are mainly metabolized to the corresponding AG (Foster et al., 1988; Vree et al., 1993; Castillo and Smith, 1995; Kumar et al., 2002). Direct mechanistic evidence linking the toxicity to the formation of drug-protein adducts is lacking. We focused on toxicity due to cell dysfunction by acyl glucuronide formation. In this study, to clarify whether formation of AG occurred in the cells, rather than exposure to hydrophilic AG from outside the cells, which shows toxicity due to cell dysfunction by the adduct formation in vitro, we investigated the cytotoxicity of the NSAIDs exposed to HEK/UGT1A3 or HEK/UGT1A4 and human hepatocytes. Furthermore, we investigated the genotoxicity of the NSAIDs by using the comet assay.
Materials and Methods
Materials.
Ketoprofen, ibuprofen, G418, and dimethyl sulfoxide (DMSO) were purchased from Wako Pure Chemicals (Osaka, Japan). Naproxen acyl-β-d-glucuronide, diclofenac acyl-β-d-glucuronide, ketoprofen acyl-β-d-glucuronide, and ibuprofen acyl-β-d-glucuronide were purchased from Toronto Research Chemicals Inc. (North York, ON, Canada). Naproxen, diclofenac sodium salt, UDP-glucuronic acid (UDPGA), alamethicin, 4-methylumbelliferone (4-MU), 4-MU O-glucuronide, and (−)-borneol were purchased from Sigma-Aldrich (St. Louis, MO). Rabbit anti-human UGT1A antibodies were obtained from BD Gentest (Woburn, MA). Rabbit anti-human GAPDH antibodies were purchased from Imgenex (San Diego, CA). IRDye 680-labeled goat anti-rabbit secondary antibody and Odyssey Blocking buffer were obtained from LI-COR Biosciences (Lincoln, NE). Primers were commercially synthesized at Hokkaido System Sciences (Sapporo, Japan). Lipofectamine 2000 was purchased from Invitrogen (Carlsbad, CA). All other chemicals and solvents were of the highest grade or the analytical grade commercially available.
Isolation of Human UGT1A3 and Construction of Expression Vectors.
Human UGT1A3 (accession number NM_019093) cDNAs were prepared by a reverse transcription-polymerase chain reaction technique using total RNA from human liver. The primer sequences used in this study were as follows: human UGT1A3ex1 sense primer, 5′-TCTTCTGCTGAGATGGCCAC-3′ and human UGT1Aex5 antisense primer, 5′-GCACTCTGGGGCTGATTAAT-3′. After an initial denaturation at 94°C for 5 min, amplification was performed by denaturation at 94°C for 30 s, annealing at 55°C for 30 s, and extension at 72°C for 90 s for 45 cycles, followed by a final extension at 72°C for 5 min. The polymerase chain reaction products were subcloned into pTARGET Mammalian Expression Vector (Promega, Madison, WI), and the DNA sequences of the inserts were determined using a Thermo Sequenase Cy5.5 Dye Terminator Cycle Sequencing Kit (GE Healthcare, Little Chalfont, Buckinghamshire, UK) with a Long-Read Tower DNA sequencer (GE Healthcare).
Stable Expression of UGT1A3 and UGT1A4 Isoforms in HEK293 Cells.
An expression vector for UGT1A3 was constructed. HEK293 cells (American Type Culture Collection, Manassas, VA) were grown in Dulbecco's modified Eagle's medium containing 4.5 g/l glucose, 10 mM HEPES, and 10% fetal bovine serum with 5% CO2 at 37°C. The cells in 12-well plates were transfected with 1.6 μg of the UGT1A3 expression vector using Lipofectamine 2000. Stable transfectants of UGT1A3 were selected in medium containing 800 mg/l G418. HEK293 cells stably expressing UGT1A4 were previously established in our laboratory (Fujiwara et al., 2007a). The cell lines were incubated with 95% O2/5% CO2 at 37°C and split 1:4 every 3 days.
SDS-PAGE and Immunoblotting.
Samples were boiled for 3 min in Laemmli sample buffer containing 2-mercaptoethanol and separated on 10% SDS-polyacrylamide gel. The separated proteins were electrotransferred onto a polyvinylidene difluoride membrane (Immobilon-P; Millipore Corporation, Billerica, MA). The membrane was washed with phosphate-buffered saline (PBS) two times and blocked with Odyssey Blocking buffer for 1 h. The membranes were incubated with rabbit anti-human UGT1A polyclonal antibody (1:500) and rabbit anti-human GAPDH antibodies (1:1000) diluted with Odyssey Blocking buffer containing 0.1% Tween 20 for 1 h. The membrane was washed with PBS-T (PBS containing 0.1% Tween 20) four times and incubated with IRDye 680-labeled goat anti-rabbit IgG secondary antibody diluted (1:5000) with PBS-T for 1 h. The densities of the bands were determined using an Odyssey Infrared Imaging System (LI-COR Biosciences).
HPLC Analysis of 4-MU O-Glucuronide Formation on UGT1A3.
4-MU O-glucuronosyltransferase activity was determined as described previously with slight modifications (Fujiwara et al., 2007a). In brief, a typical incubation mixture (100 μl of total volume) contained 50 mM Tris-HCl buffer (pH 7.4), 10 mM MgCl2, 2.5 mM UDPGA, 25 μg/ml alamethicin, 0.4 mg/ml cell homogenate of UGT1A3, and 1 to 1000 μM 4-MU. The reaction was initiated by the addition of UDPGA after a 3-min preincubation at 37°C. After incubation at 37°C for 30 min, the reaction was terminated by the addition of 100 μl of ice-cold methanol. After removal of the protein by centrifugation at 13,000g for 5 min, a 50-μl portion of the sample was subjected to HPLC. The analytical column was a CAPCEL PAK C18 UG120 (4.6 × 150 mm, 5 μm; Shiseido, Tokyo, Japan), and the mobile phase was 30% methanol-20 mM potassium phosphate buffer (pH 4.5). The eluent was monitored at 320 nm. The quantification of 4-MU O-glucuronide was performed by comparing the HPLC peak height with that of the authentic standard. Kinetic parameters were estimated from the fitted curve using a computer program (KaleidaGraph; Synergy Software, Reading, PA) designed for nonlinear regression analysis. The following equation was applied for Michaelis-Menten kinetics:
 where V is the velocity of the reaction, S is the substrate concentration, Km is the Michaelis-Menten constant, and Vmax is the maximum velocity. Data are expressed as means ± S.D. of triplicate determinations.
In Vitro Studies with HEK/UGT Cells.
Cytotoxicity assay.
HEK/UGT cells were seeded into 96-well microtiter plates layered with 2 × 10⁴ cells/well in 0.1 ml of 0.5% (v/v) FBS supplemented DMEM and were immediately incubated with naproxen (1 mM), diclofenac (0.1 mM), ketoprofen (1 mM), or ibuprofen (1 mM) for 6, 12, or 24 h.
Quantification of the AG metabolites.
HEK/UGT cells were seeded into 24-well plates layered with 2 × 10⁵ cells/well in 1 ml of 0.5% (v/v) FBS-supplemented DMEM and were immediately incubated with the NSAIDs for 6, 12, or 24 h. The cultured cells were collected into a clean tube after the specified period and then centrifuged at 3000g for 5 min to separate the cultured medium and cell fraction. The cell fraction was suspended with 100 μl of PBS. We confirmed the stability of each AG in the autosampler at 4°C for 24 h (data not shown). The final concentrations of DMSO in the culture medium did not exceed 0.1%.
In Vitro Studies with Human Hepatocytes.
Cytotoxicity assay.
LiverPool cryopreserved human hepatocytes in suspension (Celsis In Vitro Technologies, Brussels, Belgium) were seeded into collagen-coated 96-well microtiter plates layered with 2 × 10⁴ cells/well in 0.1 ml of 0.5% (v/v) FBS-supplemented HCM culture medium (epidermal growth factor- and antibiotic-free) containing 10 nM estradiol and were immediately preincubated with (−)-borneol (1 mM), an inhibitor of acyl glucuronidation. After 30 min, the cells were incubated with the NSAIDs for 6 h.
Quantification of the NSAIDs and their AG metabolites.
Human hepatocytes were seeded into collagen-coated 24-well plates layered with 2 × 10⁵ cells/well in 1 ml of 0.5% (v/v) FBS-supplemented HCM culture medium and were immediately preincubated with (−)-borneol (1 mM). After 30 min, the cells were incubated with 0.5% (v/v) FBS-supplemented HCM culture medium containing the NSAIDs for 6 h. We confirmed the stability of each AG at 4°C for 24 h (data not shown). The final concentrations of DMSO in the culture medium did not exceed 0.2%.
LC-MS/MS Analysis and Preparation of AG Samples.
The NSAIDs and their AGs were quantified using PE SCIEX API 2000 LC-MS/MS systems (MDS Sciex, Concord, ON, Canada) equipped with an electrospray ionization interface used to generate negative ions [M − H]−. The test drugs were separated on a ZORBAX SB-C18 column (50 × 2.1 mm, 3.5 μm; Agilent Technologies, Santa Clara, CA). The gradient mobile phase consisted of 0.1% formic acid in purified water and 0.1% formic acid in methanol (80:20 to 10:90, v/v). The mobile phase was eluted at 0.2 ml/min using an Agilent 1100 series pump (Agilent Technologies). The NSAIDs and their AGs were monitored by multiple reaction monitoring using transitions of 229 → 169 (naproxen), 405 → 193 (naproxen AG), 294 → 250 (diclofenac), 470 → 193 (diclofenac AG), 253 → 209 (ketoprofen), 429 → 193 (ketoprofen AG), 205 → 161 (ibuprofen), and 381 → 193 (ibuprofen AG). These drugs were calculated by comparing the peak area to that of the authentic standard. The analytical data were processed using Analyst software (version 1.4.1; Applied Biosystems, Foster City, CA) in the API2000 LC-MS/MS systems.
Fifty microliters of methanol-acetic acid (100:1, v/v) was added to a 50-μl portion of the cell fraction or the cultured medium, and then the mixture was centrifuged at 17,400g for 10 min. The supernatant was transferred to a glass vial kept at 4°C in an autosampler, and 20 μl of this solution was injected.
Cytotoxicity Assays.
An MTT assay was performed with a Cell Counting Kit-8 (Dojindo Laboratories, Kumamoto, Japan) using water-soluble [2-(2-methoxy-4-nitrophenyl)-3-(4-nitrophenyl)-5-(2, 4-disulfophenyl)-2H-tetrazolium monosodium salt] (WST-8). WST-8 produces a water-soluble formazan dye upon reduction in the presence of an electron carrier coupling with mitochondrial dehydrogenases. HEK/UGT cells or human hepatocytes (each 2 × 10⁴ cell/well) were seeded in 96-well plates. After 6, 12, and 24 h of incubation for HEK/UGT cells (or after 6 h of incubation for human hepatocytes), CCK-8 reagent was added, and the absorbance of WST-8 formazan at 450 nm was measured according to the manufacturer's instructions. The percent cell viability was calculated by comparing absorbance of cells with that of the control cells.
Cell viabilities of the HEK/UGT cells and human hepatocytes were also evaluated by the intracellular ATP concentration using a CellTiter-Glo Luminescent Cell Viability Assay (Promega). The luminescence of the oxyluciferin generated was measured in the ATP assay by using an 1420 ARVO MX luminometer (excitation 338 nm and emission 458 nm) (PerkinElmer Life and Analytical Sciences–Wallac Oy, Turku, Finland) according to the manufacturer's instructions. The percent cell viability was calculated by comparing cell luminescence with that of the control cells.
Lactate dehydrogenase (LDH) leakage from HEK/UGT cells was evaluated by a Cytotoxicity Detection Kit–LDH (Roche Diagnostics GmbH, Mannheim, Germany). LDH release was measured photometrically at 490 nm (690 nm reference) according to the manufacturer's instructions. The maximum LDH release control was prepared as well as the timing of the addition of lysis solution (1% Triton X-100) to obtain 100% LDH release. The percentage of LDH release was calculated by comparing the absorbance to the maximum LDH release of the control cells.
Comet Assay.
The alkaline version of the comet assay is a sensitive genotoxicity test for the detection of DNA strand breaks. The comet assay is based on the principle that DNA fragments formed via DNA damage can be detected after agarose gel electrophoresis and fluorescent staining (Singh et al., 1988). Moreover, the use of different pH conditions during the cell lysis step allows the detection of different types of DNA damage, including single- and double-strand breaks and alkali-labile sites (Kohn, 1991). The comet assay was performed as follows. In brief, HEK/UGT cells were seeded in 24-well plates 24 h before treatment. Cells were treated for 24 h with 0.5% (v/v) FBS-supplemented DMEM containing either vehicle (0.1% DMSO), 1 mM naproxen, 0.1 mM diclofenac, 1 mM ketoprofen or 1 mM ibuprofen. Microscope slides were prepared by immersion in 0.5% (w/v) normal melting agarose. One volume of cell suspension (100 μl, containing approximately 4 × 10⁵ cells) was mixed with 9 volumes of 0.7% (w/v) low-melting point agarose maintained at 37°C in a water bath, after which 100 μl of the diluted suspension was layered on a precoated slide. The slide was immediately covered with a coverslip and incubated at 4°C to solidify the agarose. After the slides were coated with a third layer of 0.7% (w/v) low-melting point agarose at 4°C for 20 min, the embedded cells were immersed for 1 h at 4°C in cold lysis buffer [2.5 M NaCl, 1% (w/v) sodium N-lauroylsarcosinate, 100 mM disodium EDTA, and 10 mM Tris base, pH 10] supplemented with 1% (v/v) Triton X-100 and 10% (v/v) DMSO. The slides were placed in a horizontal electrophoresis assembly containing fresh electrophoresis buffer (100 mM NaOH and 10 mM disodium EDTA). To allow DNA unfolding and unwinding, we left the slides in the buffer for 30 min before electrophoresis. After electrophoretic resolution (300 mA for 20 min) using a recirculating horizontal tank (BE-560; Biocraft, Tokyo, Japan), the slides were washed in neutralizing buffer (0.4 M Tris-HCl, pH 7.5) twice for 5 min each and then were stained with ethidium bromide and examined in a fluorescent microscope (BZ-9000; Keyence Corporation, Osaka, Japan). The resulting photographs of fluorescently labeled comets were scored on the basis of the tail extent moment using CometAnalyzer 1.5 (Youworks Corporation, Tokyo, Japan).
The comet moment was typically determined for 150 to 180 cells per treatment on more than three separate experimental days. Data are presented as medians ± interquartile range.
Statistical Analyses.
Data are expressed as the mean ± S.D. of three independent determinations. Statistical significance of the cytotoxicity data were determined by a two-tailed Student's t test, and comet data were analyzed using a two-tailed nonparametric Mann-Whitney's U test (GraphPad Software Inc., San Diego, CA). P < 0.05 was considered statistically significant.
Results
UGT1A3 and UGT1A4 in HEK293 Cells: Expression Levels and Enzyme Activities.
To establish the stable cell line expressing UGT1A3, five clones were isolated. Immunoblot analysis revealed that the expression levels of UGT varied among the clones and the clones with the highest UGT1A protein levels were selected (data not shown). The HEK293 expression systems of UGT1A3 (HEK/UGT1A3) or UGT1A4 (HEK/UGT1A4) showed a double band of approximately 54/57 kDa and a single band of approximately 56 kDa, respectively (Fig. 1). As Riedmaier et al. (2010) reported that not only UGT1A3 in human liver microsomes but also recombinant UGT1A3 appeared as a double band of approximately 54/57 kDa, the expression pattern of UGT1A3 was consistent with that of our established UGT1A3. These data indicated that the expressions of UGT1A3 and UGT1A4 were at comparable levels.

SDS-PAGE and immunoblot analyses of human UGT1As proteins. Total cell homogenates from HEK/MOCK, HEK/UGT1A3, or HEK/UGT1A4 cells were prepared. The samples (10 μg) were subjected to 10% SDS-PAGE and transferred to a polyvinylidene difluoride membrane. The membrane was probed with an anti-human UGT1A antibody. The UGT1A mRNA levels were corrected with the GAPDH mRNA levels.
After preparation of the total cell homogenate of UGT1A3, the 4-MU O-glucuronidation activity was investigated. In our previous study (Fujiwara et al., 2007b), we demonstrated that the total cell homogenate of UGT1A4 could catalyze the N-glucuronidation of imipramine. As seen in Table 1, HEK/UGT1A3 and HEK/UGT1A4 showed enzyme activity for each substrate. These data indicated that the enzyme activity of UGT1A3 and UGT1A4 was sufficiently high.
Kinetic parameters for 4-MU O-glucuronidation by UGT1A3 and imipramine N-glucuronidation by UGT1A4 expressed in HEK293 cells
Data represent the mean ± S.D. (n = 3).
Quantification of AG in HEK/UGT Cells.
To investigate the AG formation of each stable cell line, the AG in the cell fraction and the cultured medium was quantified at 6, 12, and 24 h after treatment with the NSAIDs. The AG was not detected in HEK/MOCK and HEK/UGT1A4 cells by LC-MS/MS analysis, whereas it was detected in HEK/UGT1A3 cells (Fig. 2). The AG of naproxen, diclofenac, ketoprofen, and ibuprofen in the cell fraction at 24 h was 4.5 ± 0.8, 3.8 ± 0.4, 0.2 ± 0.1, and 7.2 ± 1.2 pmol/2 × 105 cells, respectively, and that in the cultured medium was 137.0 ± 0.8, 104.0 ± 13.1, 6.3 ± 0.7, and 114.7 ± 2.2 pmol/ml, respectively (Supplemental Tables 1-1 and 1-2). Compared with the AG in the cell fraction of HEK/UGT1A3, the AG in the cultured medium was increased in a time-dependent manner. The AG formed in NSAID-treated cells was not accumulated and effectively distributed in the medium.
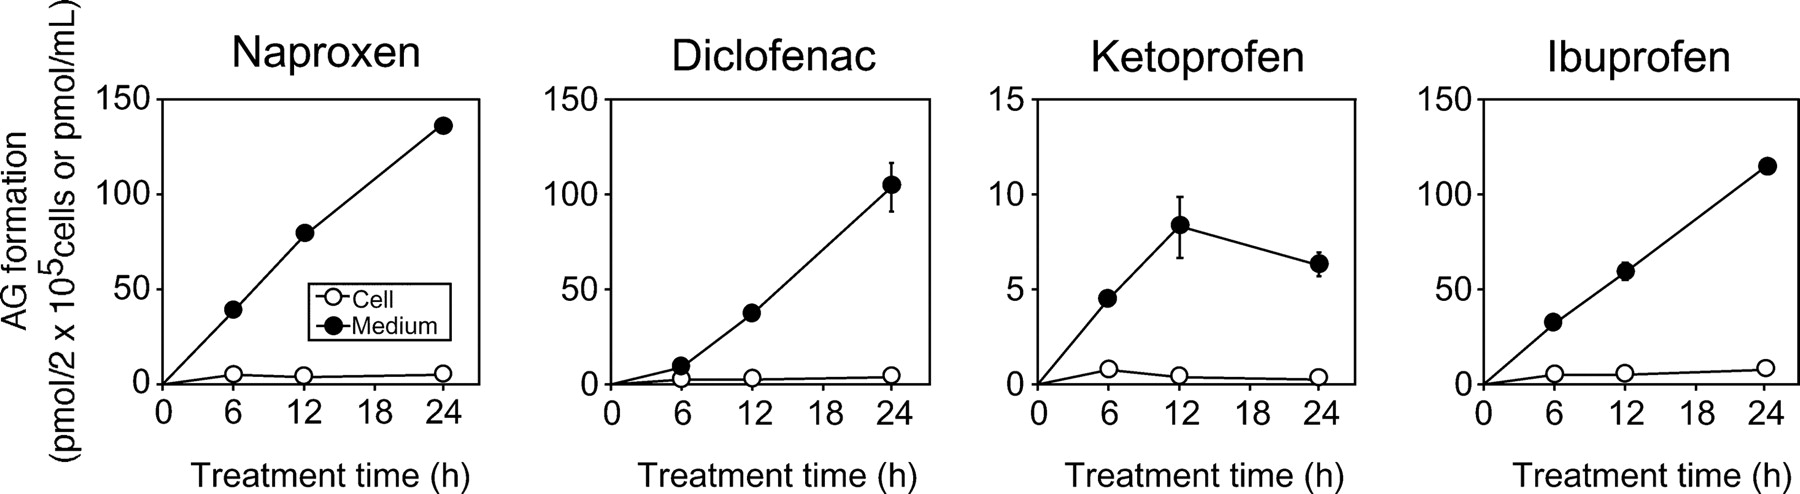
Time-dependent changes of AG formation in NSAID-treated HEK/UGT1A3 cells. HEK/UGT1A3 cells (2 × 10⁵ cells/ml/well) were incubated with naproxen (1 mM), diclofenac (0.1 mM), ketoprofen (1 mM), or ibuprofen (1 mM) for 6, 12, and 24 h. The cell fraction (picomoles per 2 × 10⁵ cells) and the cultured medium (picomoles per milliliter) were measured by LC-MS/MS. ○, cell fraction; ●, cultured medium. Each point represents the mean ± S.D. of triplicate determinations.
Cytotoxicity of NSAIDs in HEK/UGT Cells.
To investigate the cytotoxicity of the AGs of the NSAIDs, MTT, ATP, and LDH release assays were performed using HEK/UGT cells. In the MTT and ATP assays (Fig. 3), cell viability was decreased time dependently after treatment with the NSAIDs. However, there was no difference in the cell viability of HEK/UGT1A3 cells, which produced the AG, compared with that of HEK/MOCK and/or HEK/UGT1A4 cells. LDH leakage into the cultured medium was also assessed for 6-, 12-, and 24-h incubations. In each HEK/UGT cell line, none of the NSAIDs demonstrated LDH leakage that exceeded 5.4% of the total cell LDH levels (Supplemental Fig. 1). These results indicated that no cytotoxicity due to the AG formation from the NSAIDs was detected in HEK/UGT cells.
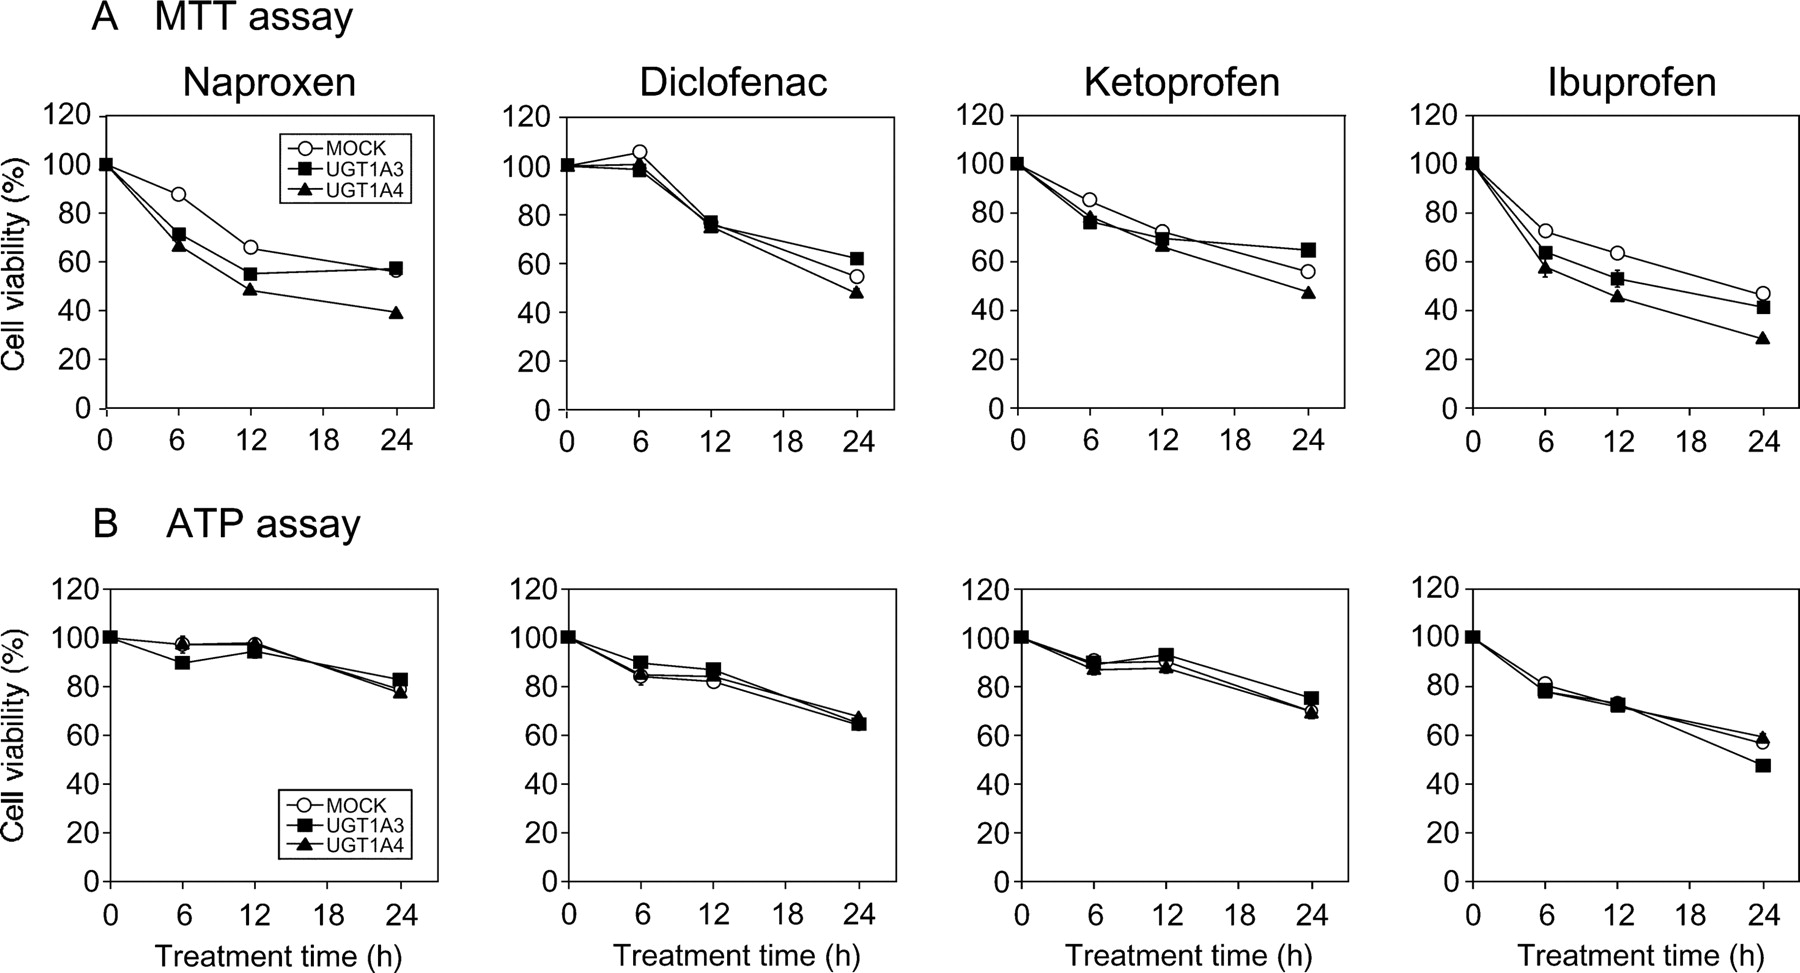
Time-dependent changes of cell viability assessed by MTT and ATP assays in NSAID-treated HEK/UGT cells. A, MTT assay. B, ATP assay. HEK/UGT cells (2 × 10⁴ cells/0.1 ml/well) were incubated with naproxen (1 mM), diclofenac (0.1 mM), ketoprofen (1 mM), and ibuprofen (1 mM) for 6, 12, and 24 h. ○, MOCK; ■, UGT1A3; ▴, UGT1A4. Each point represents the mean ± S.D. of triplicate determinations.
In addition, to investigate whether the other substrates affected the cytotoxicity, we used an MTT assay of HEK/UGT cells exposed to other carboxylic acid drugs such as clofibric acid (1 mM), gemfibrozil (1 mM), salicylic acid (1 mM), and zomepirac (0.1 mM) at 24 h. The cell viability of HEK/UGT1A3 cells was not significantly decreased compared with that of HEK/UGT1A4 cells (Supplemental Fig. 2).
Quantification of AG in Human Hepatocytes.
To investigate the inhibition effect of (−)-borneol on the formation of AG in NSAID-treated human hepatocytes, the AG in the cell fraction and the cultured medium was quantified. Without (−)-borneol treatment, the AG of naproxen, diclofenac, ketoprofen, and ibuprofen formed in the cell fraction at 6 h was 33.6 ± 1.0, 59.6 ± 1.1, 6.8 ± 0.5, and 27.7 ± 1.6 pmol/2 × 105 cells, respectively, and that formed in the cultured medium was 1323.9 ± 44.3, 2816.1 ± 63.5, 436.8 ± 8.0, and 1156.7 ± 21.9 pmol/ml, respectively (Fig. 4). On the other hand, with (−)-borneol treatment, the AG of naproxen, diclofenac, ketoprofen, and ibuprofen formed in the cell fraction at 6 h was 10.3 ± 0.4, 15.1 ± 1.3, 1.7 ± 0.1, and 3.5 ± 0.3 pmol/2 × 105 cells, respectively, and that formed in the cultured medium was 393.7 ± 13.7, 610.5 ± 29.7, 54.9 ± 0.8, and 126.5 ± 10.6 pmol/ml, respectively (Fig. 4). Therefore, the AG formed in NSAID-treated human hepatocytes was decreased to one-third to one-ninth by (−)-borneol treatment.

Effect of (−)-borneol treatment on AG formation in NSAID-treated human hepatocytes. Human hepatocytes (2 × 10⁵ cells/ml/well) treated with 1 mM (−)-borneol for 30 min were incubated with naproxen (1 mM) (A), diclofenac (0.1 mM) (B), ketoprofen (1 mM) (C), or ibuprofen (1 mM) (D) for 6 h. The cell fraction and the cultured medium were measured by LC-MS/MS analysis. Each point represents the mean ± S.D. of triplicate determinations. ***, P < 0.001 compared with without (−)-borneol treatment (control).
Cytotoxicity of NSAIDs in Human Hepatocytes.
We confirmed the inhibition effect of (−)-borneol on the AG formation of the NSAIDs in human hepatocytes. To investigate the effect of AG on the cytotoxicity in human hepatocytes, ATP and MTT assays were performed. In the ATP assay (Fig. 5A), the cell viability without (−)-borneol treatment was significantly decreased in the presence of the NSAIDs except ketoprofen compared with the nontreated control. If the AG showed cytotoxicity, the cell viability would be restored by (−)-borneol treatment. The cell viability with (−)-borneol treatment was further decreased, even though the AG formed in human hepatocytes was decreased. Likewise, MTT assay revealed that the cell viability was significantly decreased in the presence of naproxen (Fig. 5B). (−)-Borneol decreased the cell viability in the presence of diclofenac or ibuprofen. If the AG showed cytotoxicity, the cell viability would be restored by (−)-borneol treatment. However, (−)-borneol unexpectedly decreased the cell viability. To investigate whether the cytotoxicity is due to increased contents of the parent drugs in the cell fraction, we quantified the parent drugs using LC-MS/MS analysis. As a result, the contents of the parent drugs with (−)-borneol treatment were significantly higher than those without (−)-borneol treatment (Fig. 5C). These results indicated that the decreased cell viability of human hepatocytes with (−)-borneol treatment might be due to the increased contents of the parent drugs in the cell fraction. Therefore, AG formed in NSAID-treated human hepatocytes showed no cytotoxicity.

Effect of (−)-borneol treatment on cell viability assessed by ATP (A) or MTT (B) assays and on contents of parent NSAIDs in the cell fraction (C) of human hepatocytes. The human hepatocytes (2 × 10⁴ cells/0.1 ml/well) treated with 1 mM (−)-borneol for 30 min were incubated with naproxen (1 mM), diclofenac (0.1 mM), ketoprofen (1 mM), or ibuprofen (1 mM) for 6 h. □, without (−)-borneol treatment; ■, with (−)-borneol treatment. Each column represents the mean ± S.D. of triplicate determinations. *, P < 0.05; **, P < 0.01; ***, P < 0.001, compared with without (−)-borneol treatment. #, P < 0.05; ##, P < 0.01; ###, P < 0.001, compared with without NSAID treatment.
Comet Assay.
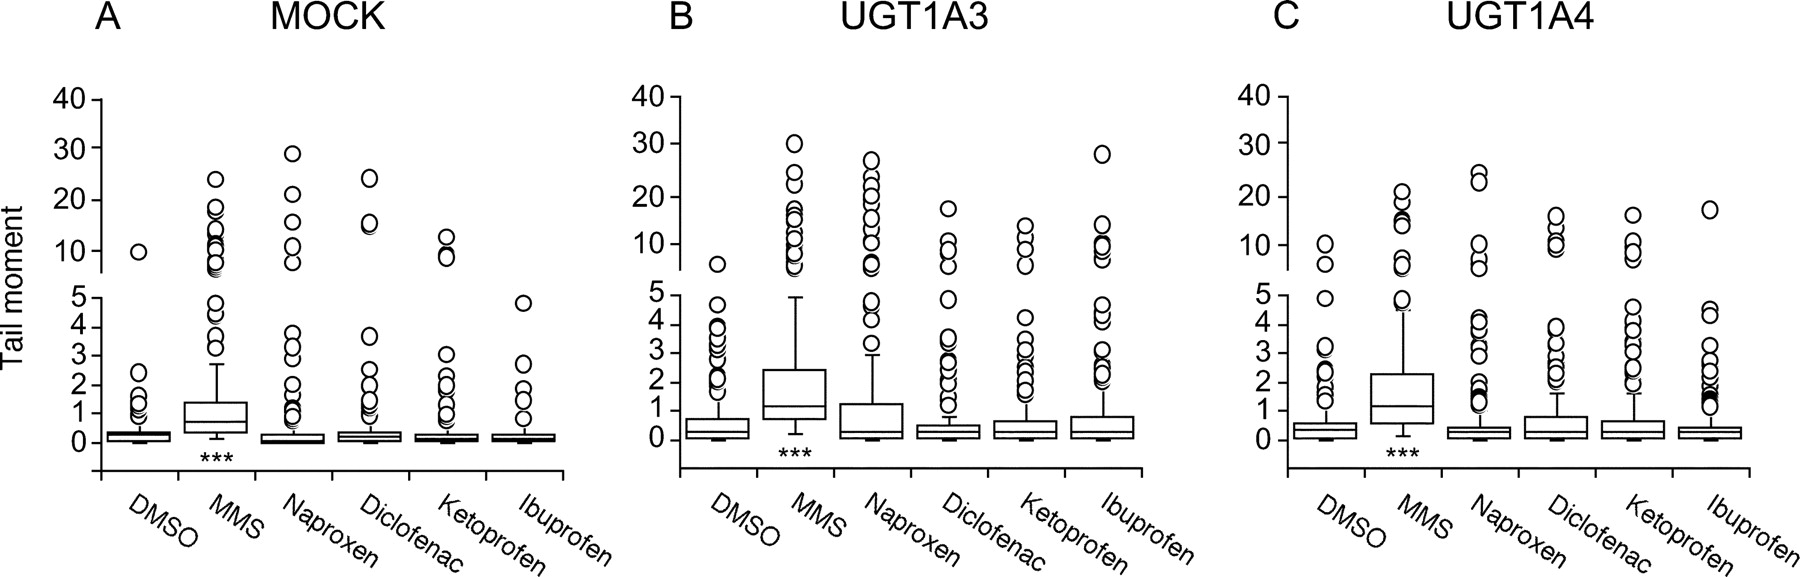
To investigate the possibility that the AG formed in NSAID-treated HEK/UGT cells caused secondary genotoxicity by nicking DNA, the comet assay was conducted after the 24-h treatment. The scores of the tail moments of NSAID-treated HEK/UGT cells are shown in Fig. 6. Cells exposed to the NSAIDs showed hardly any DNA strand breaks compared with the controls. Methylmethane sulfonate at 0.1 mM, as a positive control, caused a significant increase in DNA migration (P < 0.001) compared with the solvent control (DMSO). As shown in Fig. 6B, no drugs significantly increased the DNA migration in HEK/UGT1A3 cells, even though AG was produced in the cells. No genotoxicity owing to the AG formation from the NSAIDs could be detected in the present study.

DNA damage measured by the comet assay in HEK/MOCK (A), HEK/UGT1A3 (B), or HEK/UGT1A4 (C) cells. HEK/UGT cells (2 × 10⁵ cells/ml/well) were incubated with naproxen (1 mM), diclofenac (0.1 mM), ketoprofen (1 mM), ibuprofen (1 mM), and methylmethane sulfonate (MMS) (0.1 mM, as a positive control) for 24 h. Results are shown as median (± interquartile range) tail moment calculated from 30 to 60 comets scored per slide, in more than three separate experiments (total 150–180 comets). ○, outliers. ***, P < 0.001 compared with control (DMSO vehicle) incubations.
Discussion
There is increasing evidence that the formation of drug-protein adducts is involved in idiosyncratic reactions. However, direct mechanism-based evidence linking the toxicity to the formation of drug-protein adducts is lacking. We focused in this study on the toxicity due to cell dysfunction by acyl glucuronide formation. Therefore, we investigated whether the acyl glucuronide of NSAIDs represents cytotoxicity directly. In the toxicological assessment of AG in vitro, exposure of the cells to the hydrophilicity of AG must be taken into account, because it is possible that exposure to the AG from outside the cells could result in poor absorption. Therefore, to clarify the toxicity of AG, the cytotoxicity and genotoxicity of the AG formed in NSAID-treated HEK/UGT cells and human hepatocytes were evaluated at high concentrations, but there was no severe cytotoxicity from the parent drugs per se. For example, diclofenac caused low cell viability (approximately 20% of MOCK cells) at 1 mM (data not shown). Therefore, we examined diclofenac toxicity at 0.1 mM. On the other hand, naproxen, ibuprofen, and ketoprofen were examined at 1 mM.
HEK/UGT1A3 cells were constructed to investigate the cytotoxicity of AG. HEK/UGT1A4 cells were also used as a reference for HEK/UGT1A3 cells. HEK/UGT1A4 cells have the characteristics of high amino acid homology and different catalytic properties compared with HEK/UGT1A3 cells. Moreover, HEK/UGT1A4 cells could reflect the cytotoxicity of AG more accurately than HEK/MOCK cells (Fig. 1). After exposure to the NSAIDs for 24 h, AG formation was only detected in HEK/UGT1A3 cells in a time-dependent manner (Fig. 2). However, there was no difference in the cytotoxicity to HEK/UGT1A3 cells compared with that to HEK/UGT1A4 cells, even though HEK/UGT1A3 cells could produce AG (Fig. 3; Supplemental Fig. 1). Although the cytotoxicity of other carboxylic acid drugs (i.e., clofibric acid, gemfibrozil, salicylic acid, or zomepirac) in HEK/UGT cells was investigated, the cell viability of HEK/UGT1A3 cells was not significantly decreased compared with that of HEK/UGT1A4 cells (Supplemental Fig. 2). Furthermore, the cytotoxicity of other carboxylic acid drugs such as acetylsalicylic acid, flurbiprofen, indomethacin, niflumic acid, mefenamic acid, sulindac, bezafibrate, furosemide, probenecid, or mycophenolic acid at 1 mM was investigated by using the MTT assay, and the cell viability of HEK/UGT1A3 cells was not significantly decreased (data not shown). Therefore, no cytotoxicity of AG was detected even when other carboxylic acid drugs were selected. In general, it has been thought that protein and/or DNA adduct formation in response to AG is a causal factor for toxicity. Therefore, we may not be able to exclude the possibility of increased cytotoxicity after long-term exposure to carboxylic acid drugs. To address this issue, the cytotoxicity was investigated by using the MTT assay after exposure to the drugs (naproxen, ketoprofen, ibuprofen, clofibric acid, gemfibrozil, and salicylic acid at 1 mM and diclofenac and zomepirac at 0.1 mM) for up to 72 h. However, there was no significant difference in the cell viability of the HEK/UGT cells (data not shown).
HEK293 cells have been noted to lack many uptake and efflux transporters that are normally expressed on human hepatocytes. For example, HEK293 cells do not express organic anion-transporting polypeptide 2 or 8 (Hirano et al., 2004), so that the uptake of carboxylic acid drugs may be lower than that in human hepatocytes. Likewise, HEK293 cells do not express multidrug resistance-associated protein 2 (Hagmann et al., 1999) or multidrug resistance-associated protein3 (Zeng et al., 2000), so that the efflux of intracellularly generated AG may be lower than that in human hepatocytes. Therefore, the cytotoxicity of AG was investigated by using human hepatocytes that might reflect more closely AG formation in vivo. The AG formation in human hepatocytes was much higher than that in HEK/UGT1A3 cells. In particular, the AG in the cell fraction of human hepatocytes at 6 h of treatment was approximately 6- to 30-fold that in the cell fraction of HEK/UGT1A3 cells (Figs. 2 and 4). These results suggested that other UGT isoforms (i.e., UGT1A9 and UGT2B7) catalyzing the glucuronidation of the carboxylic acid drugs and/or the transporters involved in the AG formation might be expressed in human hepatocytes. Although the AG formed in NSAID-treated human hepatocytes was decreased by (−)-borneol treatment, the cytotoxicity was increased. The LC-MS/MS analysis indicated that the content of the parent drugs in the cell fraction of human hepatocytes with (−)-borneol treatment was significantly higher than that without (−)-borneol treatment (Fig. 5C). These results suggested that the formation of AG in human hepatocytes might represent a detoxification process.
The comet assay is a unique assay method for assessing the genotoxicity of AG (Sallustio et al., 1997, 2006; Southwood et al., 2007). Thus, we investigated genotoxicity using the comet assay. The results showed that the tail moments of the DNA migration were not significantly different in the HEK/UGT cell lines, even though HEK/UGT1A3 cells produced AG in the presence of the NSAIDs. Therefore, the AG formation from the NSAIDs is not involved in genotoxicity in vitro. In a recent report, Brambilla and Martelli (2009) described the genotoxicity and carcinogenicity of many NSAIDs. According to their report, naproxen, diclofenac, ketoprofen, and ibuprofen gave negative responses in reverse mutation (Ames) tests with Salmonella typhimurium and in a long-term carcinogenesis assay using rats and mice. Our results showing a lack of genotoxicity for all four NSAIDs by the comet assay are in accordance with this report. On the other hand, clofibric acid (1 mM), which produced no AG metabolites, gave significantly positive results for genotoxicity by the comet assay using HEK/UGT1A3 cells at 24 h of treatment (data not shown). This result supported the previous report of Southwood et al. (2007). As described in this report, fibrate hypolipidemic agents such as clofibric acid are nongenotoxic (Ashby et al., 1994). Therefore, one should be careful in interpreting the results of the comet assay.
Among the NSAIDS containing carboxylic acid drugs, diclofenac AG is one of the most studied for its related toxicity. Diclofenac AG is excreted into bile and transported to the small intestine where it can produce erosions and ulcers in a dose-dependent manner (Seitz and Boelsterli, 1998). In a recent article, Lagas et al. (2010) reported that Mrp2/Mrp3/Bcrp1−/− mice have markedly elevated levels of diclofenac AG in their liver and display acute, albeit mild, hepatotoxicity. As for the metabolic activation, it is well known that diclofenac is converted to 4′-hydroxydiclofenac and 5-hydroxydiclofenac via direct hydroxylation and that these two metabolites are further oxidized to form benzoquinone imine intermediates by human CYP2C9 and CYP3A4, respectively (Tang et al., 1999). Quinone imines are electrophiles that have been generally implicated in redox cycling and in producing oxidative stress and can undergo covalent binding with nonprotein or protein sulfhydryl groups because of their thiol reactivity (Boelsterli, 2003). Given the toxicity of diclofenac, it seemed to be important to evaluate not only the AG but also the quinone imines of diclofenac.
In conclusion, we investigated the relationship between cytotoxicity and AG formation by NSAIDs (naproxen, diclofenac, ketoprofen, and ibuprofen) in HEK/UGT cells and human hepatocytes and also the genotoxicity of the AG from NSAIDs in HEK/UGT cells. However, no cytotoxicity or genotoxicity due to the AG formed in the cells was found in the present study. Therefore, because AG appeared not to be a causal factor of the toxicity in vitro, additional work addressing a possible immune-mediated toxicity will be needed to clarify the toxicity of AG. This study provides new insight into the evaluation of acyl glucuronide toxicity in drug development.
Authorship Contributions
Participated in research design: Koga, Nakajima, and Yokoi.
Conducted experiments: Koga.
Contributed new reagents or analytic tools: Koga and Fujiwara.
Performed data analysis: Koga.
Wrote or contributed to the writing of the manuscript: Koga and Yokoi.
Acknowledgments
We acknowledge Dr. Tetsushi Watanabe (Kyoto Pharmaceutical University) for technical teaching and discussion about the comet assay and Brent Bell for reviewing the manuscript.
Footnotes
- Received July 23, 2010.
- Accepted October 6, 2010.
This study was supported by the Ministry of Health, Labor, and Welfare of Japan [Health and Labor Sciences Research Grant H20-B10-G001].
Article, publication date, and citation information can be found at http://dmd.aspetjournals.org.
doi:10.1124/dmd.110.035600.
↵
 The online version of this article (available at http://dmd.aspetjournals.org) contains supplemental material.
ABBREVIATIONS:
- NSAID
- nonsteroidal anti-inflammatory drug
- AG
- acyl glucuronide
- UGT
- UDP-glucuronosyltransferase
- HEK
- human embryonic kidney
- DMSO
- dimethyl sulfoxide
- UDPGA
- UDP-glucuronic acid
- 4-MU
- 4-methylumbelliferone
- GAPDH
- glyceraldehyde-3-phosphate dehydrogenase
- PAGE
- polyacrylamide gel electrophoresis
- PBS
- phosphate-buffered saline
- HPLC
- high-performance liquid chromatography
- FBS
- fetal bovine serum
- DMEM
- Dulbecco's modified Eagle's medium
- LC
- liquid chromatography
- MS/MS
- tandem mass spectrometry
- MTT
- 3-(4,5-dimethylthiazol-2-yl)-2,5-diphenyltetrazolium
- WST-8
- 2-(2-methoxy-4-nitrophenyl)-3-(4-nitrophenyl)-5-(2, 4-disulfophenyl)-2H-tetrazolium monosodium salt
- LDH
- lactic dehydrogenase.

- Copyright © 2011 by The American Society for Pharmacology and Experimental Therapeutics


