


III. Relationship between Metabolic Clearance and Slice Uptake Rate
Abstract
The time course for distribution of five compounds (caffeine, tolbutamide, phenytoin, ondansetron, and diazepam) was studied in precision-cut rat liver slices. Transport of these compounds differed greatly, with caffeine being distributed rapidly, but not accumulating above the media concentration. Although tolbutamide similarly was not accumulated within the tissue, its uptake rate was slower. The rate of phenytoin, ondansetron, and diazepam distribution (with appropriate corrections for metabolism) was slower still; yet, these drugs were accumulated within the cells of the slice to a concentration ∼15-fold that of the media. Examination of the physicochemical properties of these compounds demonstrated that the extent of accumulation positively correlated with lipophilicity, whereas the rate of uptake was not statistically correlated with log D.
The extent of accumulation within the slice was assessed by an apparent volume of distribution parameter (ranging from 26 to 195 μl/slice). Using cell:media partition coefficients determined in hepatocytes and the intra- and extracellular spaces within the slice (as measured with the markers tritiated water and sucrose), it was possible to predict apparent volumes of distribution for each drug in the liver slice. Comparison of observed and predicted apparent volumes of distribution gave ratios of 0.34–1. Intrinsic clearance values for these five drugs are available for slices and cells (slice:cell intrinsic clearance ratios 0.05–0.43; Worboys et al., Drug Metab. Dispos. 24, 676–681, 1996). Drugs that demonstrate low intrinsic clearance ratios also have low apparent volume ratios, thus indicating that reduced drug uptake and clearance in slices, relative to hepatocytes, are interdependent. Both phenomena may be rationalized by the existence of a drug concentration gradient within the slice. At very high drug concentrations, Vmax operates, and the consequence of the gradient is minimal. Therefore, it is possible to speculate upon the fraction of hepatocytes within the slice contributing to clearance by considering Vmaxvalues. For six pathways of metabolism, Vmax in slices averages 35% of the corresponding parameter in isolated hepatocytes. This is most likely due to limited oxygen and compromised metabolic function of the core cells. These distribution phenomena severely complicate the possibility of using a scaling factor based on the theoretical number of slices obtainable from a liver to predictin vivo intrinsic clearance.
Liver slices are proving a useful in vitro system for establishing routes of metabolism; several investigators (1-3) have been able to correlate the relative importance of specific pathways of metabolism in slices with that observed in vivo. Previously, we have investigated the kinetics of metabolism of caffeine, tolbutamide, phenytoin, ondansetron, and diazepam in liver slices (4-6), and found the clearance in slices to be lower than that in isolated hepatocytes when both sets of data are expressed per million cells. These in vitro systems differ in regard to their tissue architecture, maintained in slices, but lost in the hepatocyte isolation procedure; only isolated hepatocytes are incubated in direct contact with the drug in the media. Although the outer cells of a slice are directly exposed to media, the cells in the interior of the slice are only exposed to drug when it has traveled through, or around, the outer layers of cells. Recently, this phenomenon has been visualized using a fluorescent dye (7).
A method routinely used to investigate drug transport in hepatocytes uses silicone oil to separate the cells from the media by differences in their densities (8). In the present study, this procedure has been modified to allow separation of slices from media to examine the rate and extent of distribution in precision-cut rat liver slices of the five drugs previously characterized for their metabolite kinetics. The contrasting physicochemical properties of these drugs are shown in table 1. In addition, the reference markers,3H2O and [14C]sucrose (9, 10), were used to obtain estimates of slice intra- and extracellular volumes to assist the interpretation of the drug distribution data.
Physicochemical properties of caffeine, tolbutamide, phenytoin, ondansetron, and diazepam
Materials and Methods
Chemicals.
Phenytoin was purchased from Aldrich (Gillingham, Dorset, UK). Caffeine and tolbutamide were purchased from the Sigma Chemical Company (Poole, Dorset, UK). [14C]Caffeine (specific activity = 59.4 mCi/mmol) and [14C]phenytoin (specific activity = 48.6 mCi/mmol) were obtained from DuPont (Stevenage, UK). [14C]Tolbutamide (specific activity = 54.0 mCi/mmol), [14C]diazepam (specific activity = 57.0 mCi/mmol), 3H2O (specific activity = 1 mCi/ml), and [14C]sucrose (specific activity = 627.0 mCi/mmol) were obtained from Amersham (Little Chalfont, UK). Diazepam was a gift from Roche Products Ltd. Ondansetron and [14C]ondansetron (specific activity = 75.1 mCi/mmol) were gifts from Glaxo Research and Development. The radiochemical purity of these compounds exceeded 98%. Dow Corning 550 silicone oil (1.07 g/ml) and Dow Corning 510/50 cs silicone oil (0.99 g/ml) were purchased from BDH (Poole, Dorset, UK). All other general laboratory chemicals were purchased from BDH and were analytical grade. All solvents were of HPLC grade.
Animals.
Male Sprague-Dawley rats (250–300 g), obtained from Charles River (Margate, Kent, UK), were allowed free access to water and food (CRM pelleted diet, Agro Foods, Peniston, UK). Housing conditions were 22 ± 3°C, 40–70% relative humidity, and a 12-hr light/dark cycle.
Slice Preparation and Incubation.
Slices were prepared and 1 ml incubations of caffeine, tolbutamide, phenytoin, and ondansetron performed in 24-well tissue culture plates as previously described (4). As a result of extensive binding to the plastic well plates, diazepam incubations were performed in an analogous fashion in glass scintillation vials. Slices were added to wells containing buffer and the following marker/drug: i)3H2O with [14C]sucrose (aqueous mixture of 0.122 μCi 3H2O, 0.032 μCi [14C]sucrose); ii) 250 and 1000 μM tolbutamide {0.05 μCi [14C]tolbutamide (2 μl ethanol) and tolbutamide (2.5 μl dimethylformamide)};iii) 25 and 600 μM caffeine {0.04 μCi [14C]caffeine (2 μl ethanol) and caffeine (5 μl water)}; iv) 10 and 50 μM phenytoin {0.04 μCi [14C]phenytoin (2 μl ethanol) and phenytoin (2.5 μl ethanol)}; v) 10 and 100 μM ondansetron {0.05 μCi [14C]ondansetron (5 μl water) and ondansetron (5 μl water)}; and vi) 10 and 100 μM diazepam {0.1 μCi [14C]diazepam (2 μl ethanol) and diazepam (2.5 μl dimethylformamide)}. Unless otherwise stated, duplicate incubations were performed at each time point. Except when slices were being introduced to or removed from wells/vials, plates and vials were kept covered at all times to minimize media evaporation. Incubations were terminated by transferring slices with forceps to 1.5 ml Eppendorf tubes containing 250 μl silicone oil mixture (1:1 Dow Corning 550:Dow Corning 510/50 cs silicone oil, v/v), followed by immediate centrifugation at room temperature (1,500g, 10 sec). This resulted in the slice being deposited at the bottom of the tube with associated aqueous buffer remaining on the surface of the oil.
Initial experiments using single incubations every 1.5 min over 30 min with 250 μM tolbutamide, 25 μM caffeine, 10 μM phenytoin, 10 μM diazepam, and 10 μM ondansetron were performed to determine appropriate time points for use with each compound (data not shown). After these preliminary investigations, duplicate incubations over 0.5–10 min with caffeine; 1–25 min with tolbutamide, phenytoin, and ondansetron; and 2.5–60 min with diazepam were performed. Duplicate incubations with the markers 3H2O and [14C]sucrose were performed over 1–25 min.
Sample Analysis.
Buffer and oil were aspirated from tubes, and slices were transferred to 20 ml glass scintillation vials. After the addition of 0.5 ml Soluene-350, vials were capped and slices solubilized at 50°C for 4 hr (in the case of 3H2O and [14C]sucrose incubations, slices were digested at room temperature overnight). Control samples containing either one slice alone or one slice with marker/drug (but not centrifuged through oil) were processed in triplicate with the samples to provide blank samples and samples to determine the exact amount of marker/drug initially added to each incubation. After being allowed to cool at room temperature, 10 ml scintillant was added to each vial and the contents immediately mixed. Samples were mixed a further 2 times, left at room temperature in the dark for 24 hr for chemiluminescence reactions to decline, and radioactivity counted for 5 min. Using this method of analysis, the minimum detectable concentrations of total drug-related material (pmol/slice) were: 9.5 and 227.8 for 25 and 600 μM caffeine, 83.0 and 331.9 for 250 and 1,000 μM tolbutamide, 5.2 and 26.2 for 10 and 50 μM phenytoin, 3.1 and 31.0 for 10 and 100 μM ondansetron, and 1.5 and 15.1 for 10 and 100 μM diazepam, respectively.
Metabolite Assay.
The previously described method of analysis determined the total radioactivity within a slice. To determine the extent and rate of drug uptake, a correction for the contribution of metabolite(s) to the radioactivity detected in a slice was required for phenytoin, diazepam, and ondansetron incubations. Incubations of 10 and 50 μM phenytoin, 10 and 100 μM diazepam, and 10 and 100 μM ondansetron were performed as previously described for 25 min. Reactions were terminated after 25 min by transferring the media and slice to a plastic scintillation vial and snap-freezing in liquid N2. Vials were thawed at room temperature and 400 μl media removed for metabolite analysis. Slices were homogenized in the remaining 600 μl media using a MSE Ultrasonic disintegrator, and a 400 μl aliquot of homogenate removed for metabolite analysis. Phenytoin, diazepam, and ondansetron metabolites were quantified after conjugate hydrolysis and solvent extraction as previously described (5, 6).
Data Analysis.
The uptake of marker, 3H2O or [14C]sucrose, was calculated as a percentage of that initially in the media by dividing the radioactivity within the slice by the radioactivity initially added to the media. For tolbutamide, caffeine, phenytoin, ondansetron, and diazepam, the amount of drug or drug-related material within the slice was determined from the radioactivity counted and the specific activity of each compound incubated. Metabolism of tolbutamide and caffeine was negligible (metabolites accounted for 0.9 and 0.3%, respectively, of the total drug-related material in a slice—data not shown) over the incubation times used herein, and the radioactivity within a slice represents the amount of drug within the slice. However, in the case of phenytoin, ondansetron, and diazepam, a correction for metabolite retention within the slice was required. HPLC analysis determined the amount of metabolite(s) in 400 μl of media and in 400 μl of homogenate. These values were used to calculate the amount of metabolite(s) within a slice.
To determine the amount of intact drug within a slice, the amount of metabolite(s) was subtracted from the amount of total drug-related material. The amount of metabolite(s) retained within a slice was determined after a 25-min incubation, and previous studies have demonstrated linearity of metabolite formation with time for each of these compounds (5, 6). Therefore, the amount of metabolite(s) in the slice could be calculated at each time point.
Drug/marker uptake was time-dependent, showing an apparent exponential increase to a plateau value. Therefore, the time course of uptake at each media concentration studied could be described by theAmax2 and akapp for the uptake process (eq. 1). These parameters (Amax andkapp) were determined using the Siphar nonlinear regression program (Simed, Créteil, France) using a weighting factor of 1.
Results
The nonmetabolized reference indicators [14C]sucrose and 3H2O were used to provide estimates of the extracellular and total water spaces, respectively, within the liver slice (table 2). The space occupied by the low molecular weight marker [14C]sucrose (9.9 μl) includes vascular and interstitial volumes and any adherent water on the surface of the slice, and accounted for 46% of the total slice volume estimated by 3H2O (21.4 μl). The difference of 11.5 μl between the volumes occupied by these markers provides an estimate of the intracellular volume of a slice. It has been demonstrated that hepatocytes account for ∼65% of the cells in the liver, although they occupy 80% of the cellular volume (12, 13). Using this 80% figure, the volume of hepatocytes in a slice can be estimated at 9.2 μl (0.8 × 11.5 μl). We have previously determined slice hepatocellularity to be 2.05 × 10⁶ cells/slice (5), equating to 4.5 μl/106 hepatocytes. This determination is in agreement with estimates of hepatocyte volume by other workers (8, 14, 15) using 3H2O and [14C]dextran or [14C]inulin (dextran and inulin occupy the same water spaces as sucrose) as markers. These workers reported values of 2.2–3 μl/mg protein respectively; therefore using the figure of 0.65 × 10⁶ cells/mg protein (16), the hepatocyte volumes can be estimated as 3.8–4.7 μl/106 cells.
Parameters describing the uptake of caffeine, tolbutamide, phenytoin, ondansetron, diazepam, and water space markers in liver slices
The distribution of 3H2O was very rapid (k = 0.977 min−1), with equilibration between the slice and media being complete within 2–3 min (fig.1). The equilibration of [14C]sucrose was slower, taking 15–20 min with a rate constant of 0.285 min−1 (fig. 1). This slower uptake reflects the passage of this marker through the slice matrix via the paracellular route.
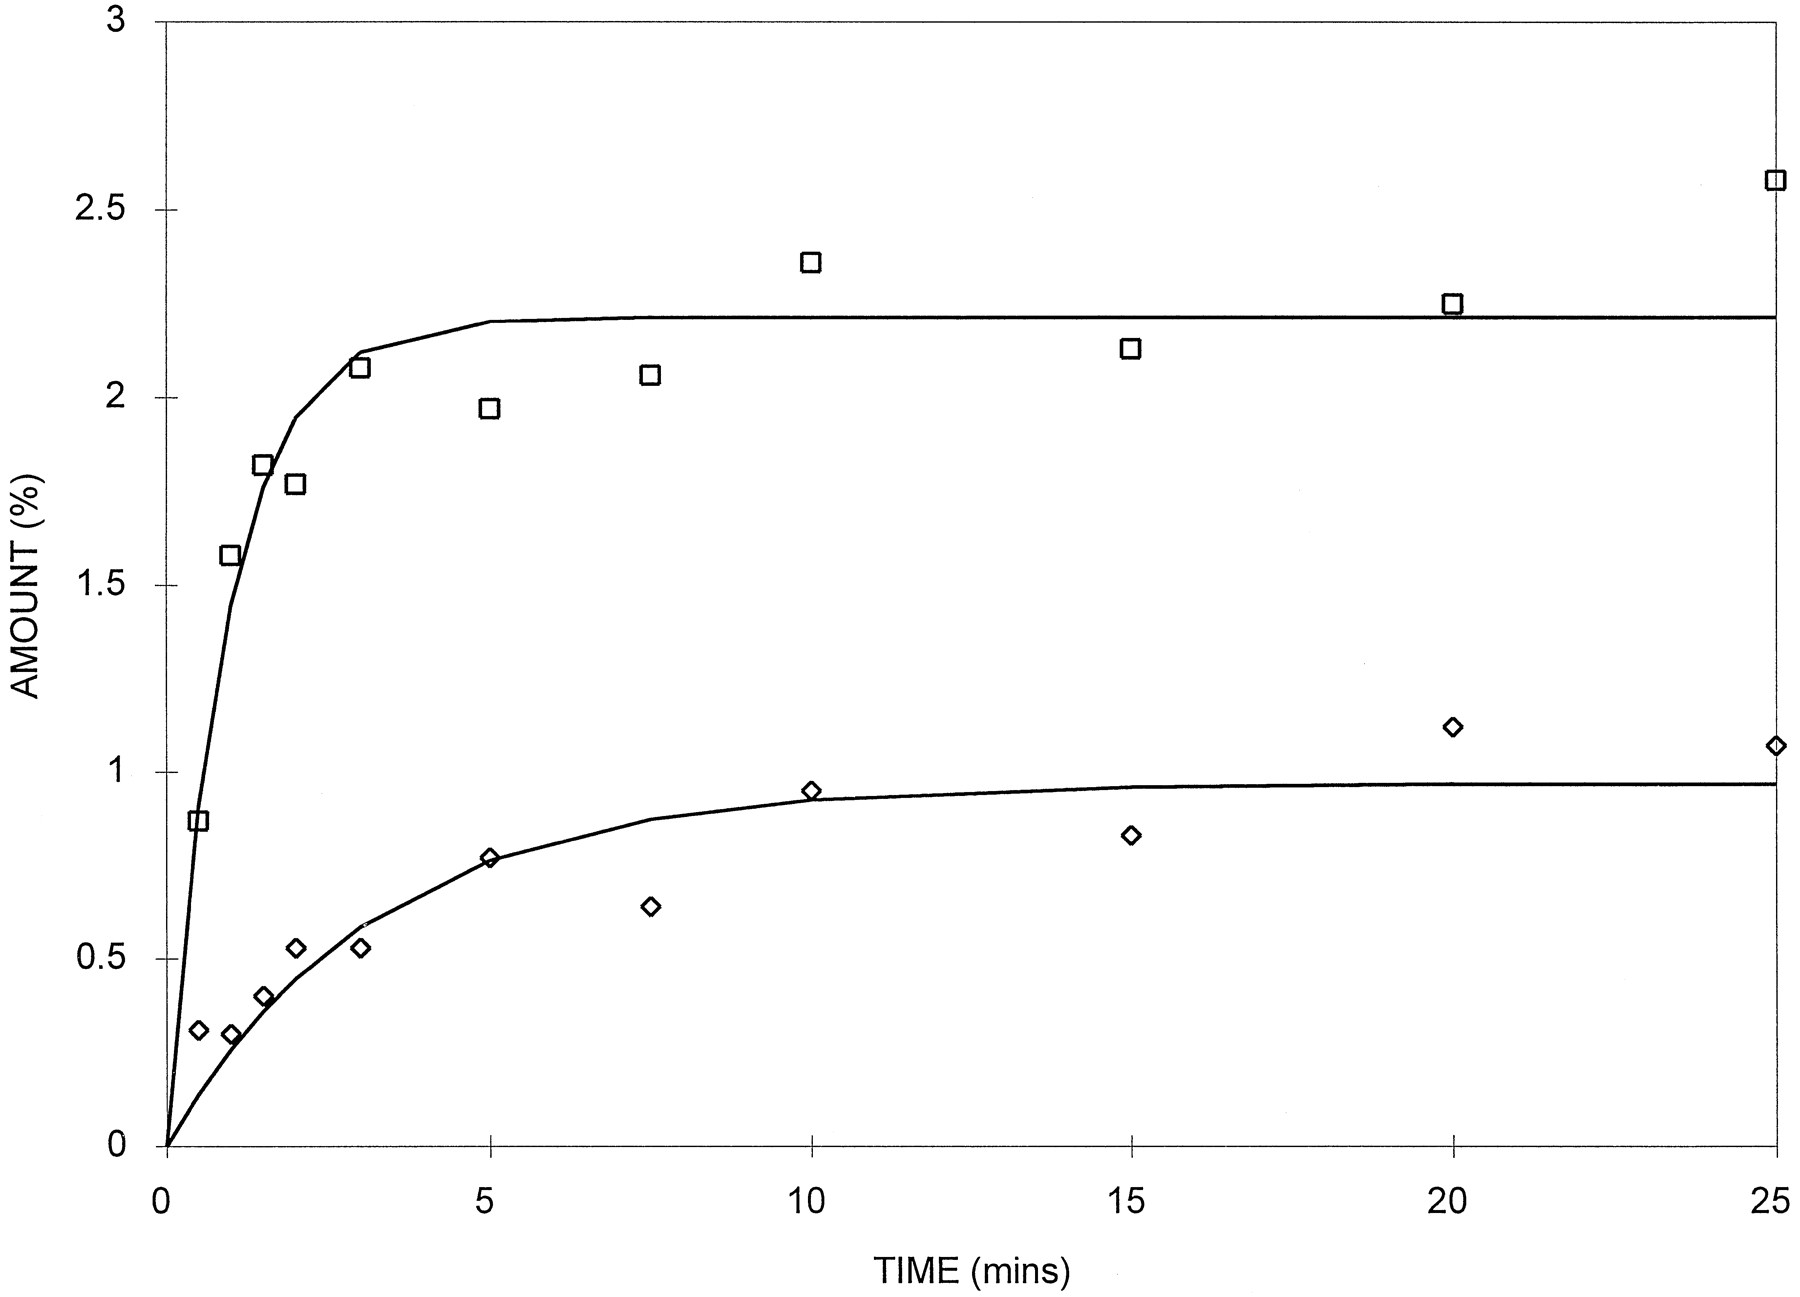
Slice uptake profiles for3H2O (□) and [14C]sucrose (◊) in liver slices.
Data from a typical animal. Incubations at 11 time points were performed in duplicate. Solid lines indicates the best fit using eq. 1.
The time course of uptake for caffeine and tolbutamide into a liver slice is shown in fig. 2. Both compounds are metabolized very slowly (4, 5); therefore, for these uptake data, it was not necessary to correct for metabolism by the slice. We have previously shown that hydroxytolbutamide was not retained within the tissue (4) and the low turnover of tolbutamide would have resulted in negligible amounts of metabolite being present in a slice. Caffeine is also a low turnover compound (5), and the extent of metabolite retention within the slice was considered negligible. The rate constants for uptake of these two drugs were intermediate to that observed with 3H2O and [14C]sucrose (table 2).

Slice uptake profiles for 250 μM [14C]tolbutamide (□) and 25 μM [14C]caffeine (◊) in liver slices.
Data from typical animals. Incubations at 8 time points were performed in duplicate. Solid line indicates the best fit using eq.1.
Phenytoin, ondansetron, and diazepam are high turnover compounds (5,6); therefore, it was necessary to correct slice radioactivity for retained metabolite(s) to characterize the process of drug uptake into liver slices. It was determined that after a 25-min incubation with phenytoin (10 and 50 μM), the retained hydroxymetabolite was concentration-independent, thus averaging 48% of the total formed (table 3). For ondansetron, 0.134 ± 0.053 and 0.610 ± 0.196 nmol of total metabolites were retained within a slice after a 25-min incubation with 10 and 100 μM ondansetron, respectively, accounting for 17.5 and 22.4% of the total formed, respectively. In the case of diazepam, 0.541 ± 0.249 and 3.101 ± 2.142 nmol of total metabolites were present in slices after the incubation of 10 and 100 μM diazepam, respectively (22.5 and 29.2% of the total metabolites formed).
Retention of phenytoin, ondansetron, and diazepam metabolite(s) in liver slices
For ondansetron and diazepam, compounds metabolized viamultiple pathways, the extent of retention of each metabolite varied but did not show concentration dependence (table 3). For ondansetron, the extent of retention was least with 7-hydroxyondansetron (15%) and greatest for the demethylated metabolite (37%). For diazepam, the nor-metabolite was retained to the greatest extent (39%), the 4′-hydroxy the least (19%), and the 3-hydroxy metabolite was intermediate (26%).
Typical uptake-time profiles for diazepam based on total radioactivity before and after correcting for the contribution of diazepam metabolites in the slice are illustrated in fig. 3. Similar profiles were generated for phenytoin and ondansetron (not shown). Estimates of Vapp andkapp for the five drugs (table 2) showed a 7- and 8-fold range, respectively. In general, larger volumes of distribution were associated with smaller rate constants. No differences in these parameters between the two concentrations used for each drug were observed.

Slice uptake profile for 10 μM [14C]diazepam (□), total drug-related material (▪), and metabolite formation (⧫).
Data from typical animals. Uptake incubations at 8 time points were performed in duplicate. Metabolite formation is the mean value from triplicate incubations performed in four animals.
Discussion
The process of drug/marker uptake into the liver slice can be described in terms of a simple exponential process. Uptake of3H2O is very rapid (half-life <1 min) and rates of drug uptake differ substantially (half-lives of 1.4–10.7 min). Whereas the time profiles for caffeine and tolbutamide were similar in nature to the marker time profiles, there was no apparent plateau value for radioactivity in the phenytoin, ondansetron, and diazepam experiments (as exemplified in fig. 3). This proved to be due to metabolite retention of these rapidly metabolized drugs.
Retention of hydroxyphenytoin within the slice was ∼50% of the amount of metabolite produced. The corresponding percentages of ondansetron and diazepam metabolites were 20 and 26%, respectively. The N-demethylated products of these two drugs exhibited the greatest retention (∼40%), whereas the retention of the hydroxylated products of ondansetron and diazepam were ∼15 and 20% of the total formed, respectively. We have previously determined that hydroxytolbutamide was not retained within the slice after incubation with 0.125–2.5 mM tolbutamide, whereas ∼50% of the hydroxycoumarin formed in a 0.5 μM ethoxycoumarin incubation was retained, the proportion decreasing at higher substrate concentrations, 8.3% at 100 μM (4). These observations demonstrate that metabolite retention is not constant between drugs and may vary for different substrate concentrations. In addition, in the case of drugs with multiple pathways, individual metabolites may be retained to differing degrees. Therefore, the phenomenon of metabolite retention is of particular importance for all drug metabolism investigations using liver slices.
All of the drugs studied herein distributed into the liver slice to a greater extent than 3H2O (table 2), thus producing a final slice concentration in excess of that in the media. Although caffeine and tolbutamide achieved a final concentration only slightly higher than that in the media, phenytoin, ondansetron, and diazepam accumulated within the slice to achieve much higher concentrations than that present in the media. There are many factors influencing hepatic drug uptake and transport (17), including the molecular weight, charge distribution, and lipophilicity of the compound. Caffeine—which has a relatively low molecular weight, is nonionized, and has a log D close to 0 (table 1)—shows rapid uptake with little accumulation. Tolbutamide and phenytoin have similar molecular weights and are acidic in nature, yet the former compound distributed relatively quickly, but was not concentrated within the slice, whereas phenytoin was apparently transported slowly but achieved a Kp of ∼15. These compounds differ substantially in terms of their lipophilicity, with logD(7.4) values of 0.52 and 2.40 for tolbutamide and phenytoin, respectively. Thus, the more lipophilic drug is taken up into a slice slower, although it is concentrated within the cells. Previous studies using isolated hepatocytes have shown that phenytoin uptake is a saturable process, although unaffected by various inhibitors and temperatures (18). These authors concluded that the high intracellular concentrations observed were due to binding rather than active transport. Similarly, we find ondansetron and diazepam to be extensively concentrated within slices; both compounds are lipophilic (log D values of 1.62 and 2.8, respectively). Therefore, it seems that the high lipophilicity of phenytoin, ondansetron, and diazepam is responsible for their extensive accumulation in liver slices. The relatively slow uptake rate for these lipophilic compounds will be discussed later.
It is possible to determine a slice Kp for each drug from the Vapp and water spaces. However, this cannot be estimated simply by taking the ratio of theVapp for the drug and the intracellular slice volume (11.5 μl) due to the complication that some of the drug will be present in the extracellular spaces of a slice. Therefore, assuming that the extracellular volume consists of water spaces in which drug cannot achieve a concentration greater than that in the surrounding media, a Kp can be determined fromVapp using the extra- and intracellular slice volume according to eq. 4.
The Kp values for tolbutamide and caffeine were 1.4 and 1.5, respectively (table 2), demonstrating that their distribution is primarily restricted to the water spaces of a slice, with little tissue binding. This is in agreement with studies in isolated hepatocytes (19, 20) in which Kp values of 1.4 and 1.3 were obtained for caffeine and tolbutamide, respectively. In contrast, phenytoin, diazepam, and ondansetron were concentrated to a level within the cells of the slice ∼15-fold higher than that in the media, indicating extensive tissue binding. Again, this is consistent with the literature on isolated hepatocytes (18,19). More specifically, we have determined Kp in hepatocytes for phenytoin, ondansetron, and diazepam of 40, 60, and 55, respectively, using the same methodology as used herein for liver slices (20). Using these Kp values and eq. 5,Vapp values were predicted for the five drugs under study (table 4). The differences between theVapp values in slices predicted from hepatocytes and observed in this study can be assessed from the ratios listed in table 4. Caffeine and tolbutamide have ratios close to one, but the lipophilic drugs (phenytoin, ondansetron, and diazepam) have lowerVapp values than is predicted from isolated hepatocyte studies. Thus, for these three latter drugs, a concentration gradient would seem to exist across the slice, with the net effect being an average cellular concentration below that achieved in isolated hepatocytes and a reduced Vapp.
Comparison of CLint in slices and isolated hepatocytes and Vapp observed in slices and predicted from isolated hepatocytes
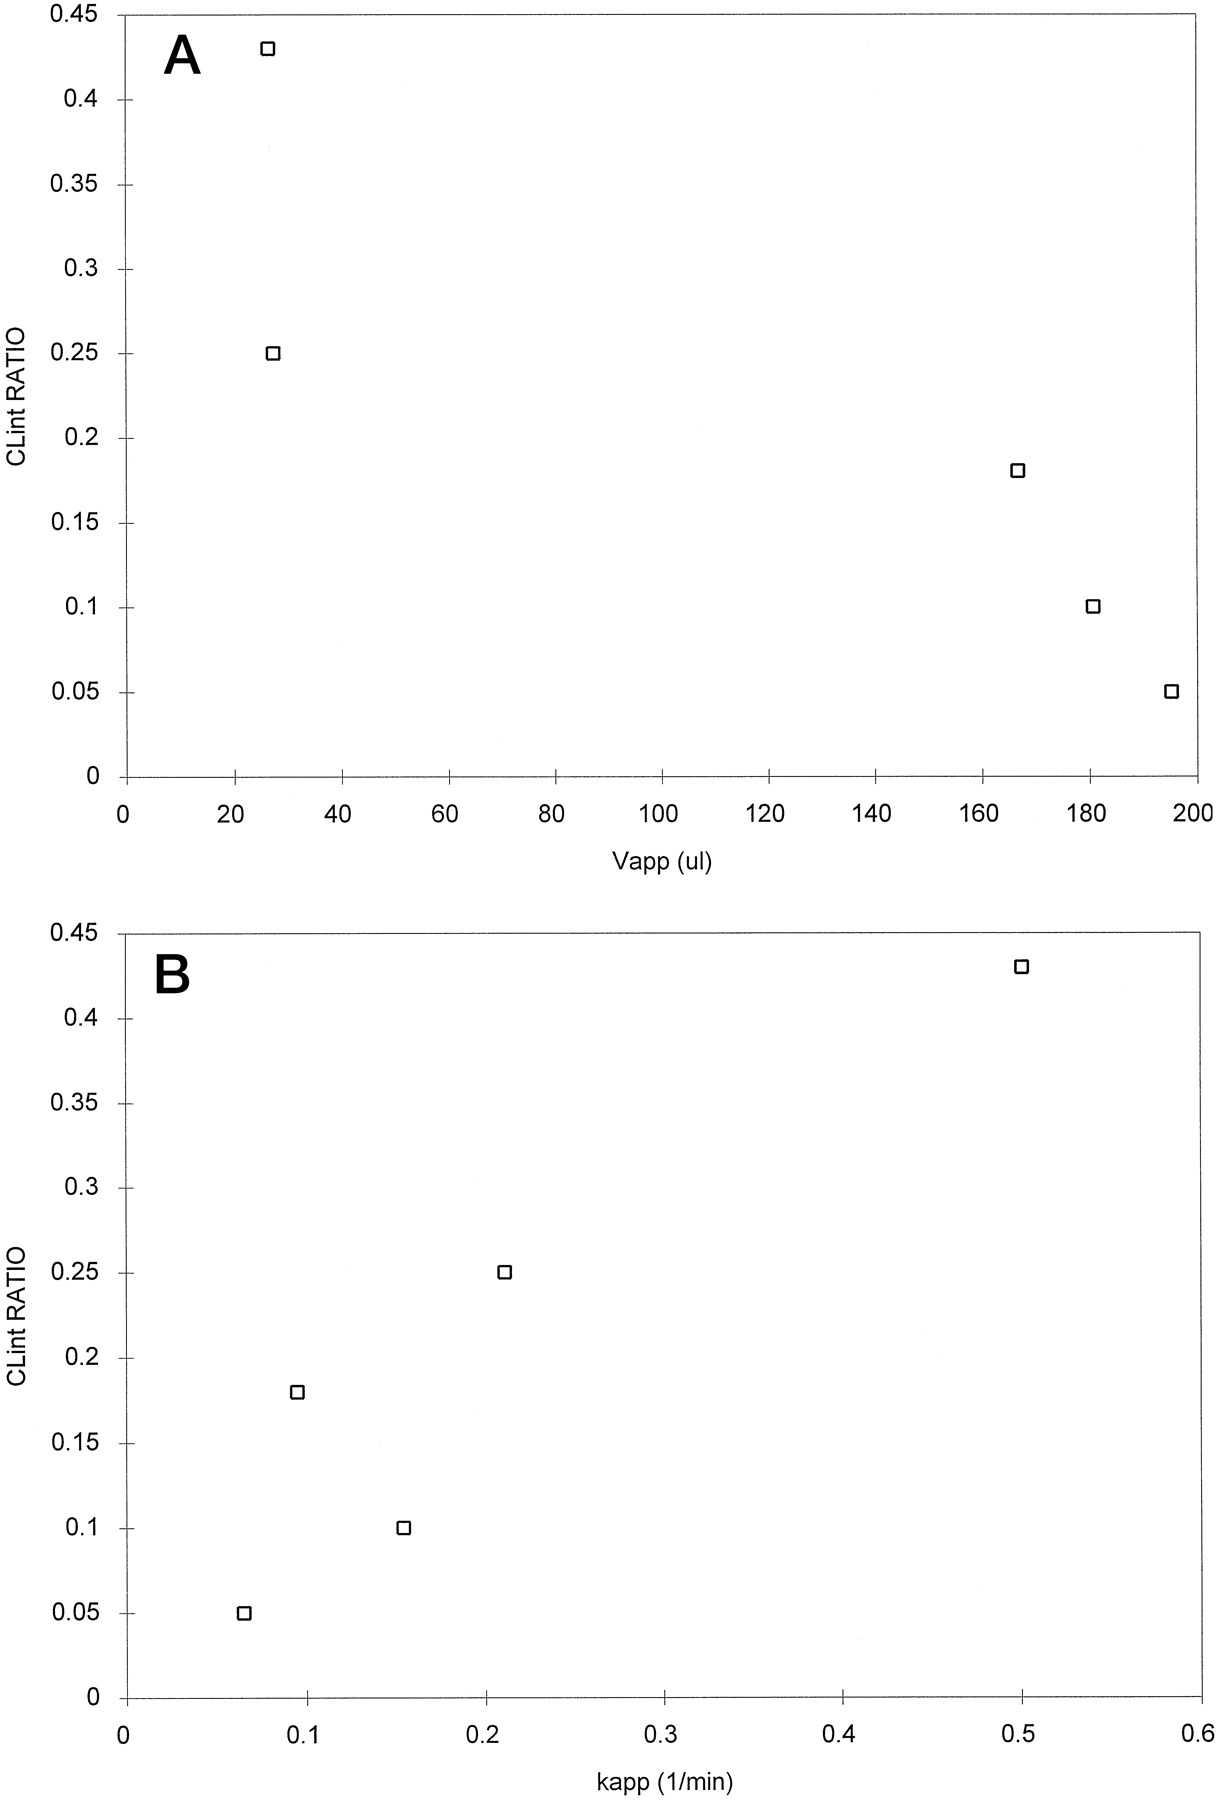
We have previously compared the kinetics of metabolism of tolbutamide, caffeine, phenytoin, ondansetron, and diazepam in liver slices and isolated hepatocytes (5). For all of these compounds, sliceCLint values were always less than comparable values in cells (table 4). Possible relationships between sliceCLint (expressed as a ratio to that in cells),Vapp, and kapp were investigated for tolbutamide, caffeine, phenytoin, ondansetron, and diazepam. The correlation between the CLintratio and both Vapp andkapp (fig. 4) is significantly different from zero (Pearson’s correlation coefficients of −0.881 and 0.907, respectively; p < 0.05). Because the correlation is positive for kapp and negative for Vapp, this would indicate that the highest relative clearances are obtained with compounds that distribute rapidly, but are not concentrated within the slice. Surprisingly there was no significant correlation between kapp and log D of these drugs, although Vappwas significantly correlated with log D (Pearson’s correlation coefficient = 0.889; p < 0.05).

Relationship between the ratio of CLint in slices and isolated hepatocytes and the apparent slice Vapp (A) and kapp (B) for caffeine, tolbutamide, phenytoin, ondansetron, and diazepam.
The present data also allows speculation on the proportion of cells within the slice that may contribute to slice clearance. The minimum number of cells would be the surface cells only, which would result in a clearance ratio of ∼0.1, as exemplified by ondansetron and diazepam (assuming a slice thickness of 20 cells). Data with caffeine and tolbutamide suggest that the maximum number of cells contributing to clearance is not the entire slice hepatocellularity. Although theVapp for these drugs is consistent with complete distribution throughout the total water spaces, the clearance ratio averages 0.35. Thus, only one-third of the cells are actively contributing to clearance. The obvious reason for this would be the limited oxygen and perhaps compromised metabolic function of the core cells. Further evidence for this claim is provided in the form of theVmax values for cells and slices (expressed per million cells in fig. 5). Data on six pathways, which show saturable kinetics in both in vitro systems, indicate that slices consistently show a maximal rate of metabolism in one-third of cells. The Vmax parameter is insensitive to a concentration gradient within the slice.

Relationship between maximal rates of metabolism per million cells in slices and isolated hepatocytes.
Vmax values for tolbutamide hydroxylation, ethoxycoumarin O-deethylation, phenytoin hydroxylation, diazepam 4′-hydroxylation and ondansetron hydroxylation, andO-demethylation (5, 6). This relationship may be described by: Slice Vmax = 0.35 × HepatocyteVmax.
It is of interest that the drugs that demonstrate lowCLint ratios are also the drugs with lowVapp ratios (fig. 6). These drugs—phenytoin, ondansetron, and diazepam—also have a lower rate constant for uptake than would be expected, based on their logD values. For example, Ichikawa et al. (19) have shown that, for tolbutamide and diazepam (log D values differ by 5-fold), there is a difference in isolated hepatocyte permeability of 13-fold. In neither case was metabolic clearance limited by the cellular uptake processes. A similar situation has been shown for phenytoin (18), and would be expected for caffeine and ondansetron. However, in contrast, the present studies in slices show a strong interrelationship between uptake rate and clearance. We have previously (5) speculated that delayed accessibility of substrate prevents equilibrium concentrations being established in all cells of the slice and hence a reduced clearance results. This explanation for reduced clearance was supported by increased KM
values in slices relative to hepatocytes. Present data also support this speculation. Using the previously published isolated hepatocyteCLint values and the 0.35 factor for the ratio of slice:isolated hepatocyte CLint, a theoretical slice CLint can be calculated. If this number is divided by the Vapp, then a theoretical rate constant for metabolism by the intact slice can be calculated assuming a single compartment model for the kinetics in the slice:

Relationship between the ratio of CLint in slices to isolated hepatocytes and the ratio of Vapp observed in slices to that predicted from isolated hepatocytes for caffeine, tolbutamide, phenytoin, ondansetron, and diazepam.
Line shown is drawn by eye on the basis that maximal activity for a slice is 35% of the hepatocyte value (see fig. 5 and text) when distribution is complete.
In conclusion, the distribution properties of drugs within liver slices severely complicate the possibility of scaling clearance data from thisin vitro system to the in vivo situation. A scaling factor based solely on the number of slices theoretically obtainable from a liver is not appropriate for this in vitrosystem. It seems that as a result of the tissue architecture of the liver slice, resolution of the transport processes and metabolism is difficult. The apparent uptake rate constant measured in slices may be a reflection of either transport into the slice or metabolism during transit through the slice. Thus in vitro:in vivocorrelations for liver slices must be restricted to rank order comparisons based on current knowledge.
Footnotes
-
Send reprint requests to: Dr. J. Brian Houston, Department of Pharmacy, University of Manchester, Manchester M13 9PL, UK.
-
↵1 Present address: Department of Medicinal Chemistry, Merck Sharp & Dohme Research Laboratories, Harlow, Essex CM20 2QR, UK.
-
P.D.W. was the recipient of a Glaxo Studentship.
- Abbreviations used are::
- Amax
- maximal uptake amount
- kapp
- apparent uptake rate constant
- Cm
- concentration in media
- Vapp
- apparent volume of distribution
- Vic
- intracellular volume
- Vec
- extracellular volume
- Cic
- concentration of drug intracellularly
- Kp
- cell:media partition coefficient
- CLint
- intrinsic clearance
- Received August 26, 1996.
- Accepted January 13, 1997.
- The American Society for Pharmacology and Experimental Therapeutics


