


Abstract
This study determined the disposition of irinotecan hydrochloride trihydrate (CPT-11) after i.v. infusion of 125 mg/m2 (100 μCi) [14C]CPT-11 in eight patients with solid tumors. Mean ± S.D. recovery of radioactivity in urine and feces was 95.8 ± 2.7% (range 92.2–100.3%, n = 7) of dose. Radioactivity in blood, plasma, urine, and feces was determined for at least 168 h after dosing. Fecal excretion accounted for 63.7 ± 6.8 (range 54.2–74.9%, n = 7) of dose, whereas urinary excretion accounted for 32.1 ± 6.9% (range 21.7–43.8%; n = 7) of dose. One patient with a biliary T-tube excreted 30.1% of dose in bile, 14.2% in feces, and 48.2% in urine. Quantitative radiometric HPLC revealed that CPT-11 was the major excretion product in urine, bile, and feces. Aminopentane carboxylic acid (APC) and SN-38 glucuronide (SN-38G) were the most significant metabolites in urine and bile, whereas SN-38 and NPC, a primary amine metabolite, were relatively minor excretion products. SN-38 and APC were the most significant metabolites in feces. The relatively higher amount of SN-38 in feces compared with bile is presumably due to hydrolysis of SN-38G to SN-38 by enteric bacterial β-glucuronidases. There was close correspondence between quantitative fluorescence HPLC and mass balance findings. CPT-11 was the major circulating component in plasma (55% of the mean radiochemical area under the curve), and CPT-11, SN-38, SN-38G, and APC accounted for 93% of the mean radiochemical AUC. These results show that the parent drug and its three major metabolites account for virtually all CPT-11 disposition, with fecal excretion representing the major elimination pathway.
The antineoplastic agent irinotecan hydrochloride trihydrate (CPT-11, Camptosar, PNU-101440E; (S)-[1,4′-bipiperidine]-1′-carboxylic acid, 4,11-diethyl-3,4,12,14-tetrahydro-4-hydroxy-3,14-dioxo-1H-pyrano[3′,4′:6,7]indolizino(1,2-b)quinolin-9-yl ester, monohydrochloride, trihydrate; C33H38N4O6·HCl·3H2O) is a semisynthetic derivative of the natural product camptothecin (Kunimoto et al., 1987; Sawada et al., 1991). CPT-11 was recently approved by the U.S. Food and Drug Administration for the treatment of patients with metastatic carcinoma of the colon or rectum whose disease has recurred or progressed following 5-fluorouracil-based therapy. The recommended starting dosage of CPT-11 is either 125 mg/m2 i.v. over 90 min once a week for 4 weeks, followed by a 2-week rest, or 350 mg/m2 given once every 3 weeks. Dosage modifications after the initial dose are based on individual patient tolerance.
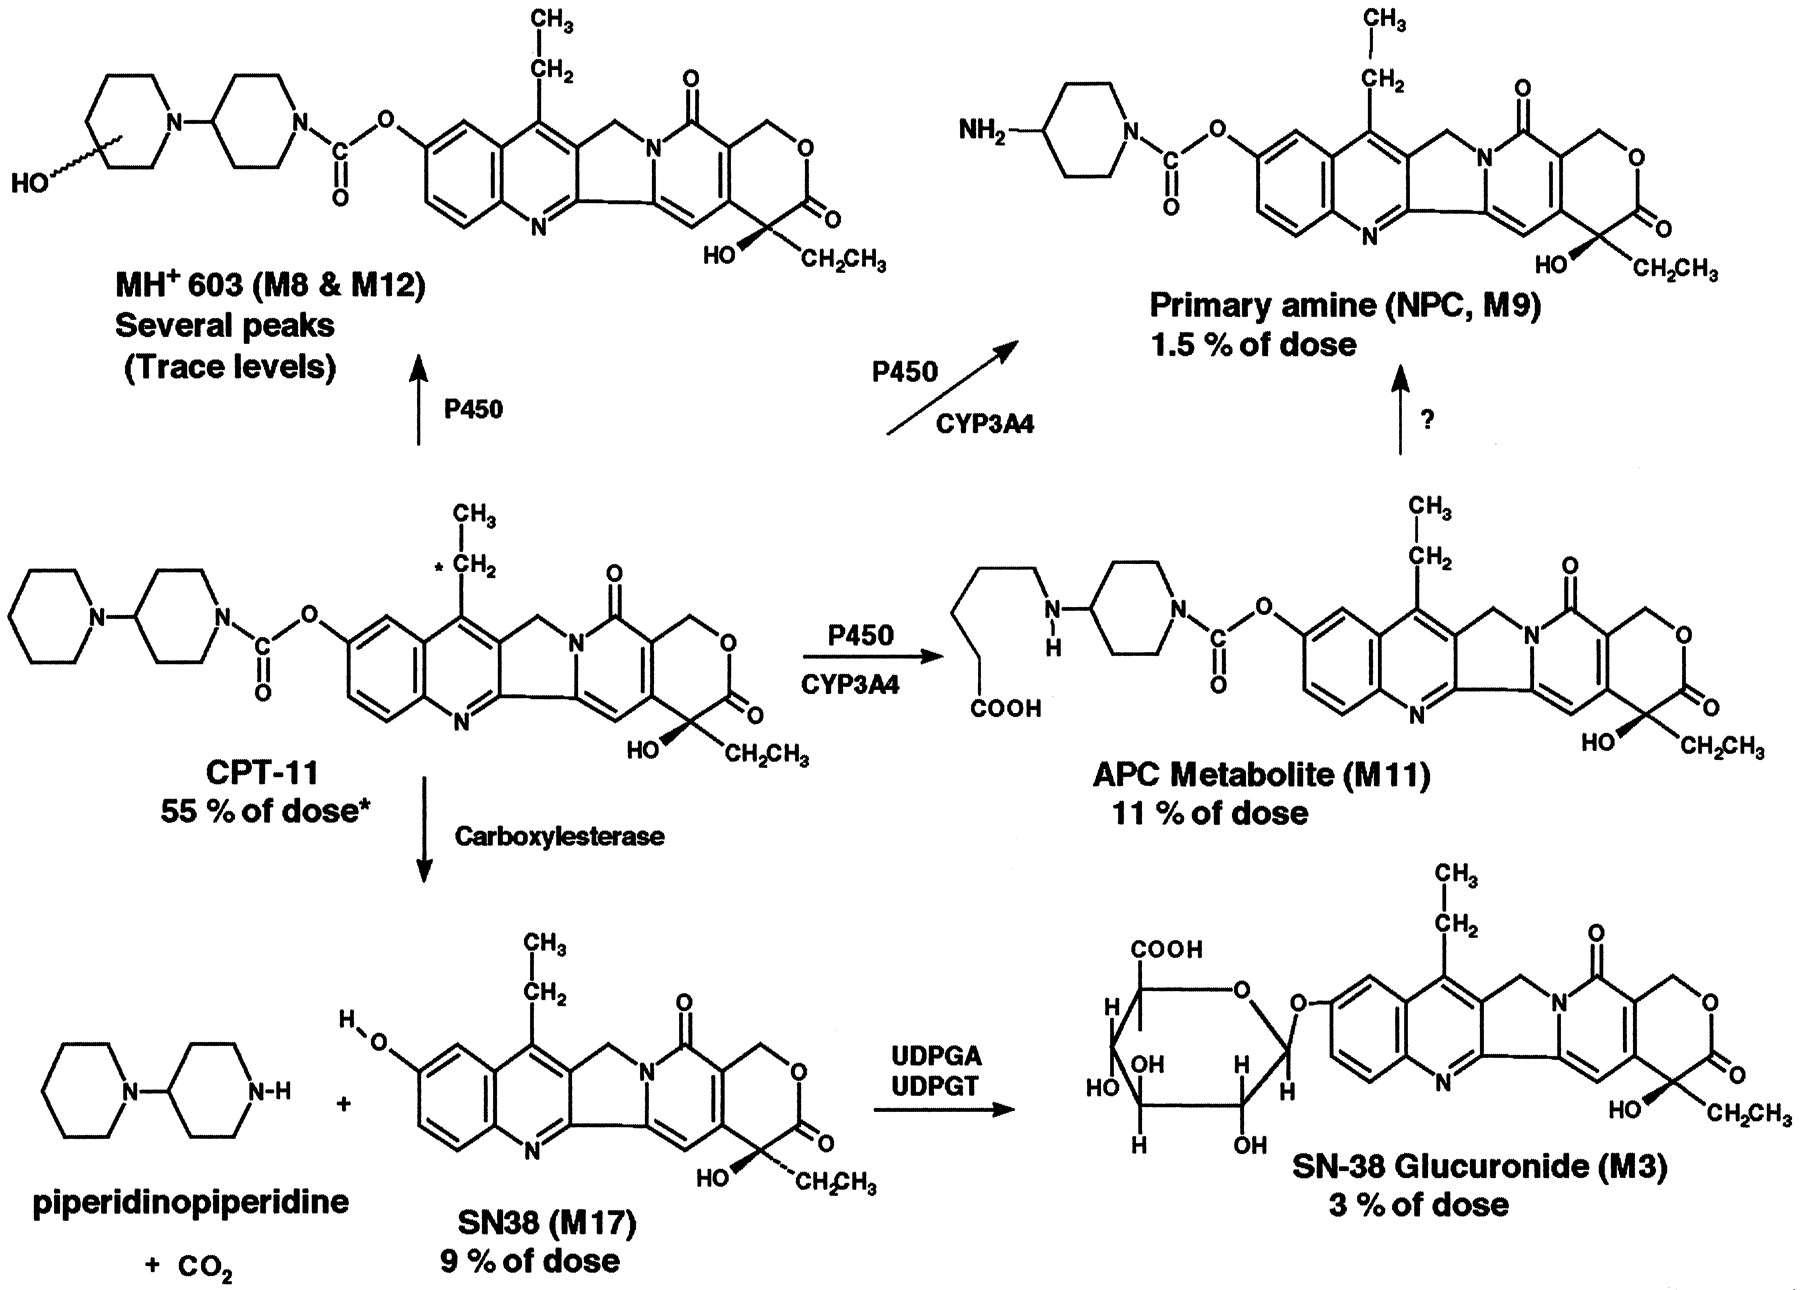
The metabolism of CPT-11 in humans has been studied extensively using nonradiometric methodology (Kono and Hara, 1991; Gupta et al., 1994;Lokiec et al., 1995, 1996; Rivory and Robert, 1995; Rivory et al., 1996, 1997; Slatter et al., 1997; Dodds et al., 1998; Haaz et al., 1998a,b; Sparreboom et al., 1998). The structures of CPT-11 and its known metabolites are shown in Fig. 1. CPT-11 is converted in vivo by carboxylesterase enzymes (Haaz et al., 1997; Slatter et al., 1997) into SN-38, a potent inhibitor of topoisomerase I, which is a nuclear enzyme that plays a critical role in DNA replication and transcription (Hsiang et al., 1985). Differences in the in vitro cytotoxicity of SN-38 and CPT-11 can be as low as 130- to 570-fold (human colon cancer cell lines; Jansen, 1997) or as high as 2973-fold (human KB cell line; Kaneda et al., 1990; Lavelle et al., 1996). However, relative in vitro potency data are of limited usefulness due to the in situ formation of SN-38 from CPT-11 and a variety of other experimental factors. Accordingly, CPT-11 is generally considered to be effectively inactive and serves only as a soluble prodrug of SN-38 (Kawato et al., 1991; Yoshida et al., 1993; Lavelle et al., 1996). The active metabolite SN-38 is in turn excreted intact, or as a glucuronide metabolite (SN-38G) (Gupta et al., 1994; Rivory and Robert, 1995). Other known human metabolites of CPT-11 include an aminopentane carboxylic acid (APC) arising from CYP 3A-mediated α-carbon oxidation of the outer piperidine ring of CPT-11 (Lokiec et al., 1996; Rivory et al., 1996) and a primary amine metabolite (NPC; RPR-132595A; Dodds et al., 1998; Haaz et al., 1998a) derived from the CYP 3A-mediated oxidative cleavage of both α-carbons of the outer piperidine ring. A variety of other minor metabolites and decomposition products have been identified by mass spectrometry (MS) and chemical synthesis (Lokiec et al., 1996; Dodds et al., 1997).

Metabolism scheme for [14C]CPT-11.
Nonextractable (mostly fecal) radioactivity = 11% of dose; late excretion products not profiled = 4% of dose; unidentified peak M7 = 1% of dose; M5 (CPT-11 hydroxy acid-artifact) = 0.2% of dose; sum of all other 10 peaks = 1.2% of dose. ∗ denotes radiolabel location.
Biliary excretion represents the major elimination pathway for CPT-11 and its metabolites in preclinical species (Kaneda and Yokokura, 1990;Kaneda et al., 1990). CPT-11 and its metabolites exist in a pH dependent equilibrium between active lactone and inactive hydroxy acid anion (carboxylate) forms at physiological pH. The carboxylate forms of CPT-11 and SN-38 and both the carboxylate and lactone forms of SN-38G (Chu et al., 1997a) are all anions at physiological pH. In vitro and in vivo studies in rats have demonstrated that the biliary excretion of the carboxylate forms of CPT-11 and SN-38 and the carboxylate and lactone forms of SN-38G are mediated by the active transporter cMOAT, which is located on the bile canalicular membrane (Chu et al., 1997a,b,1998). The carboxyl-ate forms were also shown to have a higher biliary excretion clearance than the lactone forms (Chu et al., 1998). These results are consistent with other studies which have demonstrated that the clearance of the lactone forms of other camptothecin analogs is generally lower than that of the hydroxy acid anion forms (Scott et al., 1993a,b).
The objective of this study was to quantitatively determine the pharmacokinetics, metabolism, and excretion of [14C]CPT-11 and its metabolites in male and female human cancer patients.
Materials and Methods
Study Design.
The study enrolled eight Caucasian patients, (four male/four female, 51–74 years of age) with histologically confirmed diagnoses of advanced solid tumor malignancy for which there were no clearly established standard treatment options. Patients had an Eastern Cooperative Oncology Group performance status of 0 to 2 and adequate organ function. Prior chemotherapy or radiation therapy was allowed. All subjects provided written informed consent before enrollment. Radiation exposure estimates for human tissues were predicted from rat [14C]CPT-11 distribution and excretion data with the use of maximum internal radiation dose software (Loevinger et al., 1991). The 100-μCi dose chosen for this study is similar to that given in most other human 14C trials conducted in the United States (Dain et al., 1994).
Each patient received a single 90-min i.v. infusion (500 ml total volume) containing a target dose of 125 mg/m2 of CPT-11 and 100 μCi of [14C]CPT-11 on day 1. Urine, feces, blood, plasma, and, in one patient, bile were collected over the next 7 to 9 days for radioanalysis, pharmacokinetic analysis, and metabolite profiling. Patient demographics and dosimetry are summarized in Table 1. Actual radiation exposure, calculated for each patient with the maximum internal radiation dose method (Loevinger et al., 1991), was well below the limits permitted by the U.S. Food and Drug Administration (Code of Federal Regulations 21, Part 361.1, 1998). CPT-11 administration at this dose level was well tolerated, with no instances of vomiting or immediate-onset diarrhea.
Summary of patient demographics and dosimetry
Formulation and Dose Administration.
CPT-11 was labeled with 14C on the proximal carbon of the 11-ethyl substituent of the camptothecin ring. The radiolabel was formulated as a sterile solution concentrate and packaged in 5-ml amber ampules containing [14C]CPT-11 (0.235 mg/ml, 20 μCi/ml), ethanol to dissolve (∼0.06 ml/ml), and 5% dextrose (q.s. ad 1 ml). At this low concentration, the sterile solution could be stored frozen without risk of self-association or precipitation (Aiyama et al., 1992). The radiopurity was 97% over the duration of the study. Nonradioactive CPT-11 was obtained from commercial Camptosar. For each patient, radioactive and nonradioactive concentrates were weighed and aseptically transferred into a 500-ml bag of sterile dextrose 5% in water just before administration. The administered dose was determined gravimetrically. The mean concentration of CPT-11 in the formulation (n = 8) was 0.46 ± 0.05 mg/g, and the specific activity was 0.40 ± 0.05 μCi/mg.
Biological Specimen Collection.
Blood samples were collected at −90 min (predose); 0 min (end of infusion); and 5, 15, and 30 min, and 1, 1.5, 2, 3, 4, 6, 8, 10, 12, 16, 24, 36, 48, 72, 96, 120, 144, and 168 h after the end of the infusion. Urine was collected and pooled over −24 h to −90 min (preinfusion); −90 min to 0 h (during the infusion); 0 to 2, 2 to 4, 4 to 8, 8 to 12, 12 to 24, 24 to 36, 36 to 48, 48 to 60, 60 to 72, 72 to 84, 84 to 96, 96 to 120, 120 to 144, and 144 to 168 h (postinfusion); and in 24-h increments thereafter as needed. Feces were collected as voided and pooled in 0- to 12-, 12- to 24-, and 24-h increments thereafter. In one patient (5F) with a biliary T-tube, bile was collected quantitatively over the first 72 h postdose and selectively thereafter as determined by cholestasis and the clinical status of the patient. Excretion data for this patient were omitted from the calculation of means for all excretion-based data.
Radioactivity Analysis.
All assays were done gravimetrically by direct capture of sample weights by Debra version 4.1c (LabLogic Systems Ltd., Sheffield, UK). Radioactivity analysis was performed using Packard Tri-Carb liquid scintillation spectrometers (Packard Instrument Co., Meriden, CT). Fecal homogenates and blood were combusted with a Packard Tri-Carb sample oxidizer (model 387) and analyzed by liquid scintillation counting (LSC) in Carbosorb E/Permafluor E+ (Packard Instrument Co.). Radioactivity in plasma, bile, and urine was determined by LSC in Ultima Gold.
Radioactivity Data Analysis.
Dose weights recorded in mg of CPT-11 hydrochloride trihydrate, specific activity in μCi/mg, body weight in kg, sample weights in g, aliquot weights in g, uncorrected LSC results in dpm, LSC background in predose matrix, and patient numbers were processed by Debra version 4.1c. Excretion data for each matrix (urine, feces, and bile) and for the sum of all matrices were expressed as recovered percentage of administered radioactive dose per collection. The percentage of dose excreted during each collection interval calculated by Debra was transformed to cumulative percentage of dose excreted and percentage of dose remaining to be excreted [amount remaining to be excreted (ARE)] with Excel version 5.0c (Microsoft Corp., Redmond WA). ARE half-lives were calculated for urine data by linear regression of the log-linear terminal phase. Blood and plasma radioanalysis data were expressed as μg-eq of CPT-11 hydrochloride trihydrate/g of sample matrix. For comparison to plasma levels of CPT-11 and metabolites, μg-eq/g were converted to μM-eq. Hematocrit data from each patient were used to calculate the blood/plasma partition coefficient Kp (Sun et al.,1987) written in Microsoft Excel as: Kp = {Cb − [Cp·(1 − HCT)]}/HCT/Cp, where HCT is the hematocrit expressed as a fraction, Cb is concentration in blood, and Cp is the concentration in plasma.
Sample Extraction and Concentration for Metabolite Profiling.
Methods were developed to maximize extraction efficiency and concentrate radioactivity from excreta sufficient to allow flow HPLC radiometric quantitation of minor radioactive metabolites. Excreta collections were pooled in proportion to total sample weight. Recoveries were monitored by LSC throughout sample preparation and during HPLC analysis.
Urine.
Thawed urine was pooled, diluted 4- to 5-fold with water, stirred for 30 min to dissolve precipitated radioactivity, and concentrated on C18 solid-phase extraction (SPE) cartridges (Varian Inc., Harbor City, CA). Cartridges were washed sequentially with water and 5% acetonitrile/water, and radioactivity was eluted from the SPE columns with methanol/ammonia (pH 9.0). The eluate was adjusted to pH ∼4 to 5 with acetic acid and concentrated to near-dryness under nitrogen. The concentrate was dissolved in mobile phase (see below) for HPLC analysis.
Feces.
The procedures necessary to obtain good recoveries of radioactivity from feces were tedious. Initial solubilization of radioactivity was difficult, requiring large volumes of diluent. Numerous extraction and concentration strategies using liquid/liquid extraction and/or SPE and/or dialysis failed due to low extraction efficiency or coprecipitation and binding of solubilized radioactivity to solids during the concentration steps. The extraction procedure required careful optimization, with recovery determined at each step.
Fecal homogenates were diluted at least 10-fold with 50 mM acetic acid (pH 3.0) and mixed in a Vortex mixer. To remove fats, each sample was extracted twice with 10 ml of hexane and centrifuged. The hexane extract was verified to be free of radioactivity and discarded. The aqueous phase was diluted with acetonitrile/methanol (3:1 v/v) and centrifuged; these steps were repeated three times. Supernatants were combined and concentrated under vacuum, washed into a vial, and evaporated to near-dryness under nitrogen. The concentrate was redissolved in 1 ml of acetonitrile/methanol (1:1 v/v) with sonication and then diluted with 50 mM ammonium acetate (pH 4.5) with sonication. The extract was washed into a microcentrifuge tube and centrifuged, and the supernatant was analyzed by HPLC.
Bile.
Thawed bile was diluted with 4 volumes of 0.05 M ammonium acetate (pH 4.5) containing d-saccharic 1,4-lactone monohydrate (Aldrich Co., Milwaukee, WI) to prevent hydrolysis of the β-glucuronide conjugate (SN-38G). The solution was shaken for 30 min to dissolve precipitated radioactivity and extracted with an equal volume of hexane to remove precipitated cholesterol. The emulsions were centrifuged, and the hexane layer was removed, found free of radioactivity, and discarded. Samples were diluted with ammonium acetate and extracted again. The aqueous phase was processed by SPE as described for urine, and radioactivity was eluted with acidic methanol (0.1% HCl). The extract was adjusted to pH 4 to 5 with dilute ammonium hydroxide. Samples were evaporated to near-dryness and dissolved in mobile phase (see below) for HPLC analysis.
Plasma.
Plasma samples (0.5 ml, collected 0–4 h) from individual patients were pooled, diluted with an equal amount of water, centrifuged, and applied to Varian SPE columns. Radioactivity was eluted with 4 × 10 ml of pH 4 methanol/acetic acid. The eluent was concentrated to near-dryness and redissolved in the initial mobile phase. Radioactivity was measured before HPLC analysis. Mean extraction recoveries of radioactivity from urine, feces, bile, and plasma were 96 ± 5, 82.6 ± 5.9, 92.0 ± 7.1, and 72 ± 11%, respectively.
Radiometric Methodology.
Radiochromatographic analyses were done with a Perkin Elmer HPLC system, a Waters 474 fluorescence detector, and a Radiomatic Flow-One beta radio-chromatography Series A-500 detector. Fluorescence was monitored at an excitation wavelength of 368 nm and an emission wavelength of 500 nm. Separations were done on a Zorbax SB-CN, 4.6- × 150-mm (5 μ) column (first column), serially connected to a Waters Symmetry C8, 4.6- × 250-mm (5 μ) column, plus guard columns. The mobile phase was a gradient of ammonium acetate buffer (0.05 M, pH 4.50; B) and acetonitrile/methanol (3:1 v/v; A) at a flow rate of 1.0 ml/min. Initial conditions of 25% A and 75% B were held over 0 to 2 min, followed by a linear gradient to 33% A:67% B over 1 min, then held isocratic at 33% A:67% B over 3 to 22 min, followed by a linear gradient to 98% A:2% B over 22 to 23 min, held isocratic at 98% A:2% B over 23 to 30 min, and then re-equilibrated under isocratic starting conditions from 31 to 40 min. Radioactivity recoveries from the HPLC column were quantitative, and quenching effects due to the mobile phase gradient were negligible. The HPLC method described byLokiec et al. (1996) was compared with this method to screen for any coeluting peaks; none were observed.
Metabolite abundance was expressed as percentage of recovered dose. The percentage of dose lost during each sample extraction was quantified. Thereafter, radiochromatograms of each extract were integrated, and each measurable radioactive peak was expressed as the percentage of total radioactive peaks. Peak percentage was converted to percentage of dose based on the amount of radioactivity in the extracted sample and the total sample weight. Data were analyzed with Excel version 5.0c.
HPLC Analysis of Plasma Concentrations of Intact CPT-11 and Its Metabolites.
CPT-11, SN-38, and APC plasma concentrations were determined by validated HPLC methods. Concentrations measured were the sum of lactone and hydroxy acid forms. Aliquots (100-μl) of plasma were mixed with 50 μl of freshly prepared β-glucuronidase (50,000 U/ml), and the mixture was heated at 37°C for 30 min. Proteins were precipitated with 300 μl of acetonitrile, followed by mixing and centrifugation. Supernatant (300 μl) was mixed with 300 μl of 10% glacial acetic acid and incubated at 40°C for 30 min to convert analytes to the lactone form. Aliquots (100-μl) were then chromatographed on an HPLC system consisting of a Brownlee C8 Newguard precolumn (3.2- × 10-mm, 7 μm) and a Zorbax CN (4.6- × 150-mm, 5 μm) analytical column with a mobile phase of acetonitrile/methanol/0.05 M ammonium acetate buffer (pH 4.5, 1.5/1.5/7, v/v/v) at a flow rate of 1.5 ml/min. Two fluorescence detectors (372 nm λex, 535 nm λem to monitor SN-38, and 368 nm λex, 432 nm λem to monitor CPT-11 and APC) were used. Quantitation of concentrations was achieved by inverse prediction from the slope of a best fit with an intercept linear curve with concentration−2weighting determined from fortified plasma calibration standards.
Determination of nonconjugated CPT-11, SN-38, and APC concentrations was done as above, except that 50 μl of water was added to plasma in place of freshly prepared β-glucuronidase enzyme, and the mixture was not heated. All analyte concentrations in plasma were reported as free base or free acid equivalents. The plasma concentration of SN-38G was calculated by subtracting the concentration of nonconjugated SN-38 (denoted as SN-38) from the concentration of total SN-38 (nonconjugated + conjugated SN-38).
For CPT-11, the mean interassay precision of the method between the lower limit of quantitation (LLOQ) (1.4 ng/ml) and the upper limit of quantitation (ULOQ) (1370 ng/ml) was ±4.4%. Mean interassay recovery of quality control (QC) samples was 92 to 109%. For assays of nonconjugated SN-38, the mean interassay precision of the method between the LLOQ (0.464 ng/ml) and the ULOQ (460 ng/ml) was ±5.1%. The mean interassay precision of the system was ±6%. Mean interassay recovery of QC samples was 101 to 111%. In assays for total SN-38, the mean interassay precision of the method between the LLOQ (0.464 ng/ml) and the ULOQ (460 ng/ml) was ±4.9%. Interassay recovery of QC samples was 104 to 112%. For APC, the mean interassay precision of the method between the LLOQ (0.398 ng/ml) and the ULOQ (410 ng/ml) was ±7.5%. Mean interassay recovery of QC samples was 103 to 118%.
Pharmacokinetic Analysis.
Pharmacokinetic parameters for intact CPT-11, SN-38, SN-38G, and APC in plasma and drug-related material in plasma and whole blood were calculated with noncompartmental methods by the Clinical Pharmacokinetics Analysis Package version 1.0 (Pharmacia & Upjohn, Inc., Kalamazoo, MI). Peak concentrations (Cmax) and the corresponding Tmax were determined from individual subject concentration-time curves. Area under the curve (AUC0-T) was determined by trapezoidal approximation. Terminal elimination rate constants (λz) were estimated with least-squares regression of values in the terminal log-linear region of plasma concentration-time curves. Area under the curve from time zero to infinity (AUC0-∞) was estimated by adding AUC0-T and Ct/λz, where Ct is the last detectable plasma concentration and T is the time at which this concentration occurred. Total systemic clearance (CL) of CPT-11 was calculated as dose/AUC0-∞ where the dose of CPT-11 was expressed in free base equivalents (i.e., dose of CPT-11 hydrochloride trihydrate was multiplied by 0.8664, mol. wt. of the anhydrous free base = 586.69, and mol. wt. of the hydrochloride trihydrate = 677.19). The apparent volume of distribution (Vz/F) was calculated as CL/λz. Pharmacokinetic parameters determined for each gender were compared by t test analyses. All statistical tests were performed with the SAS System version 6 (SAS Institute Inc., Cary, NC). A P value of ≤.05 was considered to be statistically significant.
Liquid Chromatography–Mass Spectrometry (LC-MS).
HPLC analyses were performed on a Perkin Elmer Series 200 HPLC system (pump and autoinjector). Mass spectrometry was performed with a tandem quadrupole mass spectrometer (TSQ 7000, Finnigan-MAT, San Jose, CA). The LC-MS interface was an atmospheric pressure ionization source operated in the positive ion electrospray ionization mode. The capillary temperature was 235°C, and the spray voltage was 3.0 kV. The sheath and auxiliary nitrogen gas flows were set to 80 psi and 60 ml/min, respectively. For acquisition of repetitive scanning MS data, the resolution was set to unit (10% valley), and the instrument was scanned from m/z 100 to 1000 every 2 s (MS1, Rf-only; MS2, mass selection). Collision-induced dissociation of MH+ in the source region was accomplished by a 15-V offset. For product ion spectra, Q1 was operated as a high pass filter (m/z 500), and Q3 was scanned from 10 to 1000 every 2 s (argon, 1 mTorr, −30 VElab). Mass spectra of major and minor metabolites and degradation products of CPT-11 are adequately described elsewhere (Rivory and Robert, 1995; Lokiec et al., 1996; Rivory et al., 1996; Dodds et al., 1997, 1998). Ion-monitoring experiments to identify major and minor radioactive metabolites relied on the appearance of the correct protonated molecular ion at an appropriate relative retention time, on the absence of the same ion in identically treated blank (predose) sample matrix, and, when sensitivity permitted, on an appropriate Q2 product ion spectrum (data not shown).
Results
Excretion and Recovery of Total Radioactivity.
The cumulative excretion of radioactivity is summarized in Table2 and illustrated in Figs.2 and 3. The cumulative recovery of radioactivity for 168 to 192 h after dosing was 95.8 ± 2.7% of dose. Fecal excretion was the dominant route of elimination, accounting for 63.7 ± 6.8% of the dose. Urinary excretion accounted for 32.2 ± 6.9% of the dose, with a harmonic mean terminal ARE half-life of 25.4 ± 2.5 h. Figures 2 and 3 show that urinary excretion was almost complete by 48 h. Delayed and variable fecal recoveries were a consequence of sporadic bowel habits in some patients. One female patient with a biliary T-tube excreted 30.1% of dose in bile. The 0- to 8-h postdose ARE half-life of radioactivity in bile was 3.7 h. Higher radioactivity recovery in urine and a shorter urine ARE half-life in this patient (18.9 h) suggest a shift away from biliary elimination.
Summary of cumulative recovery of radioactivity from cancer patients after i.v. administration of [14C]CPT-11

Mean (± S.D.) plot of cumulative excretion of [14C]CPT-11-related radioactivity by matrix for male (patients 1–4) and female (patients 6–8) cancer patients.
Patient 5F was bile-exteriorized and is shown separately in Fig.3.

Plot of cumulative excretion of [14 C]CPT-11-related radioactivity by matrix for bile-exteriorized cancer patient 5F.
Quantitative Metabolite Profiles in Urine, Feces, and Bile.
Radiometric HPLC profiles of urine and feces from a representative patient (1M) are shown in Fig. 4. Comparable radiochromatograms for urine, feces, and bile from the patient with the biliary T-tube (5F) are shown in Fig.5. Overall, in four male and three female patients, 92.2% of dose was profiled, with 3.7% of dose not chosen for profiling due to low relative concentration of radioactivity in excreta collected at later time points. Losses of radioactivity during the extraction and concentration procedures were 11.1% of dose and occurred predominantly from feces (9.86% of dose) as a result of difficult sample preparation. Four major and up to 14 minor radioactive peaks, as well as the parent drug, were quantified.

HPLC-radiochromatograms of excreta extracts from patient 1M.
Top: 0- to 12-h urine concentrate 20.4% of dose, 100% extraction efficiency. Middle: 48- to 72-h feces extract (37.7% of dose, 85.4% extraction efficiency). Bottom: fluorescence HPLC chromatogram showing a mixed analytical standard containing SN-38 glucuronide (∼7.6 min), primary amine metabolite NPC (∼13.2 min), metabolite APC (∼14.7 min), CPT-11 (∼19.5 min), and SN-38 (∼23.5 min). Trace-level radioactive peaks were observed at ∼11.5 min (M7), ∼12.8 min (M8), and ∼14.3 min (M10). Fractions containing the highest possible percentage of dose were chosen to illustrate the overall metabolic disposition of CPT-11.

HPLC radiochromatograms of excreta extracts from bile-exteriorized patient 5F.
Upper trace: 0- to 12-h urine concentrate (31.9% of dose, 93.9% extraction efficiency). Second trace: 24- to 96-h feces extract (13.7% of dose, 80.3% extraction efficiency). Third trace: 2- to 4-h bile concentrate (5.6% of dose, 90.6% extraction efficiency). Lower trace: fluorescence HPLC chromatogram showing a mixed analytical standard containing SN-38 glucuronide (∼7.7 min), primary amine metabolite NPC (∼13.2 min), metabolite APC (∼14.7 min), CPT-11 (∼19.5 min), and SN-38 (∼23.5 min). Trace-level radioactive peaks were observed at 10.0 min (M5), ∼11.5 min (M7), and ∼14.3 min (M10). Fractions giving the highest recovery (urine and feces) or best signal-to-noise ratio (bile) were chosen to illustrate the overall metabolic disposition of CPT-11.
The overall abundance of quantitatively significant metabolites is summarized in Table 3. Major peaks were identified by retention time similarity to synthetic standards of CPT-11, SN-38, SN-38G, APC, and NPC and confirmed by mass spectrometry. CPT-11 was the major excretion product in urine, bile, and feces. APC and SN-38G were the most significant metabolites in urine and bile, but were much less abundant than CPT-11. SN-38 and the primary amine NPC were relatively minor excretion products. The ratio of SN-38 to SN-38G in feces was much higher than that observed in urine and bile, presumably due to in vivo or ex vivo hydrolysis by bacterial β-glucuronidases.
Summary of relative abundance of radioactive metabolites accounting for >1% of dose in urine, feces, and bile
Characterization of Minor Drug-Related Peaks.
Partial characterization of detectable minor metabolites, impurities, and some analytical artifacts is summarized in Table4. Polar peak, M1, was tentatively identified as a quinoline N-oxide of SN-38, based on a strong 393 ion corresponding to SN-38 and an apparent MH+ at m/z 409. SN-38N-oxide is an intermediate used to introduce the phenolic 10-hydroxy group into the camptothecin nucleus during radiosynthesis (Sawada et al., 1991), although metabolic generation of this minor peak cannot be ruled out.
Correlation summary of radiometric HPLC and HPLC MS peaks characterized in human excreta
Extracts were screened for the MH+ 491-, 559-, 561-, 575-, and 603-Da pseudomolecular ions of biotransformation products described by Lokiec et al. (1996). The MH+ 561- (Lokiec metabolite 6) and 559-Da (Lokiec metabolite 5) compounds have also been described as photodegradation products PDP-1 and PDP-2 by Dodds et al. (1997). PDP-2 is a known degradation product in the CPT-11 bulk drug. HPLC-MS of urine revealed ions at m/z 491 [Retention time (Rt) 15.5 min, M13], 559 (Rt 17.8 min, M14) and 561 (Rt 13.5 min, observed by MS only). It is reasonable to speculate that M13 (MH+ 491) may have been formed by metabolism of the PDP-2 impurity (M14) or may have arisen from degradation ex vivo of NPC (M9). Traces of ions corresponding to photodegradation products PDP-3, PDP-4, and PDP-5 (Dodds et al., 1997) were observed in urine extracts at 27.45 min. These ions correlated with trace-level radioactive peak M19.
Four MH+ 603 peaks corresponding to monohydroxylated CPT-11 were observed in bile. The first peak was not detectable in urine and correlated with radioactive peak M8. The other three peaks matched the retention times of MH+603 ions in urine. Radioactive urine metabolites M10 and M12 corresponded in retention time to the first and last of thesem/z 603 peaks; the middle peak eluted under the APC peak.
These peaks are probably related to the MH+ 603 peaks described by Lokiec et al. (1996) as metabolites 3, 7, 8, 9, and 13. Lokiec metabolite 7 is a degradation product present in CPT-11 bulk drug. Similarly, a degradation product, hydroxylated α to the nonbasic piperidine carbamoyl nitrogen, is a trace impurity in CPT-11 bulk drug and may account for either Lokiec metabolite 3 or 9. Nonetheless, we speculate that two of the MH+ 603 metabolites described by Lokiec (8 and 9, based on similar retention time) represent trace-level metabolites arising from hydroxylation of positions 3 or 4 of the outer piperidine ring.
An m/z 605 ion corresponding to M5 represents the hydroxy acid anion of CPT-11 that is formed by lactone hydrolysis. Higher mass aggregate/multiply charged ions such asm/z 908 (3 MH+/2) were formed in the MS source. It is now well established that CPT-11 exists in a pH dependent equilibrium between lactone and hydroxy acid anion forms, with acidic pH favoring the lactone form (Burke and Mi, 1994). Samples were acidified during analysis to convert drug-related materials to the lactone form. Accordingly, M5 was only observed in highly concentrated extracts of excreta.
LC-MS of metabolite M7 revealed no interpretable ions, presumably due to coelution with a band of interferences. Masses were calculated for an array of known piperidine biotransformations (Gole et al., 1987;Masumoto et al., 1990); however, ions at m/z 577, 563, 599, 591, and 601 were not observed.
Radioactivity Profiles in Plasma.
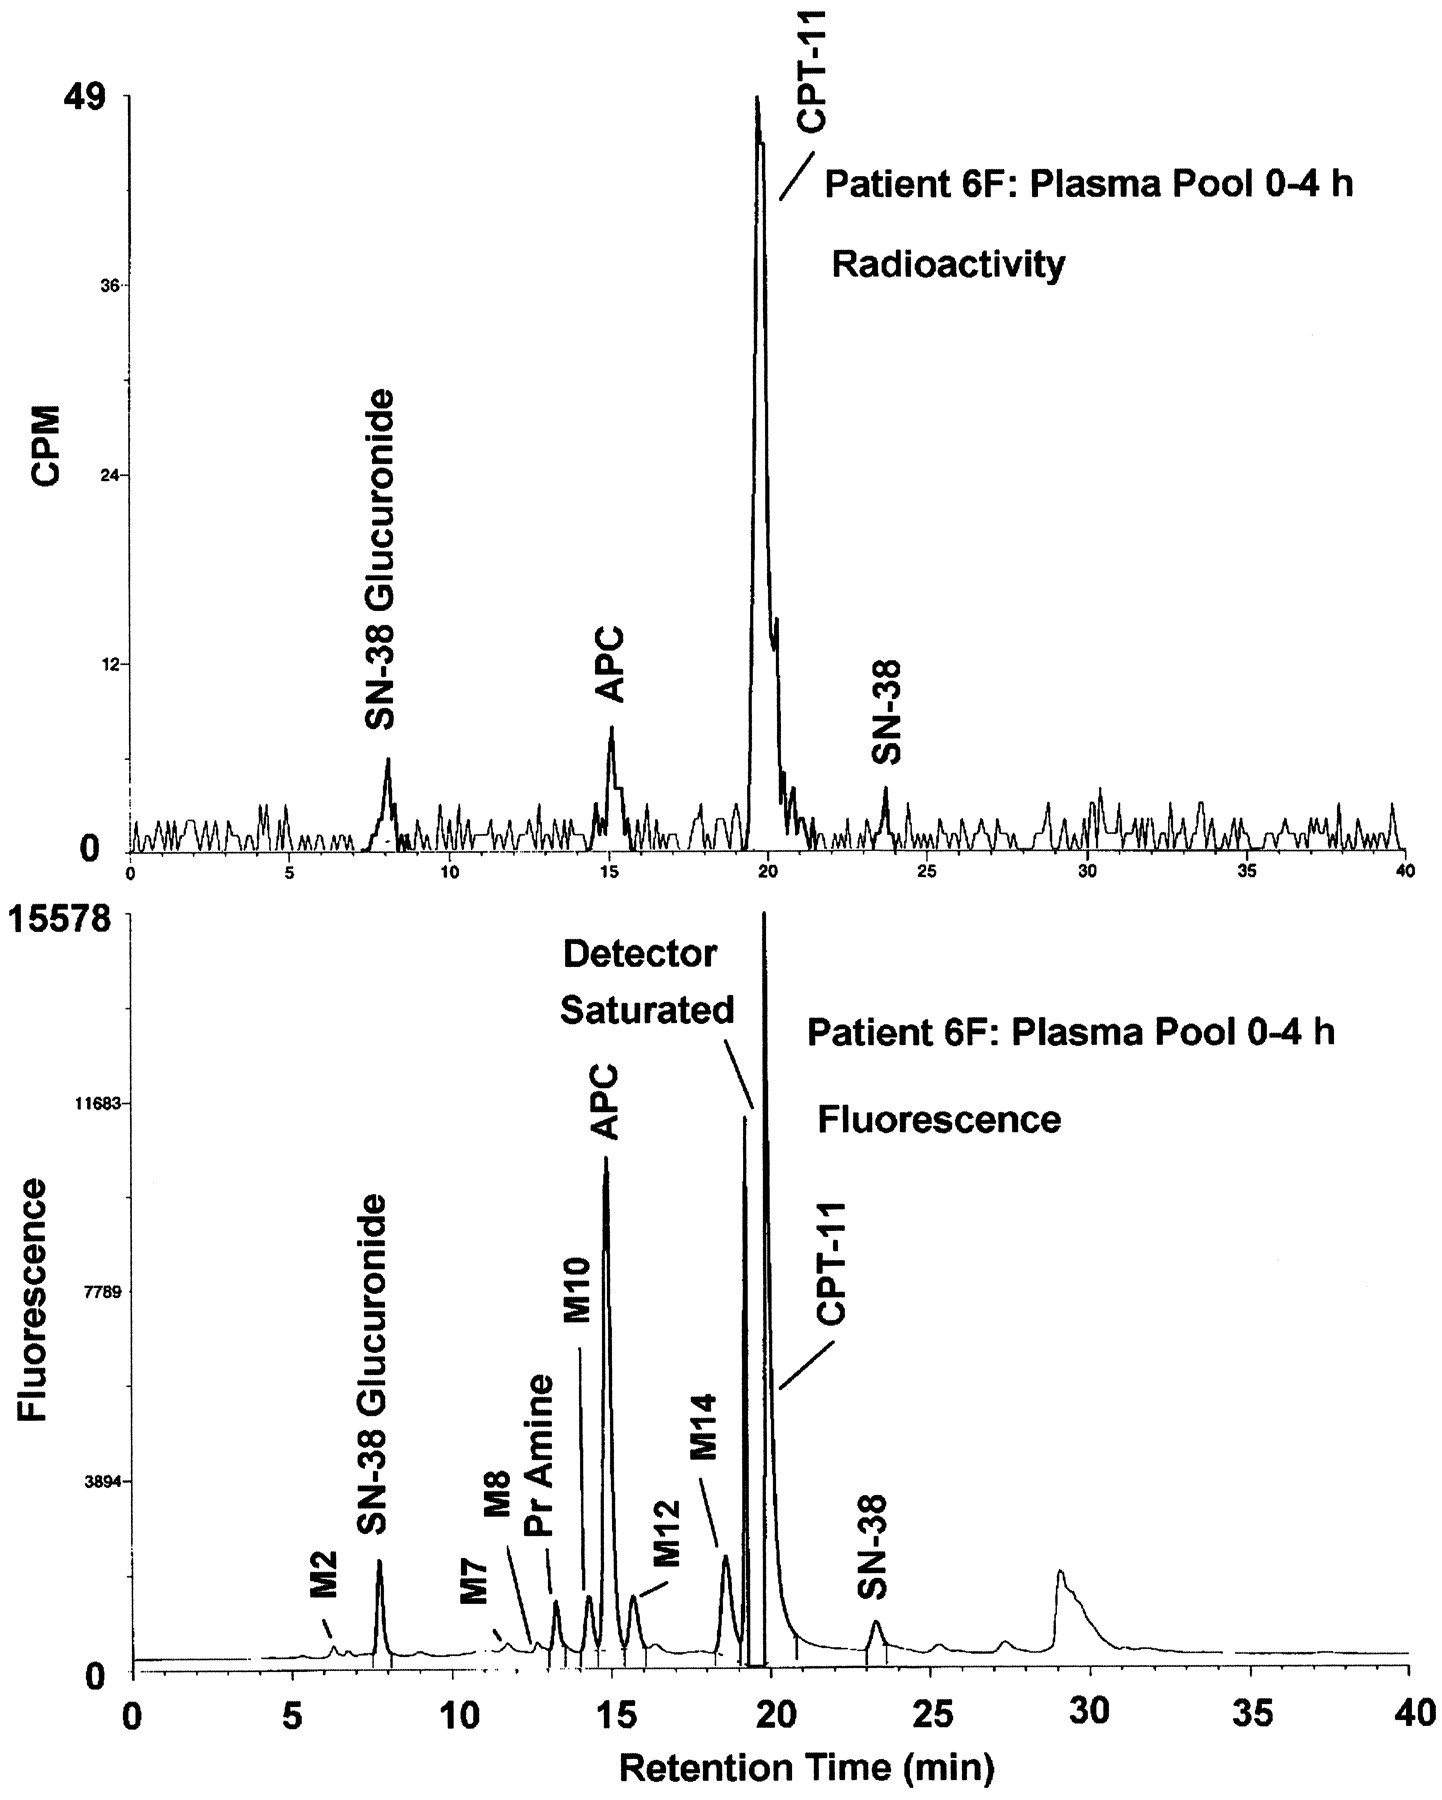
A comparison of radiometric and fluorometric HPLC profiles of pooled plasma (0–4 h) in Fig. 6 demonstrates that CPT-11 was the major circulating radioactive compound in plasma. APC and, to a much lesser extent, SN-38G and SN-38 were the only detectable radioactive metabolites in pooled plasma. NPC and a variety of other minor peaks were only detectable by fluorescence.

Representative HPLC chromatograms of 0- to 4-h pooled plasma extracts from patient 6F.
Top: radiochromatogram showing CPT-11 as the major circulating component. Only traces of metabolite APC and SN-38 glucuronide were detectable radiometrically. Bottom: the corresponding HPLC-fluorescence chromatogram showing trace-level peaks of SN-38 glucuronide (∼7.8 min), primary amine metabolite NPC (∼13.2 min), metabolite APC (∼14.9 min), CPT-11 (∼19.5 min, detector saturated), and SN-38 (∼23.3 min). Trace-level fluorescent peaks were observed at ∼6.2 min (M2), ∼11.8 min (M7), ∼12.7 min (M8), ∼14.3 min (M10), ∼15.6 min (M12), and ∼18.6 min (M14) but were not detectable radiometrically and, therefore, cannot be confirmed to be derived from CPT-11. Fractions containing the highest possible concentrations of radioactivity were chosen for profiling to attain an adequate signal-to-noise ratio for low abundance radioactive peaks.
Pharmacokinetics in Whole Blood and Plasma.
Concentrations of drug-related radioactivity in plasma were similar to those in whole blood. In vivo hematocrit-adjusted blood cell-to-plasma partition coefficient (Kp) values were ∼1, indicating equal partitioning of radioactivity between blood cells and plasma. Mean pharmacokinetic parameters derived for radioactivity in whole blood and plasma and for CPT-11, SN-38, SN-38G, and APC in plasma are summarized in Table5. Plasma concentration versus time plots for drug-related radioactivity, CPT-11, and major circulating metabolites are compared in Fig. 7.
Mean ± S.D. (n = 8) pharmacokinetic parameters determined using [14C]CPT-11-related radioactivity in whole blood and plasma and plasma concentrations of CPT-11, SN-38, SN-38G, and APC determined using fluorescence HPLC
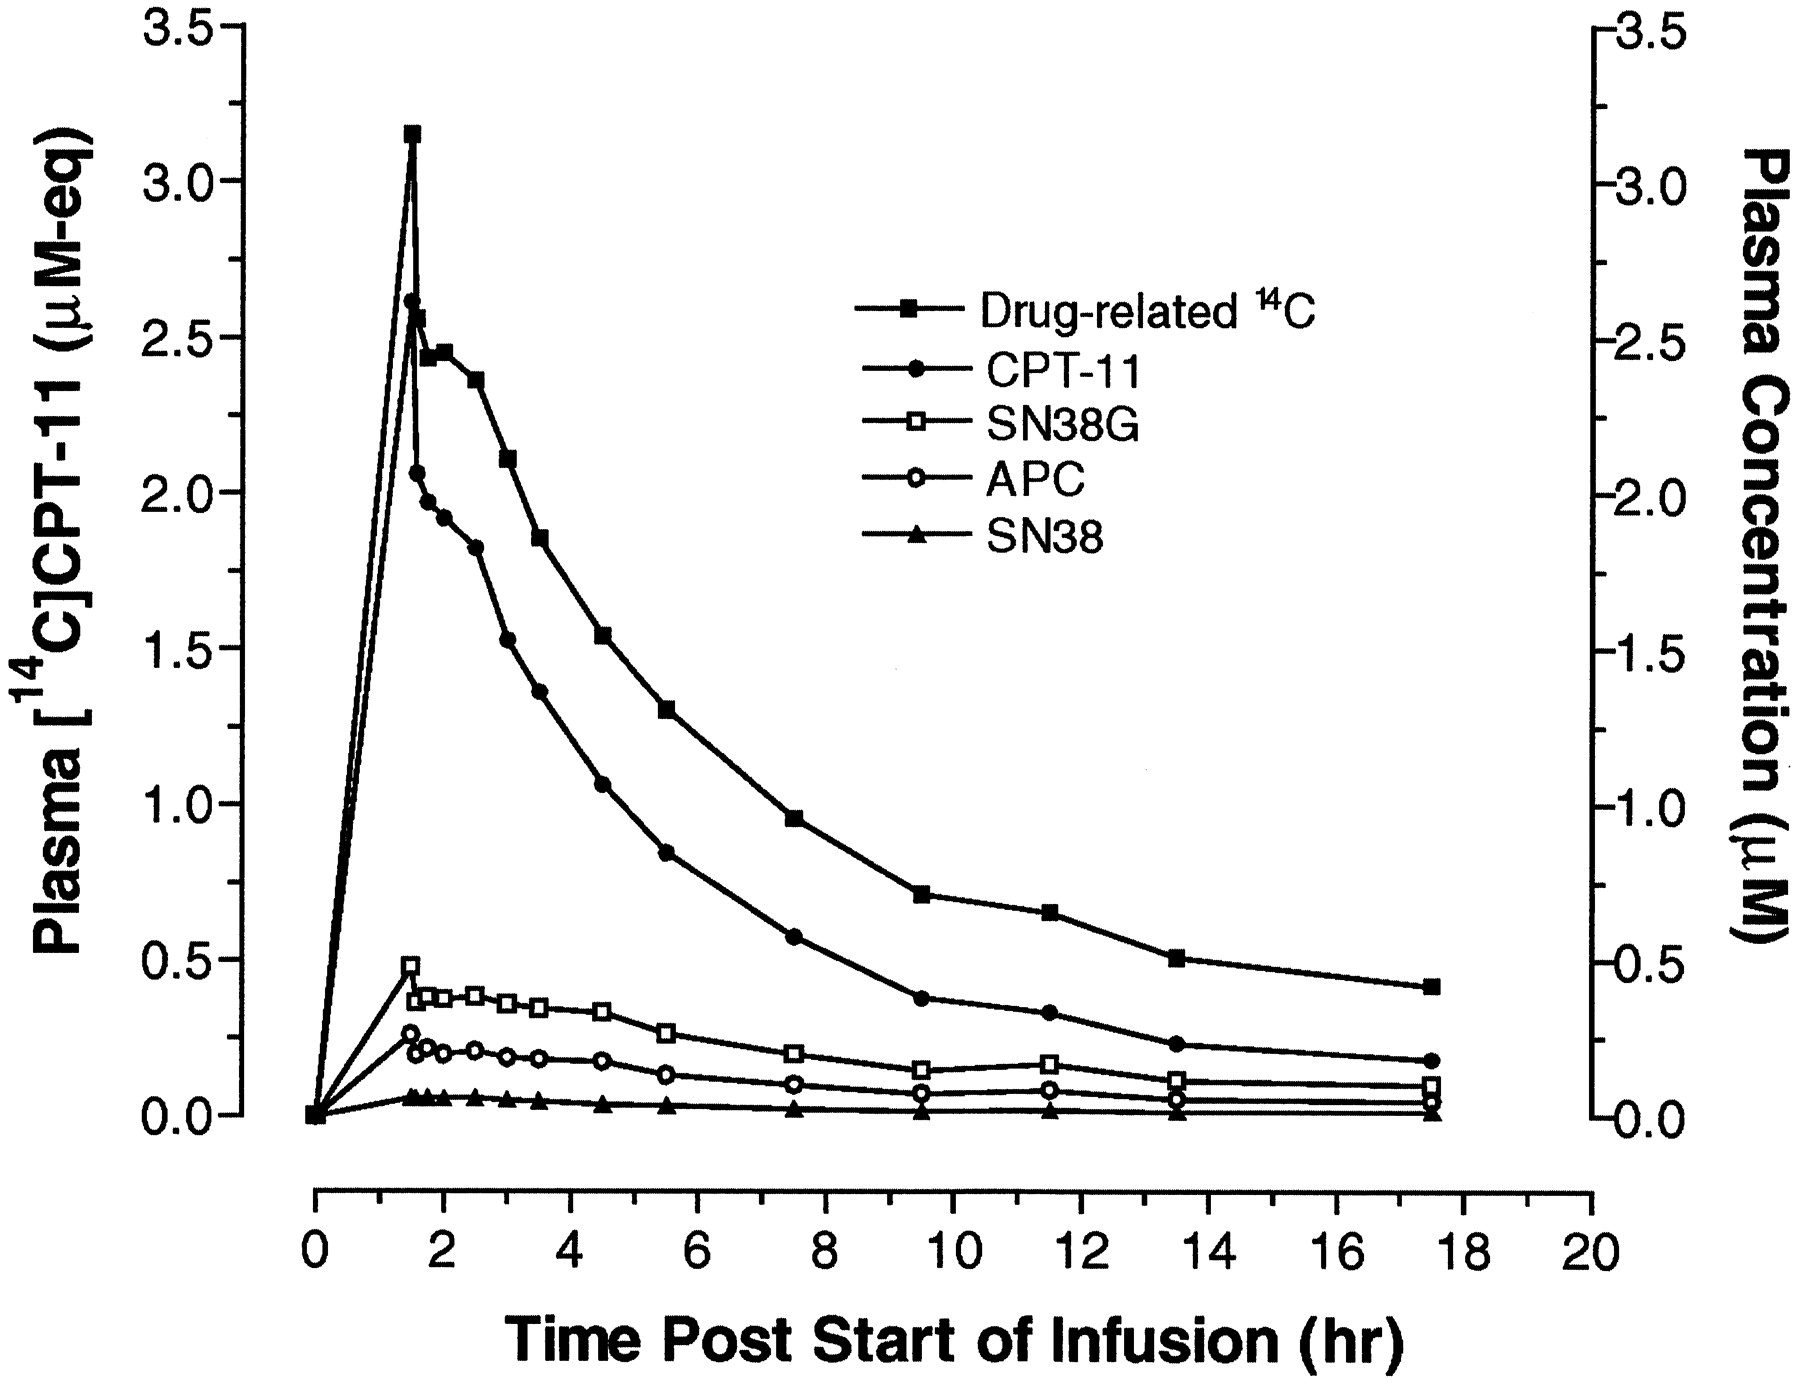
Plot of mean plasma concentrations of [14C]CPT-11-related radioactivity and intact CPT-11, SN-38, SN-38G, and APC after single dose i.v. infusion of CPT-11 to male and female cancer patients.
Whole blood and plasma concentrations of radioactivity peaked at the end of the infusion and were near the limit of quantitation by 24 to 36 h. Whole blood concentrations were generally lower in males, and plasma concentrations were higher in females. Because of intersubject variability, particularly in females, and the small sample size, differences in radioactivity pharmacokinetic parameters were not statistically significant.
Quantitative fluorescence HPLC determination of plasma concentrations of CPT-11, SN-38, SN-38G, and APC showed that CPT-11 was the major circulating component in plasma [55% of the mean radiochemical area under the curve (AUC)]. CPT-11 and the three major metabolites (SN-38, SN-38G, and APC) accounted for 93% of the mean radiochemical AUC.
Plasma concentrations of CPT-11 and the three CPT-11 metabolites, SN-38, SN-38G, and APC, generally appeared to be lower in male subjects compared with females. Because differences in pharmacokinetic parameters between males and females were not statistically significant, mean pharmacokinetic data for all patients are reported in Table 5. Gupta et al. (1997) has previously demonstrated no significant gender-based differences in CPT-11 pharmacokinetics and pharmacodynamics. Mean CPT-11 CL for all patients was 12.4 ± 3.02 l/h/m2. Mean SN-38 AUC0-∞ values represented 4.3 ± 1.8% of the corresponding mean CPT-11 AUC0-∞ values. The plasma concentrations of SN-38G and APC exceeded those of SN-38. When expressed as ng·h/ml, the AUC0-∞ for SN-38G was ∼4-fold higher than SN-38, whereas the AUC0-∞ for APC was ∼7-fold greater. Although plasma concentrations of NPC were not determined, chromatograms demonstrated that the peak corresponding to this metabolite was resolved from APC under the HPLC conditions used for quantitation, and the NPC peak was small relative to that of circulating APC.
Discussion
Near-complete recovery of the radioactive dose was obtained in this study (95.8% of dose). Methods were developed to maximize extraction efficiency before quantitative metabolite profiling. In seven patients, a mean total of 92.2% of dose was quantitatively profiled. This included a loss during extraction of 11.1% of dose, primarily from feces. Our experience during the development of these extraction methods indicates that this loss was nonspecific, and, in our opinion, does not represent an unextracted metabolite.
Other investigators have attempted to quantify CPT-11 and metabolites in urine, bile, and feces with nonradiometric methods (Lokiec et al., 1995; Sparreboom et al., 1998). These studies generally obtained low total recoveries of drug-related materials. During this study, we discovered that there was a significant risk of precipitation of drug-related material in feces, bile, and urine during freezing. This made necessary the appropriate dilution of the specimen to assure dissolution of all drug-related material before SPE. Methods developed to prevent radioactivity losses during extraction and concentration steps were tedious. Optimization of these methods was facilitated by the radiolabel.
Based on parent drug and metabolite mass balance, and considering the well documented effect of lactone hydrolysis on both antineoplastic activity and systemic clearance of camptothecin drugs, we propose that exposure to the active antineoplastic metabolite SN-38 lactone is primarily dependent on the rates of lactone hydrolysis and excretion of CPT-11 (55% of dose). CPT-11 lactone AUC is therefore the primary driver of SN-38 lactone AUC. SN-38 is in turn excreted intact, lactone-hydrolyzed and excreted, or glucuronidated.
Studies in rodents have demonstrated that the activity of canalicular multiple organic anion transporter (cMOAT) is markedly inhibited by the presence of biliary tract obstruction and recovers slowly after restoration of bile flow (Kothe et al., 1993). This may explain the decreased biliary excretion (i.e., sum of recovery in bile and feces) and increased urinary excretion of radioactivity observed in the female patient with the biliary T-tube.
The mean CPT-11 systemic clearance and volume of distribution values determined in these patients (12.4 ± 3.02 l/h/m2 and 297 ± 119 l/m2) are comparable with those reported previously (Rothenberg et al., 1993; Chabot et al., 1995; Chabot, 1997).
The harmonic mean half-lives for CPT-11, SN-38, SN-38G, and APC determined from intact drug and metabolite plasma concentrations were 14.6 h (range 8.6–21.8 h), 28.5 h (range 16.7–54.5 h), 35.5 h (range 30.8–49.9 h), and 17.8 h (range 8.8–34.0 h), respectively. These values are longer than values reported previously (Chabot et al., 1995; Chabot, 1997; Gupta et al., 1997; Rivory et al., 1997). These literature studies used less sensitive methods of detection that were unable to quantify concentrations well into the elimination phase. Thus, some earlier literature analyses may have underestimated the half-lives of CPT-11 and its metabolites. In this study, the half-lives estimated from plasma concentrations determined by fluorescence detection were also longer than those based on radiometric detection. The longer half-lives reflect the higher sensitivity of fluorescence detection relative to radiometric detection. This resulted in a duration of analytical detectability that spanned several half-lives for both the parent drug and the metabolites.
The kinetics of conjugation of the active metabolite SN-38 to afford the inactive metabolite SN-38G has been proposed to be a significant factor in the etiology of CPT-11-induced diarrhea (Gupta et al., 1994). This glucuronide conjugate is a major metabolite of SN-38. Based on the presence of SN-38G in the bile of patient 5F, the low percentage of SN-38 in feces compared with urine can be explained by the action of enteric bacterial β-glucuronidases, although the relative amount of ex vivo versus enteric hydrolysis is not known. The latter process may increase concentrations of SN-38 in the gut lumen.
Several peaks described as metabolites by Lokiec et al. (1996) were observed at trace levels in this study. Many of these were actually impurities present in the bulk drug. Instability of CPT-11 during sample preparation in both this study and Lokiec's study is also possible (Dodds et al., 1997). The observation of these trace-level products serves as a reminder that artifacts may be observed when significant amounts of drug-related material in excreta are concentrated for analysis by sensitive analytical techniques.
Whereas many fluorescent peaks were observed by HPLC, only CPT-11 and three metabolites (SN-38, SN-38G, and APC) individually accounted for greater than 1 to 2% of the dose recovered in excreta. Therefore, in our opinion, NPC, MH+ 603 peaks, and other trace-level metabolites have no clinical or toxicological significance.
In conclusion, near-complete recovery of radioactivity was obtained after i.v. administration of [14C]CPT-11. CPT-11 was the major excretion product, followed by much lower percentages of SN-38G, APC, SN-38, NPC, and an unidentified metabolite M7. All other transiently observed, trace-level radioactive peaks collectively accounted for ∼ 1% of dose. These results show that the parent drug and its three major metabolites (SN-38, SN-38G, and APC) account for virtually all of CPT-11 disposition, with fecal excretion representing the major elimination pathway.
Acknowledgments
We are grateful to study contributors John Easter, Dorothy Wenzel, Dr. Dennis Avery (deceased), Dave Seybert, Barbara Gulotti, Karle Tackwell, and the staff at Pharmacia & Upjohn Clinical Research Unit and West Michigan Cancer Center. We also thank the cancer patients who gave of their valuable time to participate in this study.
Footnotes
-
Send reprint requests to: Dr. J. Greg Slatter, Drug Metabolism Research, Pharmacia & Upjohn Co., 301 Henrietta Street, Kalamazoo MI 49007. E-mail: john.g.slatter{at}am.pnu.com
-
Presented in part at the 35th Annual Meeting of the American Society of Clinical Oncology (ASCO Proceedings), Volume 18, Abstract 633, Page 164a, Atlanta, May 15–18, 1999. Methodological aspects were presented at the 12th Central US Meeting of the International Isotope Society (IIS), Kalamazoo MI, May 20–21, 1999 (J Labelled Compd Radiopharm 1999: 42: 915–916.)
- Abbreviations used are::
- CPT-11
- irinotecan hydrochloride trihydrate
- APC
- aminopentane carboxylic acid metabolite of CPT-11
- ARE
- amount remaining to be excreted
- cMOAT
- canalicular multiple organic anion transporter
- MS
- mass spectrometry
- LC-MS
- liquid chromatography-mass spectrometry
- LSC
- liquid scintillation counting
- NPC
- primary amine metabolite of CPT-11
- SN-38
- active metabolite of CPT-11
- SN-38G
- SN-38 glucuronide
- SPE
- solid-phase extraction
- AUC
- area under the curve
- Rt
- retention time
- QC
- quality control
- CL
- total systemic clearance
- Vz
- terminal phase volume of distribution, LLOQ, lower limit of quantitation
- ULOQ
- upper limit of quantitation
- Received July 23, 1999.
- Accepted December 1, 1999.
- The American Society for Pharmacology and Experimental Therapeutics


