


Abstract
Despite the beneficial effects of tamoxifen in the treatment and prevention of breast cancer, long-term usage of this popular antiestrogen has been linked to an increased risk of developing endometrial cancer in women. One of the suggested pathways leading to the potential toxicity of tamoxifen involves its oxidative metabolism to 4-hydroxytamoxifen, which may be further oxidized to an electrophilic quinone methide. Alternatively, tamoxifen could undergoO-dealkylation to givecis/trans-1,2-diphenyl-1-(4-hydroxyphenyl)-but-1-ene, which is commonly known as metabolite E. Because of its structural similarity to 4-hydroxytamoxifen, metabolite E could also be biotransformed to a quinone methide, which has the potential to alkylate DNA and may contribute to the genotoxic effects of tamoxifen. To further probe the chemical reactivity/toxicity of such an electrophilic species, we have prepared metabolite E quinone methide chemically and enzymatically and examined its reactivity with glutathione (GSH) and DNA. Like 4-hydroxytamoxifen quinone methide, metabolite E quinone methide is quite stable; its half-life under physiological conditions is around 4 h, and its half-life in the presence of GSH is approximately 4 min. However, unlike the unstable GSH adducts of 4-hydroxytamoxifen quinone methide, metabolite E GSH adducts are stable enough to be isolated and characterized by NMR and liquid chromatography/tandem mass spectrometry (LC/MS/MS). Reaction of metabolite E quinone methide with DNA generated exclusively deoxyguanosine adducts, which were characterized by LC/MS/MS. These data suggest that metabolite E has the potential to cause cytotoxicity/genotoxicity through the formation of a quinone methide.
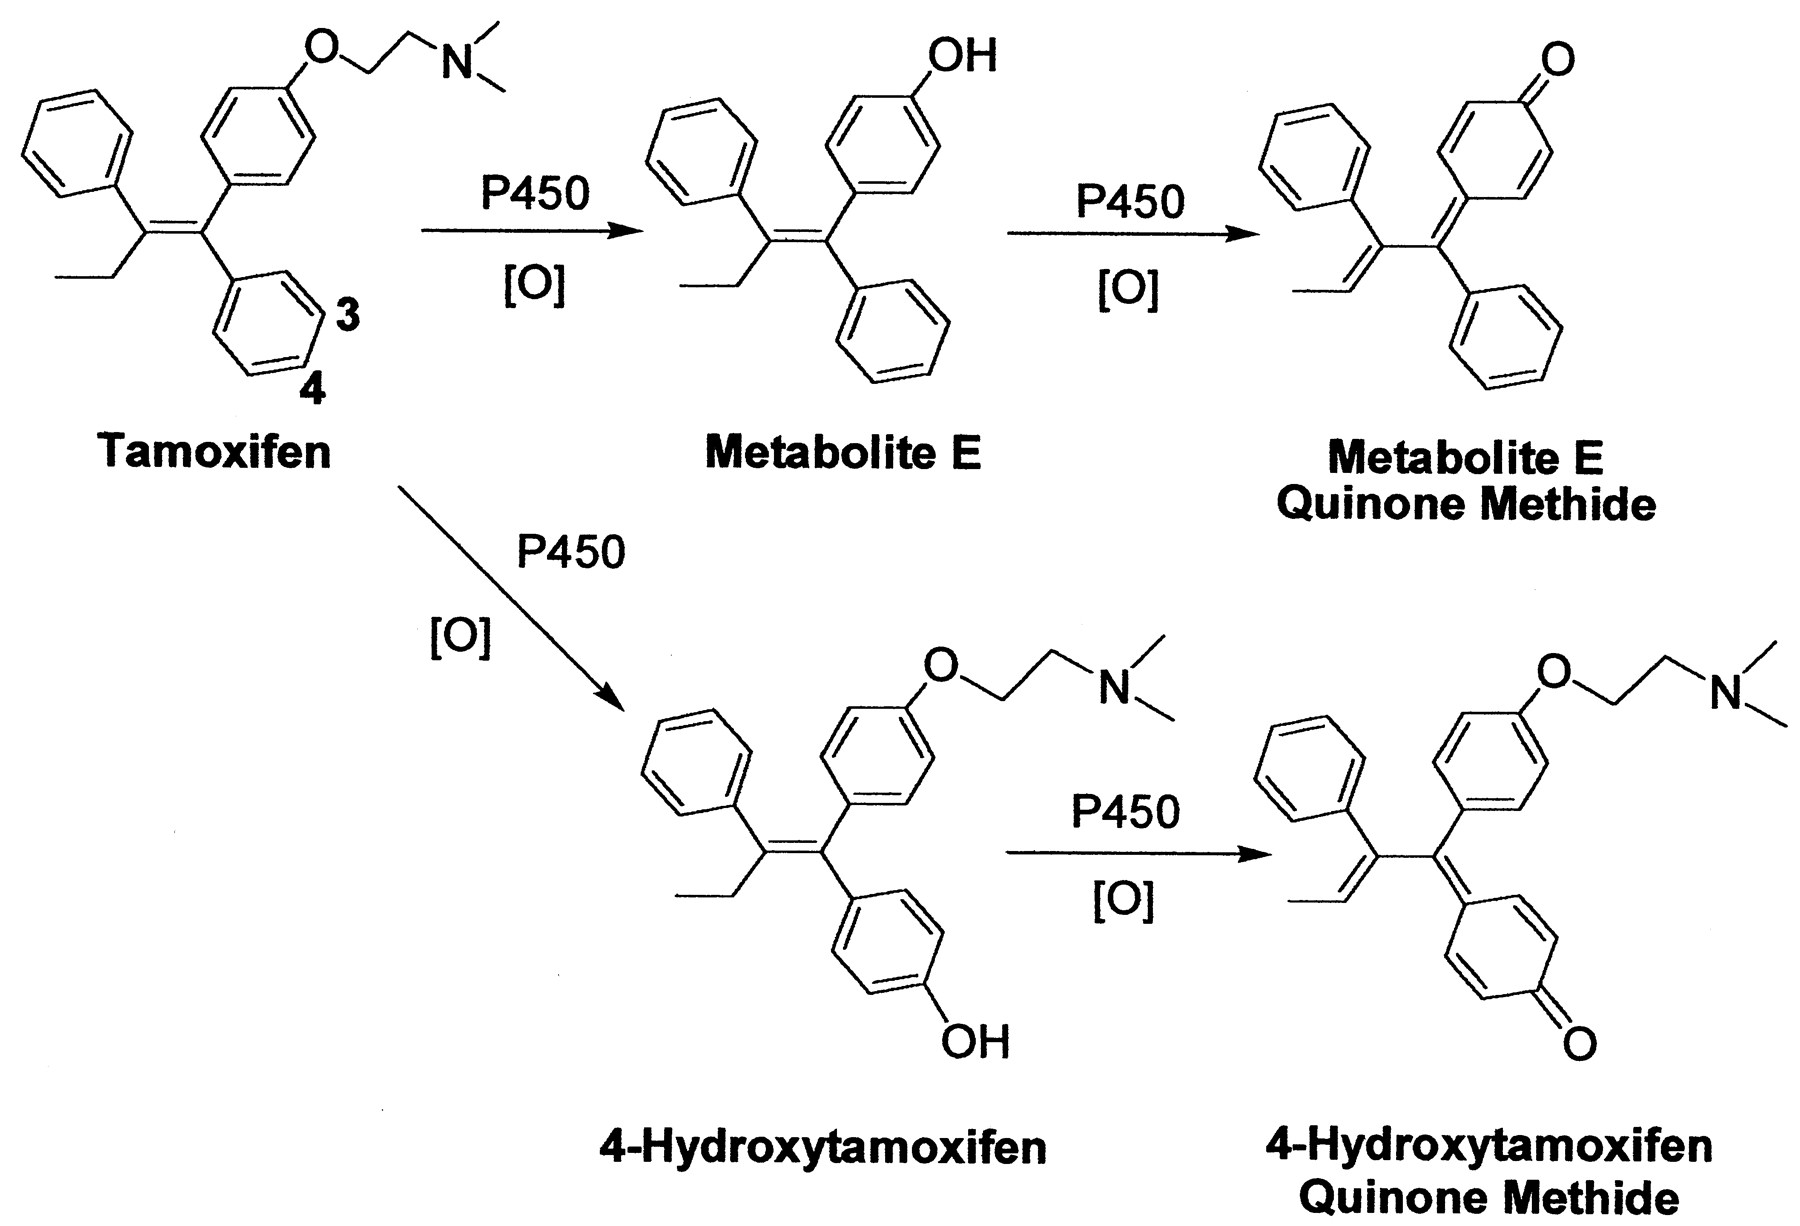
Despite the beneficial effects of tamoxifen in the prevention and treatment of breast cancer, long-term usage of this antiestrogenic drug has been linked to an increased risk of uterine cancer (Andersson et al., 1991;Fisher et al., 1994; van Leeuwen et al., 1994; Rutqvist et al., 1995). Several reports have found that it can also cause hepatocarcinoma in rats (Greaves et al., 1993) and induce DNA adduct formation (Han and Liehr, 1992; White et al., 1992; Randerath et al., 1994). Tamoxifen requires metabolic activation to form DNA or protein adducts (Mani and Kupfer, 1991; Pathak and Bodell, 1994). Upon bioactivation, at least three types of reactive intermediates can be generated, including a carbocation (Phillips et al., 1994a,b), o-quinone (Dehal and Kupfer, 1996), and quinone methide (Moorthy et al., 1996). The formation of a quinone methide may come from the oxidation of 4-hydroxytamoxifen in the presence of cytochrome P450 (Fig. 1) (Marques and Beland, 1997; Beland et al., 1999; Fan et al., 2000). Alternatively, an additional quinone methide may be generated from the oxidation of metabolite E,1 which is anO-dealkylated metabolite found in the plasma of patients treated with tamoxifen (Murphy et al., 1987; Wiebe et al., 1992).

Biotransformation of tamoxifen to metabolite E quinone methide and 4-hydroxytamoxifen quinone methide.
Unlike tamoxifen, metabolite E is estrogenic (Jordan, 1982). Although estrogens have been linked to the development of hormone-dependent cancer (Henderson et al., 1988), there is an interest in these compounds acting as chemical carcinogens by binding to cellular macromolecules. Metabolite E has been shown to alkylate DNA (Pongracz et al., 1995; Pathak et al., 1996), a reaction mechanism likely involving the formation of a quinone methide intermediate. However, the structures of these DNA adducts have not been elucidated. Furthermore, very little is known about the reactivity, rate of formation, and other potential biological targets of metabolite E quinone methide. To further probe the chemical reactivity and toxicity of this electrophile, it was synthesized chemically and enzymatically and reacted with GSH. Its half-life in solution and reactivity with GSH were also quantified, and the GSH conjugates of metabolite E were isolated and characterized. Our experiments showed that the reaction between metabolite E quinone methide and DNA gave exclusively deoxyguanosine adducts. Furthermore, microsomal incubations with tamoxifen generated a detectable amount of metabolite E, indicating that its formation may contribute to the potential carcinogenicity exhibited by tamoxifen.
Materials and Methods
Caution.
The quinone methides were handled in accordance with the National Institutes of Health Guidelines for the Laboratory Use of Chemical Carcinogens (1981).
Chemicals.
Salmon testes DNA and bis[2-hydroxyethyl]iminotris[hydroxymethyl]methane (Bis-Tris) were purchased from Sigma (St. Louis, MO). All chemicals were purchased from Aldrich (Milwaukee, WI) or Fisher Scientific (Itasca, IL) unless stated otherwise. [3H]GSH (glycine-2-3H) was obtained from New Life Science Products (Boston, MA) and diluted to a specific activity of 100 nCi/nmol. Metabolite E was synthesized as described previously (Pongracz et al., 1995), and its quinone methide was prepared according to literature procedures (Marques and Beland, 1997; Fan et al., 2000).
HPLC Methodology.
Four general methods were used to analyze and separate the GSH conjugates and deoxynucleoside adducts. Method A was developed for analytical separation of metabolite E-GSH conjugates, Method B for semipreparative scale separation of these conjugates, Method C for analytical separation of metabolite E-deoxynucleoside adducts, and Method D for analytical separation of tamoxifen and metabolite E. All retention times for GSH conjugates were reported based on Method A. For DNA adducts, retention times were reported based on Method C. For the detection of metabolite E in tamoxifen metabolism experiment, retention times were reported based on Method D.
Method A.
Analytical LC/MS analysis was performed using a Beckman 4.6- × 150-mm Ultrasphere C18 column (Torrance, CA) on a Hewlett Packard (Palo Alto, CA) 1090L gradient HPLC equipped with a photodiode array UV/visible absorbance detector set at 230 to 450 nm and a 5989 B MS Engine quadruple mass spectrometer. The mobile phase consisted of 30% methanol in 0.5% acetic acid (pH 3.5) at a flow rate of 1.0 ml/min for 5 min, increased to 45% CH3OH over 1 min, then to 60% over the next 39 min, and finally to 95% CH3OH over the last 5 min.
Method B.
For isolation of GSH conjugates, a semipreparative method was developed using a 10- × 250-mm Ultrasphere C18 column (Beckman) on a Shimadzu LC-10A gradient HPLC system equipped with a SIL-10A auto injector, and a SPD-10AV UV detector set at 240 nm. The mobile phase consisted of 55% methanol in 0.25% perchloric acid/0.25% acetic acid (pH 3.5) at a flow rate of 2.5 ml/min for 5 min, increased to 70% over the next 40 min, and finally to 95% CH3OH over the last 5 min.
Method C.
Similar analytical LC/MS conditions were used to separate metabolite E-DNA adducts, except the mobile phase consisted of 25% acetonitrile in 0.5% acetic acid (pH 3.5) at a flow rate of 1.0 ml/min for 1 min, increased to 60% acetonitrile over 44 min, and to 95% over the next 5 min.
Method D.
Another analytical LC/MS separation was developed for the separation of tamoxifen and metabolite E. The conditions were the same as Methods A and C, except the mobile phase consisted of 40% acetonitrile in 0.5% acetic acid (pH 3.5) at a flow rate of 1.0 ml/min for 1 min, increased to 60% acetonitrile over 44 min, and to 95% over the next 5 min.
Kinetic Experiments.
The disappearance of metabolite E quinone methide (0.04 mM) in 50 mM K2HPO4 buffer (1 ml, pH 7.4, 37°C) was followed by monitoring the decrease in UV absorbance at 375 nm (10 min/scan) using a Hewlett Packard 8452A diode array spectrophotometer. The disappearance of metabolite E quinone methide (0.14 mM) in the presence of GSH (10 mM) in phosphate buffer (50 mM, pH 7.4) was followed by monitoring the decrease in absorbance at 375 nm (30 s/scan) at 37°C. Pseudo first order rate constants were determined in triplicate for at least six half-lives (Table1).
Conversion of metabolite E and 4-hydroxytamoxifen to the quinone methide-GSH conjugates by rat liver microsomes1-a
GSH Conjugates of Metabolite E Quinone Methides.
GSH conjugates of metabolite E quinone methide were prepared by incubating the quinone methide (20 mg in 1.5 ml of acetone) with 10 mM GSH in 100 ml of K2HPO4buffer (50 mM, pH 7.4) at 37°C for 30 min. The reaction was terminated by extracting the aqueous solution with 4 × 50 ml of ether to remove unreacted quinone methide. GSH adducts were isolated from the aqueous phase on PrepSep C18 extraction cartridges (Fisher Scientific, Fair Lawn, NJ) and eluted with methanol. The methanol was concentrated and the mixture was separated by semipreparative HPLC (Method B). Four GSH-dependent peaks were isolated and characterized. Metabolite E-SG1 : UV (CH3OH) 240 nm, 280 nm; 1H NMR (CD3OD) δ 1.10 (d, 3H, J = 7.2 Hz, CH 3), 1.94 (m, 2H, Glu-β), 2.45 (m, 2H, Glu-γ), 2.81 (m, 1H, Cys-β), 3.55 (m, 1H, Glu-α), 4.14 (m, 1H, Cys-α), 4.28 (d, 2H, Gly), 4.70 (q, 1H, CH-CH3), 6.39 (d, 2H,J = 8.8 Hz, H-3,5 of CH6CH4O), 6.74 (d, 2H,J = 8.8 Hz, H-2,6 of CH6CH4O), 7.15 to 7.40 (m, 10H, ArH); positive ion electrospray tandem mass spectrometry (MS/MS), m/z 606 (80%) (MH+), 299 (100%) (MH+ − GSH), retention time 33 min. Metabolite E-SG2 : UV (CH3OH) 240 nm, 280 nm; 1H NMR (CD3OD) δ 1.13 (d, 3H, CH 3), 2.17 (m, 2H, Glu-β), 2.53 (m, 2H, Glu-γ), 2.67 (m, 1H, Cys-β), 3.09 (m, 1H, Glu-α), 3.50 (m, 1H, Cys-α), 4.28 (d, 2H, Gly), 4.30 (q, 1H, CH-CH3), 6.39 (d, 2H,J = 8.8 Hz, H-3,5 of CH6CH4O), 6.74 (d, 2H,J = 8.8 Hz, H-2,6 of CH6CH4O), 7.15 to 7.40 (m, 10H, ArH); positive ion electrospray MS/MS,m/z 606 (48%) (MH+), 299 (100%) (MH+ − GSH), retention time 38 min. Metabolite E-SG3 : UV (CH3OH) 240, 280 nm; 1H NMR (CD3OD) 1.11 (d, 3H, J = 6.9 Hz, CH 3), 2.15 (m, 2H, Glu-β), 2.50 (m, 2H, Glu-γ), 2.85 (m, 1H, Cys-β), 3.10 (m, 1H, Glu-α), 4.21 (m, 1H, Cys-α), 4.58 (d, 2H, Gly), 4.80 (q, 1H, -CHCH3), 6.80 (d, 2H,J = 8.4 Hz, H-3,5 of CH6CH4O), 6.90 to 7.40 (m, 12H, ArH); positive ion electrospray MS/MS,m/z 606 (1%) (MH+), 299 (100%) (MH+ − GSH), retention time 47 min. Metabolite E-SG4 : UV (CH3OH) 240, 280 nm; 1H NMR (CD3OD) 1.06 (d, 3H, J = 6.8 Hz, CH 3), 1.91 (m, 2H, Glu-β) 2.33 (m, 2H, Glu-γ), 2.80 (m, 1H, Cys-β), 3.08 (m, 1H, Glu-α), 4.10 (m, 1H, Cys-α), 4.18 (d, 2H, Gly), 4.20 (q, 1H, -CHCH3), 6.78 (d, 2H,J = 8.1 Hz, H-3,5 of CH6CH4O), 6.90 to 7.40 (m, 12H, ArH); positive ion electrospray MS/MS,m/z 606 (1%) (MH+), 299 (100%) (MH+ − GSH), retention time 48 min.
Reaction of Metabolite E Quinone Methide with DNA.
DNA was treated with metabolite E quinone methide and precipitated as described in the literature (Marques and Beland, 1997). Briefly, metabolite E (20 mg) was dissolved in 5 ml of acetone, cooled to 0°C, and oxidized by adding freshly prepared manganese dioxide (200 mg). The oxidant was removed by centrifugation after 1 h of reaction. The solution containing the quinone methide was concentrated to approximately one half volume under nitrogen and added to 10 ml of a salmon testes DNA (1 mg/ml) solution in 5 mM Bis-Tris, 0.1 mM EDTA, pH 7.1. The mixture was protected from light and incubated overnight at 37°C. The aqueous solution was extracted with diethyl ether (5 × 10 ml) to remove unreacted quinone methide. The DNA was precipitated by addition of 5 M NaCl (1 ml) and ice-cold absolute ethanol (20 ml), washed twice with 70% ethanol, and redissolved in 5 mM Bis-Tris, 0.1 mM EDTA, pH 7.1, at a concentration of 1 mg/ml.
Isolation of the DNA Adducts.
The modified DNA was hydrolyzed to nucleosides by denaturing DNA (1 mg) in boiling water for 2 min. The solution was cooled in an ice bath and diluted with 4 ml of 30 mM sodium acetate (pH 5.3), 20 mM zinc sulfate (0.5 ml) and incubated with nuclease P1 (Sigma; 80 units/mg of DNA) and alkaline phosphatase (Sigma; 60 units/mg of DNA) for 3 h at 37°C. The pH was adjusted to 8.5 using 0.5 M Tris buffer, and the solution was incubated for an additional 3 h at 37°C. The solution was extracted using solid phase extraction cartridges, eluted with methanol, and concentrated to a final volume of 100 μl. An aliquot (25 μl) was analyzed directly by LC/MS (Method C). Four deoxyguanosine adducts were detected. No adducts were detected with deoxyadenosine, deoxycytosine, or thymidine after enzyme digestion. Metabolites E-dG1 and 2 (unresolved) : positive ion electrospray MS/MS, m/z 566 (5%) (MH+), 450 (50%) (MH+ − deoxyribose), 299 (100%) (MH+ − dG), retention time 13 min. Metabolite E-dG3 : positive ion electrospray MS/MS, m/z 566 (1%) (MH+), 450 (20%) (MH+ − deoxyribose), 299 (100%) (MH+ − dG), retention time 16 min. Metabolite E-dG4 : positive ion electrospray MS/MSm/z 566 (5%) (MH+), 450 (25%) (MH+ − deoxyribose), 299 (100%) (MH+ − dG), retention time 17 min.
Incubations.
Female Sprague-Dawley rats (180–200 g) were obtained from Sasco Inc. (Omaha, NE). The rats were pretreated with dexamethasone to induce P450 3A isozymes (Okey, 1990). They were given 100 mg/kg body weight dexamethasone in corn oil i.p. for 3 days and sacrificed on day 4. Protein and P450 concentrations of the liver microsomes were determined as described previously (Thompson et al., 1987). Incubations containing microsomal protein (1 nmol of P450/ml) were conducted for 15 min at 37°C in 50 mM phosphate buffer (pH 7.4, 0.5-ml total volume). Metabolite E was added as a solution in dimethyl sulfoxide, and [3H]GSH (specific activity, 40 nCi/nmol) was added in phosphate buffer, to achieve final concentrations of 0.1 and 2.5 mM, respectively. An NADPH-generating system consisting of 1 mM NADP+, 5 mM isocitric acid, and 0.2 unit/ml isocitric acid dehydrogenase was used together with 5.0 mM MgCl2. For control incubations, NADP+ was omitted. The reactions were initiated by the addition of NADP+ and terminated by chilling in an ice bath followed by the addition of perchloric acid (25 μl).
Adduct Quantification.
The incubates were centrifuged at 13,000 rpm for 5 min to precipitate microsomal protein. Aliquots of the supernatant (100 μl) were analyzed directly by HPLC (Method A). For quantification of GSH conjugates, 0.3-ml aliquots of the column effluent were collected during each run, 4 ml of scintillation fluid was added, and radioactivity was measured with a Beckman model LS 5801 liquid scintillation counter. Concentrations of the GSH conjugates were calculated by summing the radioactivity associated with each peak and converting the data to nanomolar amounts using the specific activity of the [3H]GSH (Table 1).
Detection of Metabolite E in Microsomal Incubation with Tamoxifen.
In another set of experiments, tamoxifen (Sigma) was incubated with rat liver microsomes using the same incubation conditions as described above. A larger incubation volume (10 ml total) was used to obtain sufficient material for LC/MS analysis. The solution was extracted using solid phase extraction cartridges, eluted with methanol, and concentrated to a final volume of 100 μl, and an aliquot (25 μl) was analyzed by electrospray LC/MS (Method A). In control experiments, NADP+ was omitted.
Instrumentation.
HPLC experiments were performed on a Shimadzu LC-10A gradient HPLC equipped with a SIL-10A auto injector, SPD-M10AV UV/visible photodiode array detector, and SPD-10AV detector. Peaks were integrated with Shimadzu EZ-Chrom software and a Gateway E-4200 computer. UV spectra were measured on the above-mentioned Hewlett Packard UV/visible spectrophotometer. 1H NMR spectra were obtained with a Bruker Avance DPX300 spectrometer at 300 MHz. Positive ion electrospray mass spectra were obtained using a Hewlett Packard 5989B MS Engine quadrupole mass spectrometer equipped with a ChemStation data system and high-flow pneumatic nebulizer-assisted electrospray LC/MS interface. The mass spectrometer was interfaced to the above-mentioned Hewlett Packard gradient HPLC system. The quadrupole analyzer was maintained at 120°C, and unit resolution was used for all measurements. Nitrogen at a pressure of 80 psi was used for nebulization of the HPLC effluent, and nitrogen bath gas at 300°C and a flow rate of 10 l/min were used for evaporation of solvent from the electrospray. A mass range from 100 to 1000 mass units was scanned every 1.5 s. MS/MS spectra were obtained using a Micromass (Manchester, UK) Quattro II triple quadrupole mass spectrometer equipped with an electrospray ionization source. Collision-induced dissociation was carried out using a range of collision energy from 25 to 70 eV and argon collision gas pressure of 2.7 μbar.
Results and Discussion
Reactivity of Metabolite E Quinone Methide.
We have previously demonstrated that the quinone methide formed from 4-hydroxytamoxifen is unusually stable (Fan et al., 2000). Its stability is likely due to the extensive resonance stabilization to the overall resonance hybrid of the quinone methide. Therefore, because of the extended π conjugation in metabolite E, its quinone methide should also exhibit a similar stability. The quinone methide generated from metabolite E has a half-life of 231 min under physiological conditions, and its half-life in the presence of excess GSH was 3.9 min. As expected, its half-lives were similar to that of 4-hydroxytamoxifen quinone methide; the half-lives of 4-hydroxytamoxifen quinone methide are 174 min under physiological conditions and 3.9 min in the presence of excess GSH (Fan et al., 2000).
GSH Conjugates of Metabolite E Quinone Methide.
When GSH was reacted with metabolite E quinone methide, four reaction products were isolated by HPLC (Fig. 2). All products have similar UV absorbance and MS/MS fragmentation patterns. With the use of positive ion electrospray-mass spectroscopy, the parent ions of all four products exhibited atm/z 606 (Fig. 3), identifying the molecular mass as 605 Da. This molecular ion gave a daughter ion at m/z 299, which represents (MH+ − GSH). A molecular ion atm/z 308 was also observed, which was the protonated GSH fragmenting from the parent ion atm/z 606. These data suggest that the four products are diastereomeric GSH adducts of metabolite E quinone methide.

A, HPLC chromatogram (Method A) of the reaction of metabolite E quinone methide (generated chemically) with GSH; and B, reconstructed radiochromatogram of the incubation of metabolite E with [3H]GSH in rat liver microsomes.

Product ion spectrum of m/z 606 (MH+) of metabolite E-GSH conjugate.
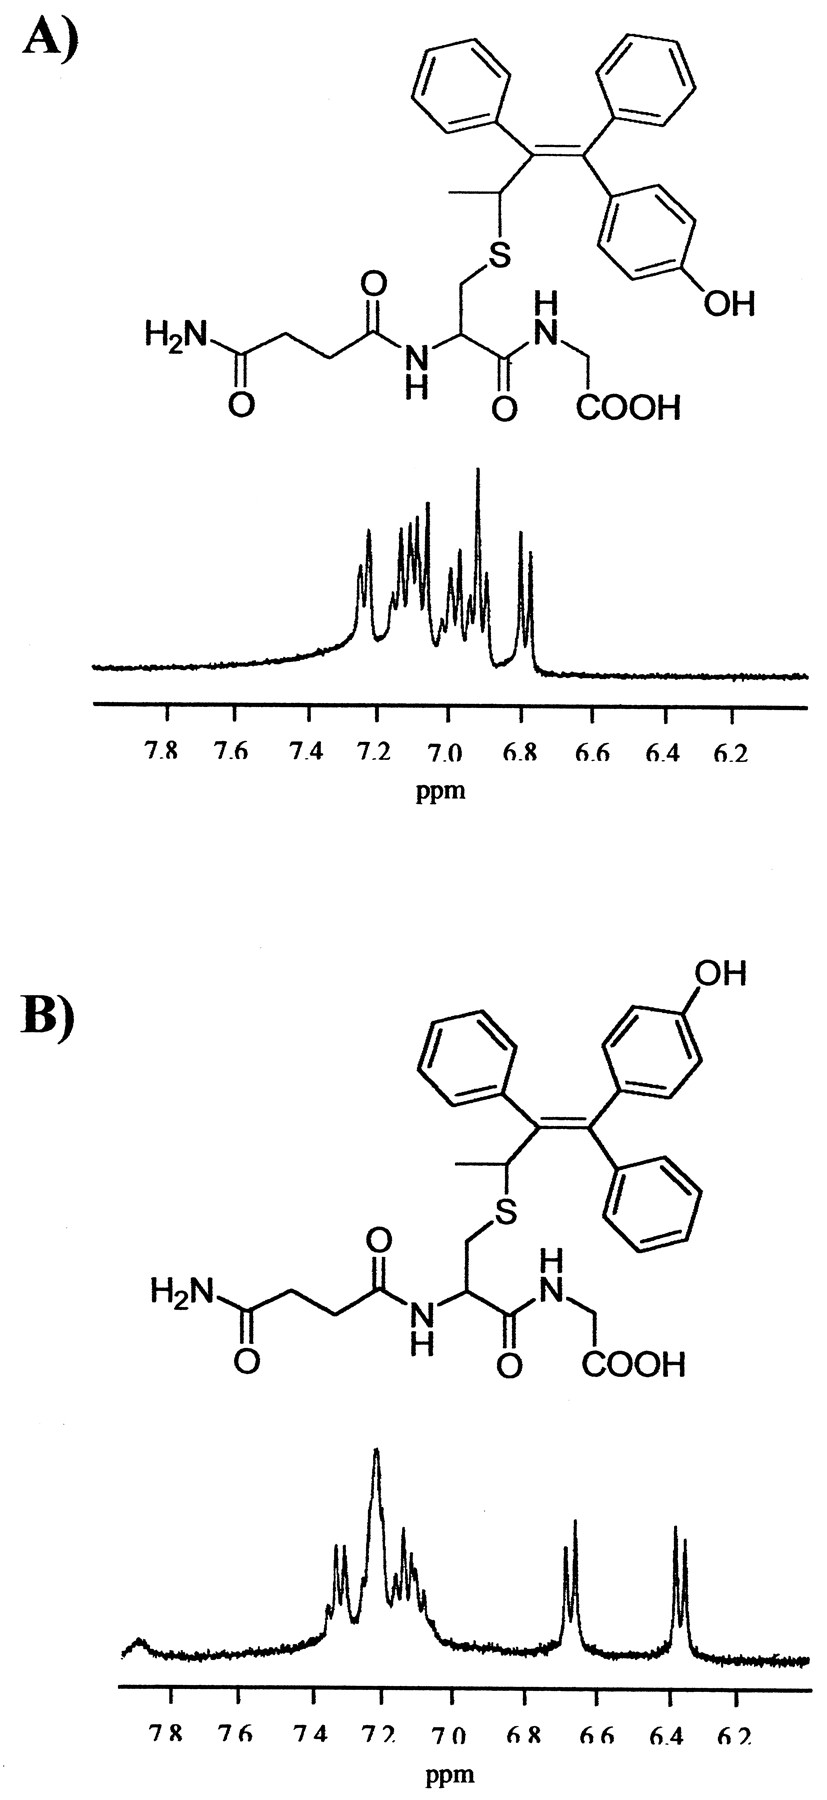
The structure of each of the isomers of metabolite E-GSH adducts were determined by comparison with the NMR data of GSH andcis/trans-metabolite E. Furthermore, the assignment of cis- or trans-configurations was based on the 1H NMR peaks assignment of dG-tamoxifen adducts (Dasaradhi and Shibutani, 1997). The aromatic region of cis- and trans-metabolite E-GSH adducts showed a remarkable similarity to that of cis- andtrans-dG-tamoxifen (Fig. 4). The two doublet signals in both ME-SG1 and ME-SG2 at δ 6.39 and 6.74 correspond to protons 3,5 and 2,6 on the phenoxy ring, indicating that metabolite E is the trans-form. In contrast, the two doublet signals in both ME-SG3 and ME-SG4 were shifted to δ 7.02 and 7.25, indicative of the cis-form. Essential information regarding the site of attachment of metabolite E to GSH was provided by the absence of typical splitting pattern of the ethyl group of metabolite E, i.e., a triplet for the methyl group and a quartet for the methylene group. The ethyl signals were replaced by a methyl doublet at δ 1.10, which was coupled to a quartet at δ 4.70 (ME-SG1 was used as an example; other isomers also showed a similar splitting pattern). Thus, ME-SG1 and ME-SG2 were identified as the epimers oftrans-form of metabolite E-GSH adduct, and ME-SG3 and ME-SG4 were identified as the epimers of cis-form of metabolite E-GSH adduct. Interestingly, the cis-isomer predominated over the trans- by a ratio of 5:1 (Fig. 2). This is unusual since most tamoxifen-deoxyguanosine adducts generated from either α-sulfate tamoxifen (Dasaradhi and Shibutani, 1997) or 4-hydroxytamoxifen quinone methide (Marques and Beland, 1997) gave an equal mixture of cis/trans-isomers.

1H NMR spectra of the aromatic regions of cis/trans-metabolite E-GSH conjugates.
A, cis-form of metabolite E-GSH conjugate (fraction 3). B, trans-form of metabolite E-GSH conjugate (fraction 2).
Analysis of Metabolite E DNA adducts.
Salmon testis DNA was reacted with metabolite E quinone methide and digested enzymatically, and the hydrolysate was analyzed by LC/MS and LC/MS/MS. Results showed that only deoxyguanosine can form adducts with the quinone methide under physiological conditions. Four adducts were detected, although the yields were very low. Because of the low yields, it was not possible to obtain sufficient quantities of these adducts for NMR characterization. Therefore, we incubated the quinone methide directly with deoxyguanosine and other deoxynucleosides for large scale isolation. However, no adducts were detected, indicating that DNA is more reactive toward metabolite E quinone methide than individual DNA bases (see Discussion below). Consequently, their structures could not be unambiguously determined. However, on the basis of previous work with 4-hydroxytamoxifen quinone methide (Marques and Beland, 1997), the α position of metabolite E is probably the site of deoxyguanosine attachment. In addition, theN 2 position of guanine is most likely the site of modification. MS/MS experiments with the deoxyguanosine adducts are consistent with the structure proposed in Fig.5. The ion at m/z566 (5%) was consistent with a protonated adduct of metabolite E and deoxyguanosine. The product ion spectrum of the ion atm/z 566 gave abundant fragments atm/z at 450 (MH+ − 116) (loss of the deoxyribosyl fragment) and at m/z299 (loss of deoxyguanosine). Interestingly, all four deoxyguanosine adducts had similar MS/MS fragmentation patterns as described above, and the earlier eluting isomer is shown in Fig. 5.
Product ion spectrum of m/z 566 (MH+) of metabolite E-dG adduct.
The precise reason for the enhanced reactivity of DNA toward metabolite E quinone methide in comparison to deoxyguanosine is not fully understood. It is possible that the conformation of double-stranded DNA may influence the reactivity of the guanine residue toward metabolite E quinone methide. This elevation in reactivity may be linked to a higher effective concentration of DNA due to prereaction binding by way of metabolite E intercalation. This effect is modeled after enzyme catalysis, where reaction rates are increased because of substrate-enzyme binding (Fersht, 1999).
Oxidation of Metabolite E by Rat Liver Microsomes.
We examined the oxidation of metabolite E to the quinone methide metabolite in rat liver microsomes by trapping these reactive species with [3H]GSH (Table 1). The trapping reaction should be very efficient due to the high concentration of GSH in the medium and the fast rate of addition of thiols to the quinone methides relative to amino or hydroxy groups (Bolton et al., 1992; Monks and Lau, 1997). Nevertheless, a small amount of binding to microsomal protein is possible, so the conjugate formation shown in Table 1 is a lower limit for the generation of quinone methide. Because of the poor solubility of metabolite E in buffer, we found that using 0.1 mM concentration of metabolite E in the incubation generated the most reproducible results. The radiochromatograms gave peaks with retention times identical to those derived from addition of GSH to the quinone methide. The epimers of the trans-form of metabolite E-GSH adduct were generated almost exclusively in microsomal incubations. This is not surprising since the enzyme's tertiary structure may impose stereoselectivity in the oxidation reaction as observed for several P450 catalyzed reactions (Guengerich and McDonald, 1990). In contrast, more epimers of the cis-form were generated in direct addition of GSH to the chemically generated quinone methide. Finally, the amount of quinone methide formed from metabolite E was comparable with that formed from 4-hydroxytamoxifen at 0.1 mM concentration (Table 1).
Oxidation of Tamoxifen by Rat Liver Microsomes.
Literature reports have shown that metabolite E can be detected in the plasma of patients treated with tamoxifen (Murphy et al., 1987; Wiebe et al., 1992). When we incubated tamoxifen with rat liver microsomes, we were able to detect the presence of metabolite E. HPLC chromatograms gave peaks with retention times identical to the synthetic metabolite E standard (Fig. 6). Additional LC/MS experiment gave a new molecular ion at m/z at 301 (protonated metabolite E), which was absent in the control experiment. These data suggest the potential biotransformation of tamoxifen to metabolite E and ultimately the biotransformation of metabolite E to the quinone methide as the proximate carcinogen.

A, HPLC chromatogram (Method D) of synthetic cis/trans-metabolite E standard; and B, HPLC chromatogram of the incubation of tamoxifen with rat liver microsomes.
Arrows indicate the formation of metabolite E after incubation.
Conclusions
It is known that tamoxifen forms several DNA adducts in animal models (Hard et al., 1993; Pathak and Bodell, 1994; Osborne et al., 1996) and in humans (Shibutani et al., 1999; Terashima et al., 1999). The majority of these adducts appear to result from the α-hydroxylation pathway, ultimately producing the tamoxifen carbocation (Phillips et al., 1994a,b). However, many of the minor adducts have not been identified, and it is possible that the metabolite E quinone methide contributes to the DNA adduct profile. Both quinone methide and o-quinone formation have been invoked to explain adducts not resulting from the tamoxifen carbocation (Dehal and Kupfer, 1996; Moorthy et al., 1996). In this study, we have shown that rat liver microsomes can generate a detectable amount of metabolite E from tamoxifen. From our GSH-trapping experiment, metabolite E can be further biotransformed into quinone methide in the presence of cytochrome P450. We have also shown that metabolite E quinone methide is capable of forming DNA adducts. Despite the stability of the metabolite E quinone methide (half-life reaching 4 h under physiological conditions), cytotoxicity and/or genotoxicity may still occur if the cellular level of GSH is depleted. Finally, these data suggest this quinone methide may contribute to the potential carcinogenicity of tamoxifen.
Acknowledgments
We acknowledge Dr. Richard B. van Breeman, Dr. Yousheng Hua, and Dr. Chung Gu for assistance with mass spectrometry experiments and Hewlett Packard for providing the LC/MS instrumentation.
Footnotes
-
Send reprint requests to: Judy L. Bolton, Ph.D., Department of Medicinal Chemistry and Pharmacognosy (M/C 781), College of Pharmacy, University of Illinois at Chicago, 833 South Wood St., Chicago, IL 60612-7231. E-mail: judy.bolton{at}uic.edu
-
This work was supported by National Institutes of Health Grant CA79870.
- Abbreviations used are::
- Metabolite E
- cis/trans-1,2-diphenyl-1-(4-hydroxyphenyl)-but-1-ene
- ME-SG
- glutathione conjugate of metabolite E
- GSH
- glutathione
- dG
- deoxyguanosine
- LC/MS/MS
- liquid chromatography/tandem mass spectrometry
- Bis-Tris
- bis[2-hydroxyethyl]iminotris[hydroxymethyl]methane
- HPLC
- high-performance liquid chromatography
- P450
- cytochrome P450
- Received November 28, 2000.
- Accepted February 13, 2001.
- The American Society for Pharmacology and Experimental Therapeutics


