


Abstract
Mycophenolic acid (MPA) is part of the immunosuppressant therapy for transplant recipients. This study examines the role of the canalicular transporter, Mrp2, and the effect of cyclosporin A (CsA), on the biliary secretion of the ether (MPAGe) and acyl (MPAGa) glucuronides of MPA. Isolated livers from Wistar rats (n = 6), or Wistar TR– rats (n = 6) were perfused with MPA (5 mg/l). A third group of Wistar rats (n = 6) was perfused with MPA and CsA (250 μg/l). There was no difference in the half-life, hepatic extraction ratio (EH), clearance or partial clearance of MPA to MPAGe, but there was a difference in partial clearance to MPAGa between control and CsA groups (0.9 ± 0.4 versus 0.5 ± 0.1 ml/min). TR– rats had a lower EH (0.59 ± 0.30 versus 0.95 ± 0.30), a lower clearance (18 ± 8 versus 29 ± 7 ml/min), and a longer half-life (19.5 ± 10.3 versus 10.1 ± 2.4 min) than controls. Compared to controls, MPAGe and MPAGa biliary excretion was reduced by 99% and 71.8%, respectively, in TR– rats, and 17.5% and 53.8%, respectively, in the MPA-CsA group. The biliary excretion of MPAGe is mediated by Mrp2, whereas that of MPAGa seems to depend on both Mrp2 and another unidentified canalicular transporter. Although CsA can inhibit Mrp2, our data suggest that it may also inhibit the hepatic glucuronidation of MPA in Wistar rats.
Mycophenolic acid (MPA) acts via inhibition of inosine monophosphate dehydrogenase (IMPDH) and forms part of the triple immunosuppressive therapy for transplant recipients. In humans, MPA is metabolized primarily by glucuronidation in the liver (Bowalgaha and Miners, 2001) to form mycophenolate ether glucuronide (MPAGe) and mycophenolate acyl glucuronide (MPAGa) (Shipkova et al., 1999). MPAGe has no inhibitory effects on IMPDH (Schutz et al., 1999) and is the major urinary excretion product of MPA, accounting for >95% of the administered dose (Bullingham et al., 1996a). In contrast, although it is a relatively minor metabolite, MPAGa may be biologically active and capable of inhibiting IMPDH and leukocyte proliferation, and inducing cytokine release (Schutz et al., 1999; Wieland et al., 2000; Shipkova et al., 2001).
MPAGe undergoes extensive biliary secretion and, in the gut, is hydrolyzed by bacterial β-glucuronidase to re-form MPA, which undergoes enterohepatic recirculation (Bullingham et al., 1996b). Between 10 and 61% of the plasma MPA area under the plasma concentration versus time curve (AUC) may be due to enterohepatic recirculation, which leads to a second peak in the concentration-time profile of MPA at approximately 8 to 12 h after the administration of mycophenolate mofetil (the prodrug of MPA) (Bullingham et al., 1996a).
Several studies have demonstrated a relationship between plasma MPA AUC and clinical outcomes in transplant patients. In particular, a low MPA AUC has been associated with a higher incidence of organ rejection early after transplantation surgery, and a high MPA AUC with drug toxicity (Pillans et al., 2001; Kuypers et al., 2003). Hence, interactions affecting MPA AUC are likely to be clinically significant.
An important interaction has been described between cyclosporin A (CsA) and MPA, with CsA decreasing plasma concentrations of MPA (Smak Gregoor et al., 1999; Filler et al., 2001; Brown et al., 2002; Kuypers et al., 2003). Most pharmacokinetic interactions involving calcineurin inhibitors arise from their actions as substrates for intestinal and hepatic p-glycoprotein and the cytochrome P450 3A enzymes (Bohme et al., 1993; Lin and Lu, 1998). However, CsA may also inhibit the UGT-catalyzed metabolism of MPA (Zucker et al., 1999) as well as the hepatic canalicular transporter MRP2/Mrp2 (Kobayashi et al., 2004; Hesselink et al., 2005) and the hepatic basolateral transporters of the OATP/oatp family (Shitara et al., 2002, 2003).
van Gelder and coworkers have studied the pharmacokinetic interactions between mycophenolate mofetil and CsA in Lewis rats and Wistar TR– rats that lack the Mrp2 transporter (van Gelder et al., 2001; Hesselink et al., 2005). Control Lewis rats treated with mycophenolate mofetil alone had significantly higher MPA AUC0–24 h than did Lewis rats coadministered CsA for up to 2 weeks. These differences were mainly due to a reduction in MPA exposure associated with the loss of the second peak in the plasma MPA concentration-dose interval profiles, suggesting reduced enterohepatic recirculation in rats coadministered CsA. In addition, the MPAGe AUC0–24 h for Lewis rats coadministered CsA was significantly higher than that for control Lewis rats, suggesting inhibition of the biliary secretion of MPAGe by CsA (van Gelder et al., 2001). In the Wistar TR– rats, CsA treatment had no effect on MPAGe AUC0–24 h, supporting the involvement of Mrp2 in the CsA-MPA interaction. However, even in TR– rats, chronic CsA treatment significantly decreased the plasma MPA/MPAGe ratio, suggesting that Mrp2 may not be entirely responsible for the CsA-MPA drug interaction (Hesselink et al., 2005).
Kobayashi et al. (2004) recently demonstrated the Mrp2-dependent biliary secretion of MPAGe in rats. In addition, they reported that CsA reduced the biliary excretion of the glucuronide metabolites of MPA by approximately 20%. Unfortunately, plasma and bile were only collected over 2 MPA half-lives, and the total recoveries of MPA and its glucuronide metabolites could not be determined. Therefore, it was not possible to establish whether CsA decreased the glucuronidation of MPA or the biliary secretion of metabolites. Similarly, although Hesselink et al. (2005) suggest that CsA inhibits the enterohepatic recirculation of MPA, they did not measure the total recovery of MPA and its glucuronide metabolites in bile and, thus, could not distinguish between an effect of CsA on the biliary secretion of the glucuronide metabolites and their hydrolysis in the gut. This second mechanism may be important, given the antibacterial, fungicidal, and antiparasitic effects of CsA (Fahr, 1993).
The aim of this study was to further investigate the role of the canalicular transporter Mrp2 in the biliary excretion of MPA, MPAGe, and its pharmacologically active metabolite MPAGa, and to determine its role in the CsA-MPA drug interaction. The experiments used the rat isolated perfused liver model, which overcomes the potential for interactions at the level of extrahepatic metabolism or transport. Protein-free perfusion medium was used to overcome the potential for confounding protein binding interactions between MPA and CsA.
Materials and Methods
Materials. Mycophenolic acid, mycophenolate ether glucuronide, mycophenolate acyl glucuronide, and carboxy butoxy ether mycophenolic acid were provided by F. Hoffman-La Roche, (Basel, Switzerland). Sodium taurocholate, phenylmethylsulfonyl fluoride, and d-saccharic acid-1,4-lactone were purchased from Sigma-Aldrich (St. Louis, MO). All other reagents were of analytical grade.
Liver Perfusions. The studies were approved by the animal ethics committees of The Queen Elizabeth Hospital and the University of South Australia (Institute of Medical and Veterinary Science). Male Wistar rats (214–350 g) were anesthetized with an intraperitoneal injection of pentobarbital (60 mg/kg). Livers were perfused in situ as described previously (Sallustio et al., 1996) at 37°C within a thermostatically controlled perfusion cabinet. The perfusion medium was a Krebs-bicarbonate buffer (0.30 liter, pH 7.4) containing glucose (3.27 g/l) and sodium taurocholate (0.896 g/l) and continually gassed with carbogen (5% CO2, 95% O2). With a recirculating design, the perfusion medium was pumped at 30 ml/min into the liver through a cannula inserted into the hepatic portal vein and returned via a cannula inserted into the vena cava via the right atrium. Perfusion medium was sampled directly from the reservoir, whereas bile was sampled via a cannula inserted into the bile duct. A continuous infusion of sodium taurocholate (15 μmol/h) into the perfusion reservoir was used to promote bile flow. Each liver was assessed for viability by measuring bile flow (>5 μl/min) and monitoring liver oxygen consumption. The general appearance of the liver was also monitored to ensure that adequate perfusion was taking place. The liver was equilibrated for between 15 and 20 min before a bolus dose of MPA (1.5 mg) was added to the perfusion medium (time = 0).
The hepatic disposition of MPA was examined in control Wistar rat liver perfusions (n = 6). In a separate set (n = 6) of otherwise identical perfusions, CsA was added to the perfusion medium to attain an initial concentration of 250 μg/l and allowed to equilibrate for 20 min before the addition of MPA. In addition, livers from Wistar TR– rats (n = 6), which lack the Mrp2 transporter (Soroka et al., 2001), were perfused under the same conditions as the control rats. The concentration of CsA was chosen to attain an initial perfusate concentration approximately 6 times higher than the maximum unbound concentration attained in renal transplant patients, assuming an unbound fraction of approximately 2% and peak total concentrations of 2000 μg/l (Keown et al., 2001; Akhlaghi and Trull, 2002).
During each experiment, samples of the perfusion medium (1 ml) were collected from the reservoir before and at 2.5, 5, 10, 15, 20, 25, 30, 35, 40, 50, 60, 70, 80, and 90 min after addition of the MPA, and bile samples were collected at 10-min intervals throughout the experiment. Perfusion medium samples were acidified with 15 μl of 0.1 M phosphoric acid, and bile samples were acidified with 250 μl of 1.0 M glycine buffer (pH 3.0) to stabilize the acyl-glucuronide. All samples were frozen and stored at –20°C until analysis. At the end of each perfusion, livers were removed and stored at –80°C until analysis.
Livers were thawed in saline and then removed and dried. The liver was weighed and homogenized on ice with 0.15 M phosphate buffer (pH 6.0) (2 ml/g liver) containing 2 mM phenylmethylsulfonyl fluoride and 40 mM d-saccharic acid-1,4-lactone to prevent degradation of the glucuronides. A sample (100 μl) was assayed for MPA, MPAGe, and MPAGa by high performance liquid chromatography (HPLC), with the remaining liver homogenate frozen and stored at –80°C.
Analytical Methods. Concentrations of MPA and MPAGe in perfusate, bile, and liver samples were determined by HPLC (Westley et al., 2005). Briefly, 100 μl of each sample were added to 250 μl of acetonitrile containing the internal standard carboxy butoxy ether mycophenolic acid (10 mg/l), vortex mixed, and centrifuged (5 min at 13,000g), and the supernatant was analyzed by reversed phase HPLC with UV detection at a wavelength of 254 nm. The limits of quantification for MPA and MPAGe were 0.5 and 5.0 mg/l, respectively. Because of the small quantity of pure MPAGa available, concentrations of MPAGa were determined using the calibration curve for MPA. Using samples spiked with pure MPAGa, the intra-assay reproducibility (CV %) and accuracy (bias %) of this method was 0.77% and –4.37%, respectively, at 100 mg/l and 7.35% and 9.47%, respectively, at 2.5 mg/l (n = 6).
Pharmacokinetic Analysis. The half-life (t1/2) of MPA was determined by regression analysis of the terminal portion of the log MPA perfusate concentration versus time profile. The area under the MPA perfusate concentration versus time profile from 0 to 90 min (AUC0–90) was calculated by the log trapezoidal method and was added to the extrapolated area to determine the AUC to infinite time (AUC0-∞). The biliary excretion half-lives (t1/2 bile) of MPAGe and MPAGa were determined by regression analysis of the respective log biliary excretion rate versus time profiles.
For each liver, the total clearance (CL) of MPA from perfusate was calculated as CL = D/AUC(0-∞), where D is the dose of MPA added to the perfusion reservoir. The hepatic extraction ratio (EH) was calculated as EH = CL/Q, where Q is perfusate flow rate (30 ml/min).
The partial clearances of MPA via formation of MPAGa (CLMPA→MPAGa) or MPAGe (CLMPA→MPAGe) were calculated as CLMPA→MPAGa = CL · fMPAGa and CLMPA→MPAGe = CL · fMPAGe, where fMPAGa and fMPAGe are the fractions of the initial MPA dose recovered as MPAGa and MPAGe, respectively.
Statistical Analysis. All values are presented as mean ± standard deviation. One-way analysis of variance with Dunnett's multiple comparison test was used to test the differences in AUC(0-∞), t1/2, EH, CL, CLint, rat and liver weights, dose recovered in bile (percentage), dose recovered in perfusate (percentage), dose recovered in liver (percentage), and bile flow rates. For all statistical tests, a p value of <0.05 was considered significant.

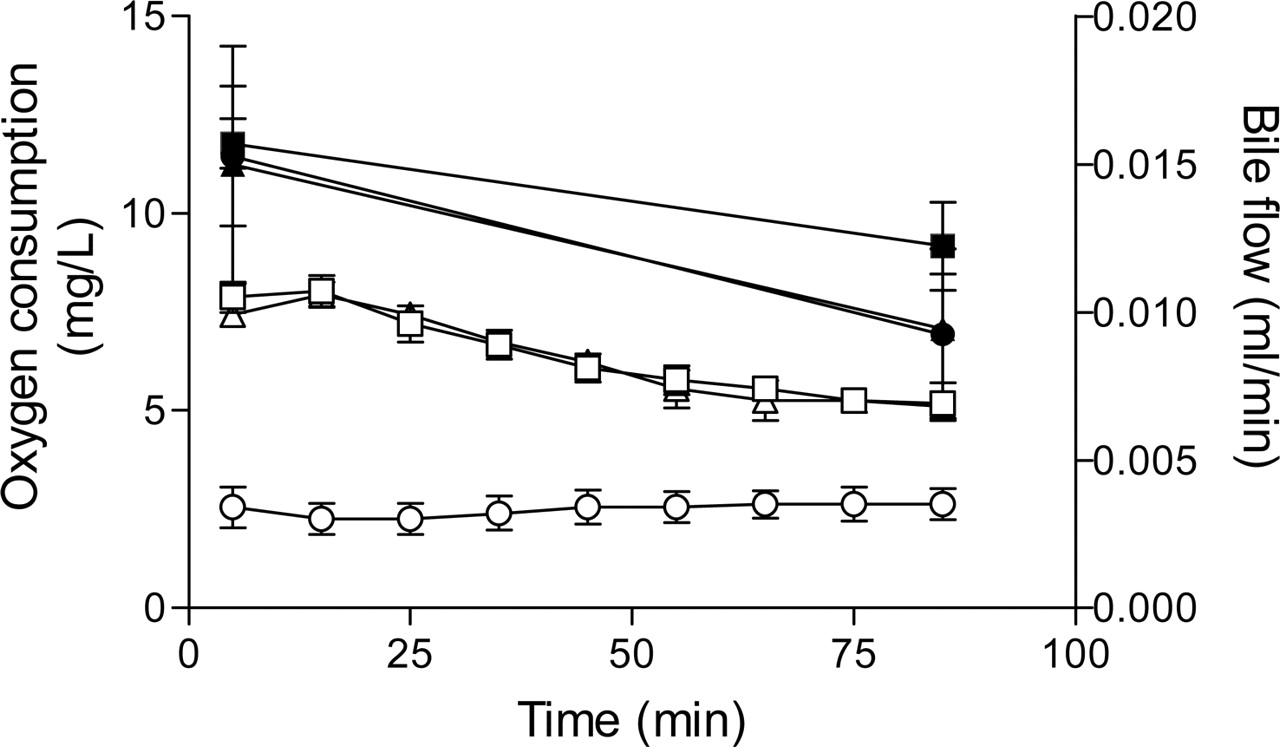
Mean (S.D.) bile flow rates (open symbols) and oxygen consumption (closed symbols) in control (▪, □), TR– (•,○), and MPA-CsA (▴, ▵) perfusions.
Results
Mean ± S.D. rat weights were 229.2 ± 50.0, 295.7 ± 25.5, and 275.5 ± 29.6 g in control, TR–, and MPA-CsA perfusions, respectively. Liver weights were 14.3 ± 2.4, 15.0 ± 0.9, and 12.9 ± 1.7 g in control, TR–, and MPA-CsA perfusions, respectively. There was no significant difference in rat and liver weights among the three groups. Bile flow rates and oxygen consumption in the three groups of perfusions are shown in Fig. 1. There were no differences in bile flow rates between control and MPA-CsA groups (p > 0.05), and bile flow remained >5 μl/min throughout the 90-min perfusion. In contrast, the bile flow rates in the TR– group were significantly lower compared with the control group (p < 0.01), consistent with previous reports (Xiong et al., 2000). Although bile flow rate was reduced in the TR– group, liver oxygen consumption was similar to that of controls (p > 0.05), and all livers appeared to be fully perfused.
The CL, EH, CLMPA→MPAGa, and CLMPA→MPAGe values of MPA were significantly lower (p < 0.05) in TR– livers compared with controls, whereas the t1/2 of MPA was significantly longer (p < 0.05) in the TR– group (Table 1). In addition, in the TR– group, MPAGe excretion into bile was <1% of that in the control group, and MPAGa excretion was 28% of that in the control group (Table 2). Whereas, in the control group most of the MPA dose was recovered in bile as MPAGe, in the TR– group, 59% of the MPA dose was recovered in the perfusate as MPAGe (Fig. 2; Table 2). In TR– livers, significantly more MPA was recovered unmetabolized compared with control livers (Table 2). The mean total dose recovered in the control rats (89.5 ± 9.2%) was significantly different from that of the TR– group (67.7 ± 11.9%) (p < 0.01) (Table 2).
Mean (S.D.) pharmacokinetic parameters for the disposition of MPA, MPAGe, and MPAGa in the isolated perfused rat liver
Mean (S.D.) percentage dose recovery
There was no significant difference in mean t1/2, EH, CL, and AUC(0-∞) of MPA between the control and MPA-CsA groups (Table 1). Total MPAGe recovered in bile was significantly higher (p < 0.01) in the control liver perfusions compared with the MPA-CsA liver perfusions, which accounted for 84% and 69.3% of the MPA dose, respectively (Table 2). Similarly, in bile MPAGa accounted for 3.9% and 1.8% (p < 0.05) of the MPA dose in the control and MPA-CsA rats, respectively. Despite these differences in the total amount of glucuronide metabolites excreted in bile, there were no differences in the biliary excretion half-lives of MPAGe or MPAGa between control and MPA-CsA perfusions. However, the partial clearance of MPA to MPAGa was significantly lower (p < 0.05) in MPA-CsA livers compared with controls (Table 1). There was no significant difference in the recovery of unmetabolized MPA between control and MPA-CsA livers (Table 2). No MPAGa or MPAGe was detected in the perfusion medium of the control and MPA-CsA livers. MPA excretion into bile was less than 1% of the dose for all three groups (Table 2).
Discussion
The complete lack of biliary secretion of MPAGe in TR– rats compared to the 84% recovery of the MPA dose as MPAGe in bile in control rats suggests that Mrp2 is responsible for the transport of MPAGe from the liver into bile. This is consistent with the findings of Kobayashi et al. (2004). Whereas the excretion of MPAGa was also significantly lower in TR– rat liver perfusions, the reduction was much less than that observed for MPAGe (Table 2), suggesting that a second transporter may also be involved in the secretion of MPAGa into bile. The involvement of a second transporter, in addition to Mrp2, has similarly been suggested by Nishino et al. (2000) for the canalicular efflux of the acyl glucuronide metabolite of the angiotensin-converting enzyme inhibitor, telmisartan. To our knowledge, this is the first study to demonstrate the involvement of different transporters in the biliary secretion of MPAGe and MPAGa. The identity of the second transporter involved in canalicular efflux of MPAGa is unknown. In addition to MRP2, P-glycoprotein, BSEP, MRP4, and ABCG2 are also efflux transporters located on the canalicular membrane (Haimeur et al., 2004). Of these transporters, MRP4 (van Aubel et al., 2002) and ABCG2 (Suzuki et al., 2003) might be likely candidates since they are known to transport glucuronide conjugates.
The appearance of MPAGe in the perfusate medium of TR– rats (accounting for 59% of the MPA dose), compared to less than 1% of the MPA dose as MPAGe in the control rats, is consistent with the loss of Mrp2 in the mutant rats. It has been reported previously that the loss of Mrp2 protein expression in TR– rats is associated with increased expression of Mrp3 on the hepatocyte basolateral membrane (Soroka et al., 2001), and this may facilitate the efflux of MPAGe from the liver into perfusate. Xiong et al. (2000) have also observed increased basolateral egress of acetaminophen glucuronide in perfused livers of TR– rats compared to Wistar control rats, and have shown that this was the result of both impaired biliary excretion of the glucuronide metabolite and increased expression of Mrp3 facilitating the sinusoidal efflux of the metabolite.
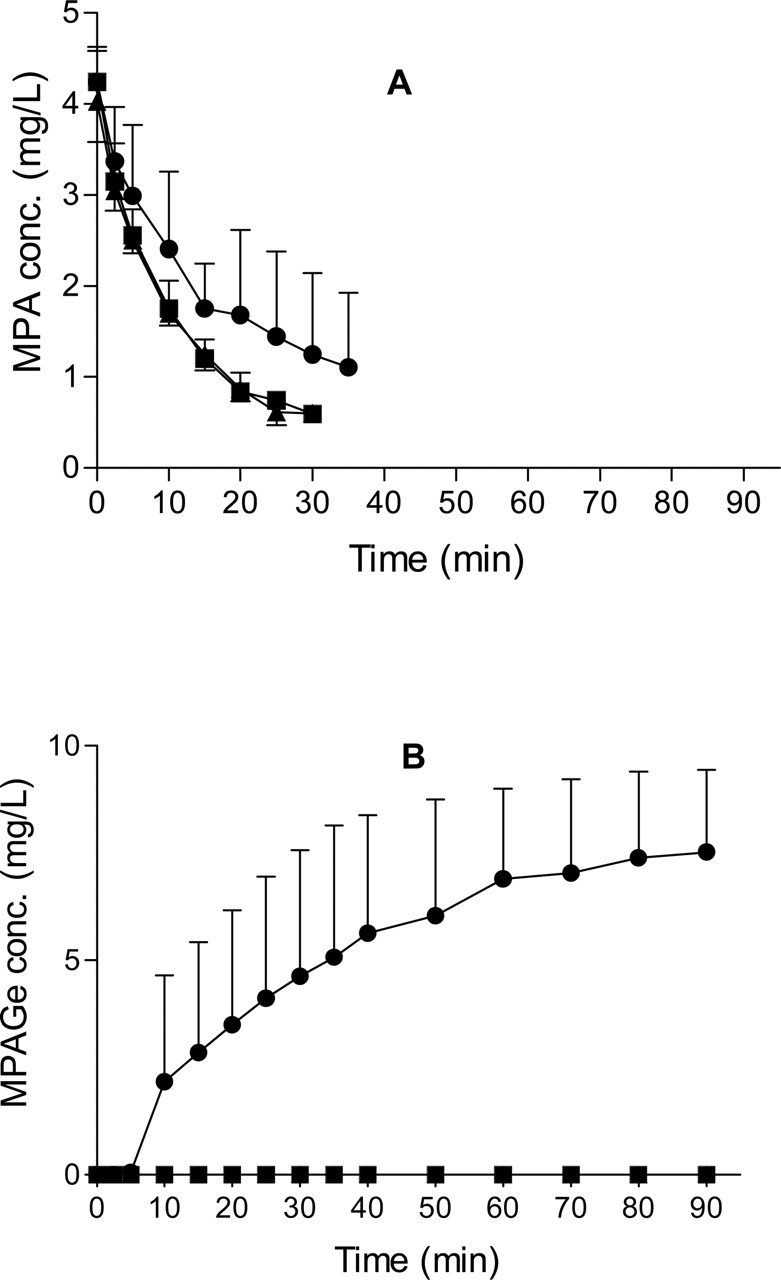
A, the mean (S.D.) MPA perfusate concentrations in control (▪), TR– (•), and MPA-CsA (▴) perfusions. B, the mean (S.D.) MPAGe perfusate concentrations in control (▪), TR– (•), and MPA-CsA (▴) perfusions. MPAGa was not detected in perfusate.
The lower CL and EH ratio of MPA in TR– perfusions compared with controls may be the result of two processes. The TR– liver may have a lower capacity to metabolize MPA. A previous study has reported altered phase I metabolic capacity in TR– rats compared with their Wistar controls (Jager et al., 1998). However, there are few data on phase II metabolic capacity in Mrp2-deficient rats. Mrp2-deficient rats develop cholestasis and raised concentrations of bile acids, ligands for nuclear receptors that regulate many aspects of hepatic physiology, including drug-metabolizing enzymes and transporters (Chiang, 2003; Guo et al., 2003). Thus, it would seem reasonable to expect that transporter-deficient animals may also show altered metabolic capacity. In addition, it is possible that accumulation of endogenous compounds, which may include substrates and products of UGTs, may also directly inhibit UGT activity. Alternatively, there may be greater hydrolysis of the labile MPAGa to MPA (as a result of not being secreted into bile), which is then transported out of the cells into perfusate. However, since MPAGa only accounts for 3.9% of the MPA dose recovered in control perfusions, even if it was all hydrolyzed to MPA, it could not account for the approximately 50% decrease in the CL and EH of MPA in TR– perfusions. Thus, the TR– rats appeared to have a lower capacity to metabolize MPA, and this is supported by the significantly lower partial clearances of MPA to MPAGe and MPAGa (Table 1), and the significantly greater amount of unmetabolized MPA recovered in the livers of TR–rats (4.4% of the MPA dose) compared with the control rats (1.2% of the MPA dose).
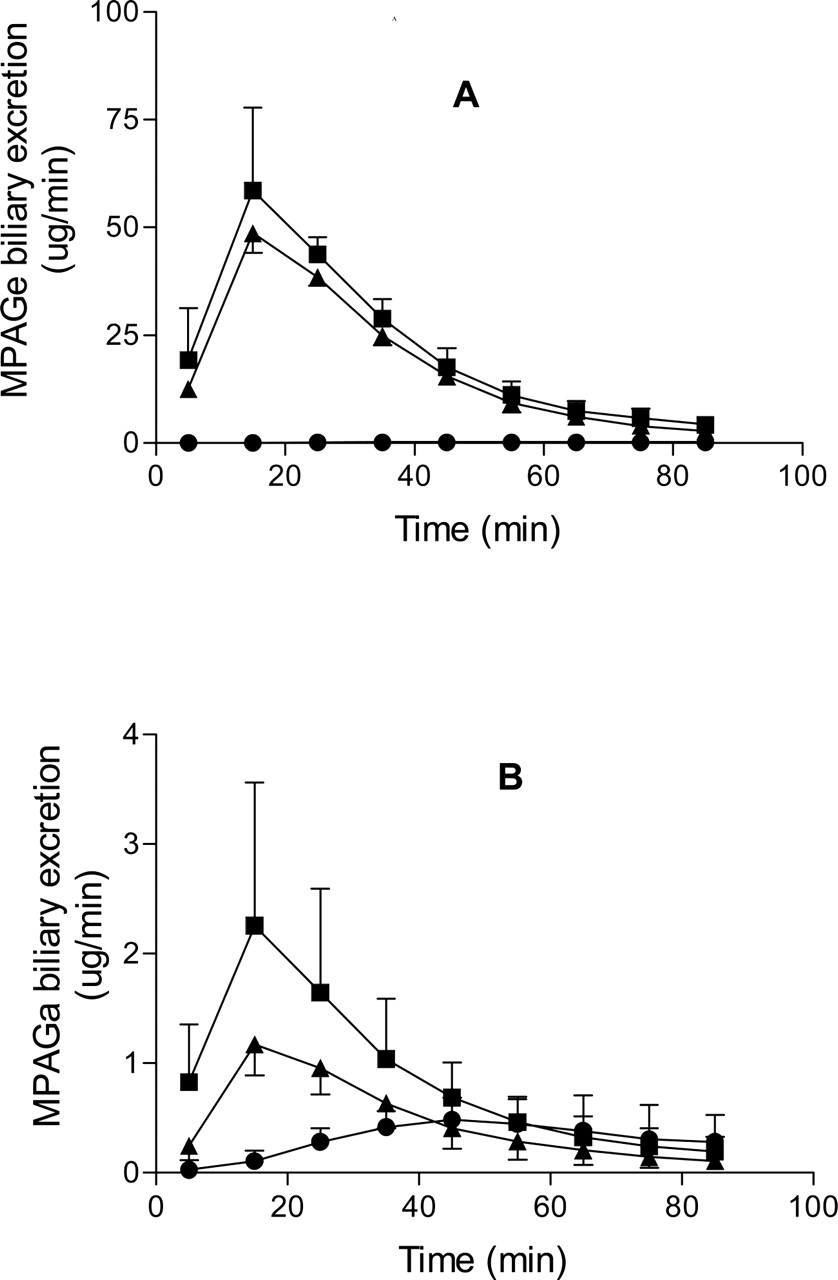
A, the mean (S.D.) MPAGe biliary excretion rates in control (▪), TR– (•), and MPA-CsA (▴) perfusions. B, the mean (S.D.) MPAGa biliary excretion rates in control (▪), Tr– (•), and MPA-CsA (▴) perfusions.
The significant differences in biliary excretion rates of MPAGe and MPAGa between control and MPA-CsA livers (Fig. 3) are consistent with inhibition of Mrp2-mediated canalicular efflux of the conjugates. However, there was no significant difference in biliary excretion half-lives of MPAGe or MPAGa between the two groups (Table 1). In addition, the total recoveries of MPAGe and MPAGa were significantly lower in MPA-CsA livers compared with controls, suggesting that CsA may also inhibit the metabolism of MPA to MPAGe and MPAGa. Given the lack of effect of CsA on the partial clearance of MPA to MPAGe (Table 1), it is difficult to clearly identify a mechanism for the effect of CsA on the recovery of MPAGe in bile. It is possible that both Mrp2 and glucuronidation effects contribute to the relatively small changes observed. In contrast, CsA significantly decreased the net formation of MPAGa (Table 1) by approximately 50%, suggesting that CsA may inhibit the formation of MPAGa or that, because of decreased canalicular efflux of MPAGa, it may result in a greater fraction of this metabolite being hydrolyzed to MPA. These results are consistent with a previous in vitro study, showing that CsA inhibits the glucuronidation of MPA by UDP-glucuronosyltransferase(s) extracted from human kidneys, with an apparent Ki of 2518 μg/l (Zucker et al., 1999). Picard et al. (2005) have also recently reported that different UGTs are involved in the formation of MPAGe and MPAGa in humans. In addition, CsA is a substrate for glucuronidation by UGT2B7 (Strassburg et al., 2001), the same isoform catalyzing the formation of MPAGa in humans. In comparison, reported Ki values for competitive inhibition of Mrp2-mediated transport of bilirubin and leukotriene C4 are 10 μM (12,026 μg/l) and 3.4 μM (4089 μg/l), respectively (Bohme et al., 1993; Kamisako et al., 1999). These values are all at least an order of magnitude greater than the perfusion medium concentration of CsA used in this study and, thus, may account for the relatively modest effects of CsA. Nevertheless, the approximately 17.5% lower recovery of MPAGe in the presence of CsA observed in this study was similar to the previously reported 20% lower biliary excretion of MPA glucuronide metabolites in Wistar rats coadministered a single dose of CsA compared with controls receiving MPA alone (Kobayashi et al., 2004).
Whereas CsA seemed to inhibit the glucuronidation of MPA, there was no difference between control and MPA-CsA groups in the t1/2, AUC(0-∞), CL, EH, and CLint of MPA. This is consistent with MPA behaving as a high clearance drug (EH >90%) in the isolated perfused rat liver model, so that perfusate flow rate would be the primary determinant of MPA CL. Interestingly, in both TR– rats and MPA-CsA rats, the total MPA dose recovered was significantly lower compared with controls (Table 2). Because all three experimental groups attained the same initial MPA concentrations in perfusate (Fig. 2A), the lower total dose recoveries in TR– rats and MPA-CsA rats compared with controls may indicate that in these two groups a greater fraction of the dose was metabolized to the glucoside conjugate or oxidative metabolite (Shipkova et al., 1999), both of which are undetectable by our current analytical method.
Although in vivo studies in rats and humans suggest that, with long-term exposure, CsA inhibits the enterohepatic recirculation of MPA, the high Ki values previously reported for inhibition of Mrp2 and our present results suggest that direct inhibition of Mrp2 by CsA may be relatively modest. In particular, the unbound concentrations of CsA achieved clinically are likely to be much lower than those attained in this study or the Ki values for inhibition of Mrp2. Therefore, other processes should also be considered in the in vivo interaction between MPA and CsA. For example, chronic exposure may allow accumulation of CsA and its metabolites within the liver to attain higher concentrations than those in plasma. In addition, a role for CsA metabolites in the interaction with MPA has been suggested by a clinical study in liver transplant patients, which reported that inhibition of hepatic canalicular efflux, observed as accumulation of conjugated bilirubin, was associated with accumulation of CsA metabolites M8 (AM19) and M17 (AM1) rather than parent CsA (Kohlhaw et al., 1994). Some CsA metabolites may also undergo further metabolism to glucuronide conjugates (Sewing et al., 1990), which may also be involved in the CsA-MPA interaction. Moreover, long-term CsA exposure may alter canalicular transporter expression or localization, as was recently reported for BSEP (Roman et al., 2003). Importantly, the observation of a lower plasma MPA/MPAGe AUC ratio in TR– rats treated with cyclosporine, compared with TR– rats treated with vehicle only (Hesselink et al., 2005), suggests that Mrp2-independent mechanisms may also be involved in the long-term interaction between CsA and MPA.
In conclusion, we have demonstrated that Mrp2 is the transporter associated with the biliary excretion of MPAGe. The biliary excretion of MPAGa appears to be mediated by Mrp2 and another, as yet unidentified, transporter. We have also shown that, in addition to possible inhibition of Mrp2, CsA may inhibit the hepatic glucuronidation of MPA in Wistar rats. However, after acute exposure to CsA, both of these effects were relatively modest, and further work is necessary to elucidate the effects of long-term exposure to CsA on the hepatic disposition of MPA.
Footnotes
-
This work was funded, in part, by a grant-in-aid from the Australian Kidney Foundation.
-
Article, publication date, and citation information can be found at http://dmd.aspetjournals.org.
-
doi:10.1124/dmd.105.006122.
-
ABBREVIATIONS: MPA, mycophenolic acid; CsA, cyclosporin A; MPAGe, mycophenolate ether glucuronide; MPAGa, mycophenolate acyl glucuronide; HPLC, high performance liquid chromatography; IMPDH, inosine monophosphate dehydrogenase; AUC, area under the plasma concentration versus time curve; UGT, UDP-glucuronosyltransferase; CL, clearance.
- Received June 19, 2005.
- Accepted November 2, 2005.
- The American Society for Pharmacology and Experimental Therapeutics


