


Abstract
Organic cation transporters (Octs) play an important role in transporting cationic xeno- and endobiotics across biological membranes. Little is known about Octs in mice; therefore, the tissue distribution and developmental changes in the mRNA expression of Octs in mice were quantified. Oct1, Oct2, Oct3, Octn1, Octn2, and Octn3 mRNA expression was quantified in 14 tissues from male and female mice using the branched DNA signal amplification assay. Oct1 mRNA expression was highest in kidney, followed by liver. Oct2 mRNA was almost exclusively expressed in kidney, with male mice having twice that in female mice. The higher expression of Oct2 in male mice is due to testosterone. Oct3 mRNA was most highly expressed in placenta, ovary, and uterus, but was expressed at low levels in most tissues. Octn1 and Octn2 mRNA expression was similar, with the highest levels in kidney followed by small intestine. Octn3 mRNA was almost exclusively expressed in testes. The developmental expression of Oct1, Oct2, Octn1, and Octn2 mRNA in kidneys as well as Oct1 in liver was determined in young mice. Ontogenic expression data indicate that each of the Octs approached adult expression levels by about 3 weeks of age. The gender difference in Oct mRNA expression did not become apparent until day 30 after birth. The differences in tissue distribution of the Octs may play an important role in drug disposition to various tissues. Furthermore, low expression of the Octs in young animals may affect the pharmacokinetic behavior of drugs compared with that in adults.
Living organisms have several mechanisms to eliminate xenobiotics and endogenous substances as a defense mechanism against the harmful effects inflicted by these substances. Cationic substances are of special interest because they comprise approximately 50% of the available therapeutic chemicals (Pritchard and Miller, 1993; Oude Elferink et al., 1995). Specific transport systems in cells are responsible for transferring these water-soluble substances through the lipophilic biological membranes to exert pharmacological action or to facilitate elimination.
In recent years, several organic cation transporters (Octs), belonging to the SLC22 gene family, have been cloned and characterized from several species. These include Oct1, Oct2, Oct3, Octn1, Octn2, and Octn3. The first organic cation transporter (Oct1) was cloned from rat kidney in 1994 (Grundemann et al., 1994). Subsequently, Oct2 and Oct3, two organic cation transporters with high homology to Oct1, were cloned and characterized in humans, rats, mice, and rabbits (Okuda et al., 1996; Gorboulev et al., 1997; Zhang et al., 1997; Kekuda et al., 1998; Urakami et al., 1998; Green et al., 1999; Karbach et al., 2000).
Cellular localization studies in kidney, using in situ hybridization, immunohistochemistry, and Western and Northern blotting, have concluded that Oct1 is localized in the basolateral membrane of S1 and S2 segments of renal proximal tubules. Oct1 expression was also assigned to the sinusoidal membrane of hepatocytes in rat liver (Meyer-Wentrup et al., 1998). Oct2 is also localized to the basolateral membranes, but of the S2 and S3 rather than S1 and S2 segments of the renal proximal tubules (Urakami et al., 1998; Karbach et al., 2000).
The expression and function of Octs are regulated by gender and different diseases. Oct2 expression is gender-biased, in rats, in favor of males (Urakami et al., 1999; Slitt et al., 2002). Oct2 expression is down-regulated to female levels in gonadectomized or estradiol (E2)-treated male rats. Also, Oct2 expression is up-regulated severalfold in female rats treated with testosterone (Urakami et al., 2000; Slitt et al., 2002). Different pathological conditions also impact the regulation of Octs. Diabetic rats undergo down-regulation of Oct1 and Oct2 renal expression, which is reversed by insulin administration (Grover et al., 2004). Chronic renal failure in rats, produced by 5/6 nephrectomy, results in down-regulation of Oct2 in rats, which is reversed by testosterone administration (Ji et al., 2002).
Oct3 is also called extraneuronal monoamine transporter for its role in the extraneuronal monoamine uptake system (uptake2) (Grundemann et al., 1998; Wu et al., 1998a). The uptake2 system participates in the uptake of extracellular monoamines in peripheral tissues and glia cells. Inhibition of the uptake2 system and, therefore, Oct3 is a potential pharmacological target for the treatment of depression by increasing monoamine levels in the central nervous system (Schildkraut and Mooney, 2004).
Octn1-Octn3 are referred to as carnitine organic cation transporters and have a low degree of similarity, in the range of 30 to 35%, to the Oct1-3 genes. Model organic cations like trimethylamine (TEA), as well as carnitine, are substrates for Octn1-3 (Yabuuchi et al., 1999). Oct carnitine transport specificity can be described as the ratio of their TEA/carnitine uptake (Tamai et al., 2000). Octn3 is the most carnitine-selective transporter, whereas Octn1 is the least selective. Octn1 and Octn2 transport carnitine and its acyl derivatives in a Na+-dependent manner (Wu et al., 1999). Therefore, Octns represent a unique case in which various substrates are transported by different mechanisms, suggesting multiple binding sites in the protein (Wu et al., 1998a; Seth et al., 1999).
In the present study, the tissue distribution, gender differences, and ontogenic expression of Oct1, 2, and 3, and Octn1, n2, and n3 in mice were determined. Most studies in the literature concerning the tissue distribution of Octs have been limited to a few tissues, and were not quantitative. These previous studies have primarily been performed in rat and human tissues, with limited data available for mice. Therefore, in the present study, the relative distribution of Oct mRNAs, as well as the developmental changes in Octs, in both male and female mice were evaluated. Understanding the tissue-specific expression patterns of Octs may help determine their contribution in the distribution of xeno- and endobiotics to various tissues. Furthermore, understanding the gender differences and ontogeny of Oct expression may help determine the molecular basis for differences in drug disposition in males versus females, and children versus adults, respectively.
Materials and Methods
Reagents. Pellets for subcutaneous release of the hormones used in this study, 5α-dihydroxytestosterone (5 mg; 21-day release) and 17β-estradiol (0.5 mg; 21-day release) were formulated by Innovative Research of America (Sarasota, FL) to deliver slightly higher than normal circulating levels of these hormones (i.e., estrogen levels of ∼750–1500 pg/ml).
Animals. Eight-week-old male and female C57BL/6 mice were purchased from Charles River Laboratories Inc. (Wilmington, MA). Animals were housed in a temperature-, light-, and humidity-controlled environment. Mice were fed Laboratory Rodent Chow W (Harlan Teklad, Madison, WI) ad libitum. Tissues were removed from five mice of each gender, frozen in liquid nitrogen, and stored at –80°C until mRNA isolation. For the ontogeny study, livers and kidneys from male and female mice were collected at –2, 0, 5, 10, 15, 22, 30, and 45 days of age (n = 5/gender/age). Male and female pups were pooled together at age –2 because it was difficult to differentiate their gender.
Gonadectomy and Sex Hormone Replacement. Mice were castrated or ovariectomized at 37 days of age by Charles River Laboratories. At 54 days of age, 5α-dihydroxytestosterone (5 mg) or 17β-estradiol (0.5 mg) 21-day time-release pellets (Innovative Research of America) were subcutaneously implanted interscapularly in intact and gonadectomized male and female mice under isoflurane anesthesia. The mice were separated into five treatment groups, with six mice per gender per treatment: 1) intact animals + placebo, 2) castration + 5α-dihydroxytestosterone, 3) castration + 17β-estradiol, 4) ovariectomy + 5α-dihydroxytestosterone, and 5) ovariectomy + 17β-estradiol. Kidneys were removed at 64 days of age from gonadectomized and age-matched intact control mice.
Total RNA Isolation. Total RNA was isolated using RNA-Bee reagent (Tel-Test, Inc., Friendswood, TX) according to the manufacturer's protocol. Total RNA concentrations were determined spectrophotometrically at 260 nm. Solutions of 1 μg/μl were prepared from the stock RNA solution by dilution with diethyl pyrocarbonate-treated deionized water. Integrity of RNA samples was evaluated visually using agarose gel electrophoresis. Samples were then visualized under ultraviolet light by ethidium bromide fluorescence.
Branched DNA (bDNA) Signal Amplification Analysis. The mRNA of each Oct in mouse tissues was quantified using the bDNA assay (Quantigene bDNA signal amplification kit; Bayer Corp., Emeryville, CA) with modifications (Hartley and Klaassen, 2000). Gene sequences of interest were accessed from GenBank. Target sequences were analyzed using ProbeDesigner software v1.0 (Bayer Corp.) to design oligonucleotide probe sets (capture, label, and blocker probes). All probes were designed with a melting temperature of 63°C, enabling hybridization conditions to be held constant (i.e., 53°C) during each hybridization step. Each developed probe was submitted to the National Center for Biotechnology Information (Bethesda, MD) by the basic local alignment search tool (BLASTn) to ensure minimal cross-reactivity with other known mouse sequences. Oligonucleotides with a high degree of similarity (>80%) to other mouse gene transcripts were eliminated from the design. The probe set sequences and functions are listed in Table 1.
Oligonucleotide probes generated for analysis of mouse Oct mRNA expression by branched DNA signal amplification assay
Total RNA (1 μg/μl; 10 μl/well) was added to each well of a 96-well plate containing 50 μl of each diluted probe set. RNA was allowed to hybridize with the probe sets overnight at 53°C. Subsequent hybridization steps were carried out according to the manufacturer's protocol, and luminescence was quantified with a Quantiplex 320 bDNA luminometer interfaced with Quantiplex Data Management software v5.02. Data are presented as relative light units (RLU) per 10 μg of total RNA.
Statistical Analysis. Gender differences in mice were determined using Student's t test, with significance set at p ≤ 0.05. Bars represent mean ± S.E.M.
Results
Tissue Distribution of Oct mRNA. Fourteen tissues were analyzed for Oct1, Oct2, Oct3, Octn1, Octn2, and Octn3 mRNA. These tissues include liver, kidney, lung, stomach, duodenum, jejunum, ileum, large intestine, heart, brain, gonads (testes and ovaries), placenta, and uterus. mRNA levels for each gene and in each tissue are reported as the average of data obtained from five C57BL/6 mice.
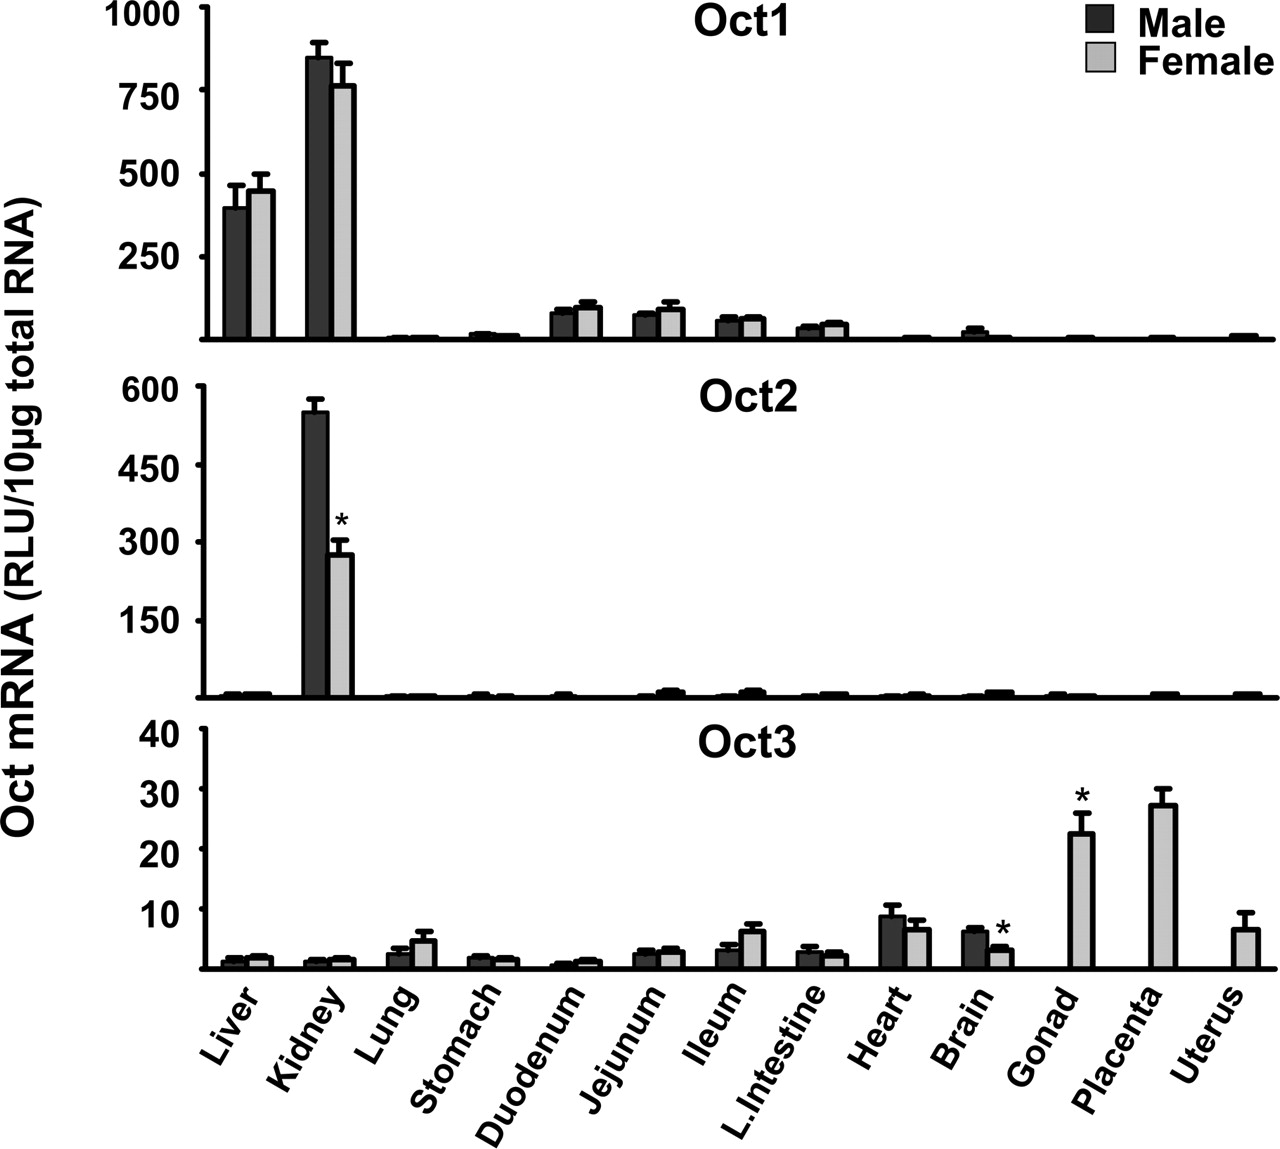
Oct1 mRNA levels were highest in kidney, followed by liver (Fig. 1). Oct1 expression in liver was approximately half that in kidney. Oct1 mRNA was moderately expressed in the small and large intestine (10% of the kidney levels). Oct2 mRNA was almost exclusively expressed in kidney. Gender-specific differences were found in Oct2 mRNA expression; Oct2 kidney mRNA levels in male mice were twice that in female mice. Oct3 mRNA levels were low in most tissues, except the female reproductive tissues, such as placenta, ovary, and uterus (Fig. 1).
Octn1 was ubiquitously expressed in most tissues, with the highest expression in kidney, followed by small intestine (Fig. 2). The Octn2 mRNA tissue distribution pattern was quite similar to that of Octn1. Octn3 was almost exclusively expressed in testes. The mRNA levels in the female ovaries were approximately 15% of that in the male testes (Fig. 2). A summary of mouse organs with predominant Oct mRNA expression is presented in Table 2.
Summary of mouse tissues with predominant Oct mRNA expression
Ontogeny of Oct1, Oct2, Octn1, and Octn2. Because kidney had the highest Oct mRNA expression, this tissue was selected to study the developmental changes in the mRNA expression of Oct1, Oct2, Octn1, and Octn2. Oct1 ontogeny was also studied in liver because, unlike other Octs, Oct1 mRNA was also abundant in liver. mRNA levels were quantified in tissues from five male and female mice at ages –2, 0, 5, 10, 15, 22, 30, and 45 days.
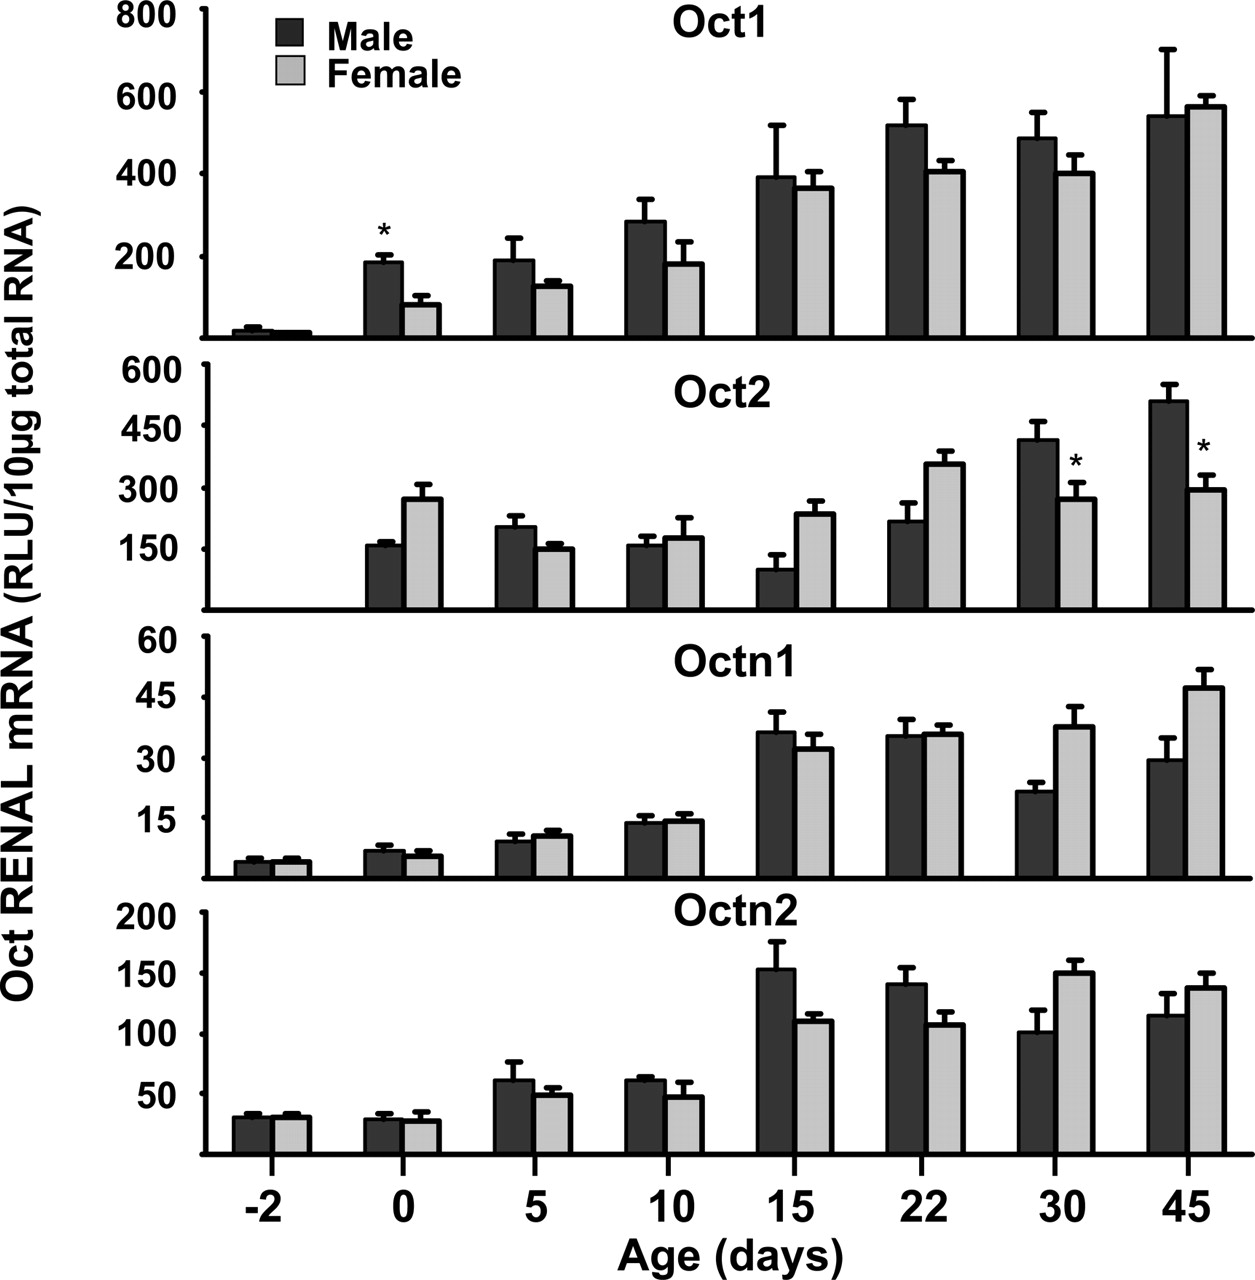
Oct1 mRNA expression was very low 2 days before birth, but gradually increased during the first 3 weeks of age, reaching a plateau around day 22 in both kidney (Fig. 3) and liver (Fig. 4). At 45 days of age, renal and hepatic mRNA levels of Oct1 were 4 to 6 times higher than the level immediately after birth. Generally, there were no gender differences in Oct1 mRNA expression except for day 0 and day 22, when male mice have predominant expression in kidneys and liver, respectively. Oct2 mRNA levels were also essentially undetectable 2 days before birth, but were approximately one-fourth of adult levels at birth. It was of interest that the gender differences in mRNA expression of Oct2 did not appear until 30 days after birth, when the female levels reached a plateau and the male levels continued to increase (Fig. 3). Octn1 and Octn2 mRNA expression gradually increased from 2 days before birth until about 2 weeks of age, when the levels reached a plateau (Fig. 3).
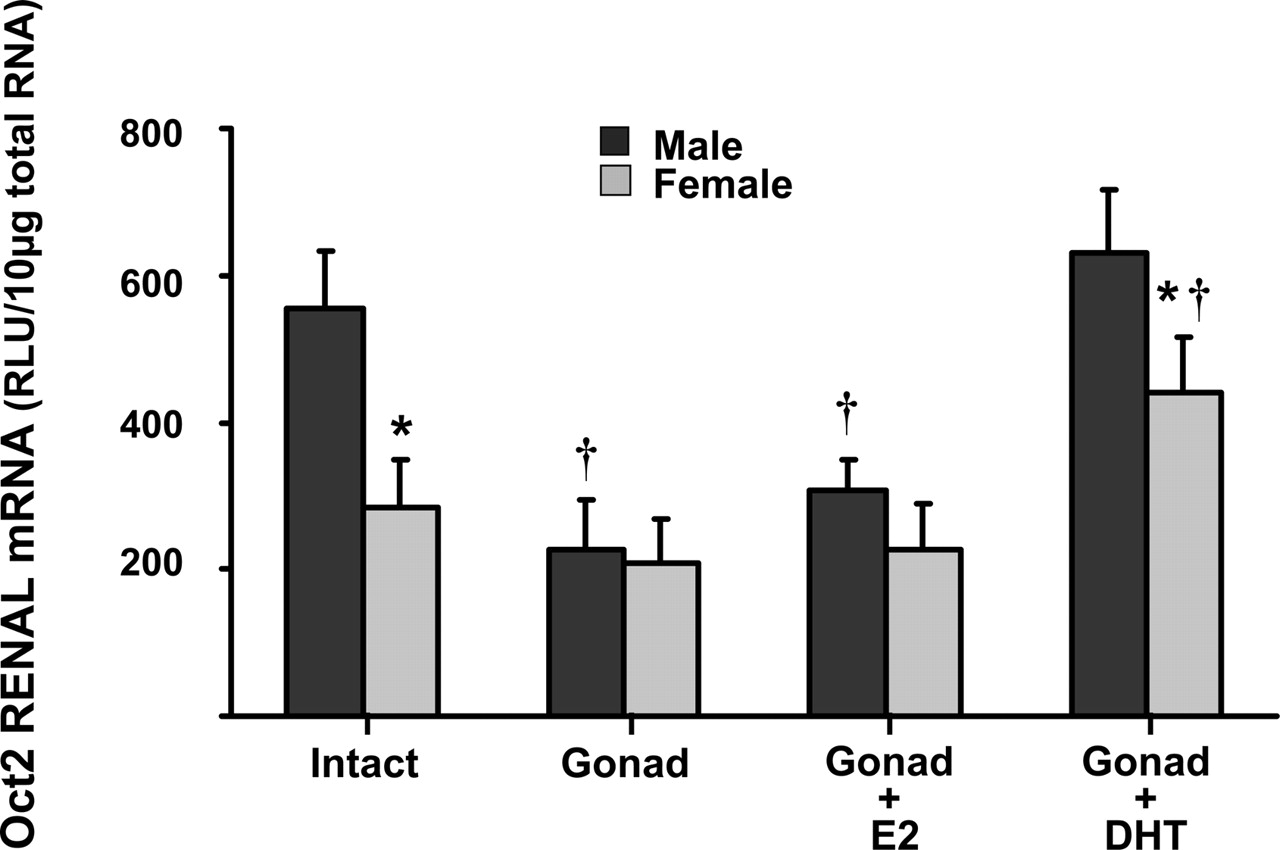
Renal Oct2 Expression in Gonadectomized Mice. To determine the mechanism of the gender difference in Oct2 mRNA expression, studies were performed to determine the effect of gonadectomy, E2, and dihydrotestosterone (DHT) on Oct2 expression in kidneys from male and female mice. Consistent with the tissue distribution data, Oct2 mRNA levels in kidneys of adult male mice were higher than those in female mice (Fig. 5). In gonadectomized male mice, Oct2 mRNA levels decreased approximately 50%, similar to levels in female kidneys. Oct2 expression in kidney was not affected by gonadectomy in female mice. E2 had no effect on Oct2 expression in either male or female gonadectomized mice. However, DHT administration to gonadectomized animals increased Oct2 expression in both genders. mRNA levels of Oct2 were restored to that present in intact male mice (Fig. 5).

Total RNA was isolated from approximately 8-week-old male and female mice and analyzed by the bDNA signal amplification assay for Oct1, 2, and 3 mRNA expression. The data are presented as mean RLU ± S.E.M. (n = 5). * represents a statistically significant difference (p ≤ 0.05) between males and females.

Total RNA was isolated from approximately 8-week-old male and female mice and analyzed by the bDNA signal amplification assay for Octn1, 2, and 3 mRNA expression. The data are presented as mean RLU ± S.E.M. (n = 5). * represents a statistically significant difference (p ≤ 0.05) between males and females.

Total RNA was isolated from kidneys of –2-, 0-, 5-, 10-, 25-, 30-, and 45-day-old mice, and analyzed by the bDNA signal amplification assay for Oct1 and 2, and Octn1 and 2 mRNA expression. The data are presented as mean RLU ± S.E.M. (n = 5). * represents a statistically significant difference (p ≤ 0.05) between males and females.

Total RNA was isolated from livers of –2-, 0-, 5-, 10-, 25-, 30-, and 45-day-old mice, and analyzed by the bDNA signal amplification assay for Oct1 mRNA expression. The data are presented as mean RLU ± S.E.M. (n = 5). * represents a statistically significant difference (p ≤ 0.05) between males and females.
Discussion
Tissue distribution of six organic cation transporters in mice, namely Oct1-3 and Octn1-3, were examined in this study. Most studies in the literature concerning the tissue distribution of Octs have been limited to a few tissues, and were not quantitative. These previous studies have primarily been performed with rat and human tissues, with limited data available for mice. The mouse is becoming a more common laboratory species because of the availability of the mouse genome sequence as well as transgenic and gene-knockout mice. Therefore, in the present study, we evaluated the relative distribution of the mRNA of Octs in 14 tissues in mice.
Data from this study demonstrate that Oct1 mRNA expression is highest in kidney and liver, followed by the small intestine (Fig. 1). These results agree with previous reports of the mRNA distribution of Octs in rats (Grundemann et al., 1994, 1997; Urakami et al., 1998; Wu et al., 1998a; Slitt et al., 2002). In humans, Oct1 mRNA seems to be expressed in liver but not in kidney (Gorboulev et al., 1997; Zhang et al., 1997). This represents a major difference in Oct1 tissue distribution between rodents and humans. The lack of Oct1 expression in human kidney might cause major differences in the pharmacokinetics of Oct substrates compared with rodents. The developmental expression of Oct1 was evaluated in kidneys and liver because these tissues have the highest Oct1 mRNA expression levels. Oct1 mRNA expression in both kidney and liver gradually increased from 2 days before birth to 22 days after birth and remained relatively constant thereafter (Figs. 3 and 4).

Total RNA was isolated from kidneys of wild-type (intact) mice, untreated mice, gonadectomized (Gonad) mice, gonadectomized mice treated with E2 (Gonad + E2), and gonadectomized mice treated with DHT (Gonad + DHT), and analyzed by the bDNA signal amplification assay for Oct2 mRNA expression. The data are presented as mean RLU ± S.E.M. (n = 5). * and † represent a statistically significant difference (p ≤ 0.05) between males and females, and control and treated animals, respectively.
The present study indicates that kidney is the organ in mice with the predominant expression of Oct2. This finding is consistent with previous data from rats (Okuda et al., 1996; Grundemann et al., 1997; Urakami et al., 1998, 1999; Wu et al., 1998a) and humans (Gorboulev et al., 1997). In contrast to Oct1, the tissue distribution of Oct2 is similar among all three species. Oct2 mRNA expression is gender-dependent; the expression of Oct2 mRNA in female mice is approximately half that in males (Fig. 1). This gender difference is not evident until the mice are 3 weeks of age (Fig. 3). In gonadectomized mice, expression of Oct2 mRNA in males was down-regulated to levels detected in female mice. DHT administration to gonadectomized animals restored the male mRNA expression to the same level as in intact animals and also up-regulated the female mRNA expression (Fig. 5). Together, these data indicate that male sex hormones are responsible for the higher expression of Oct2 in male mice. The role of sex hormones in regulating Oct2 expression has been examined in rats. Oct2 expression was suppressed by estrogens and enhanced by androgens, which results in a gender bias in Oct2 expression in favor of males (Urakami et al., 1999, 2000; Slitt et al., 2002).
Oct3 mRNA was expressed at low levels in most tissues of mice. The highest expression of Oct3 mRNA was found in placenta and ovaries, whereas lower levels were detected in uterus, heart, lung, brain, and ileum (Fig. 1). This high expression of Oct3 in placenta, and its widespread expression at low levels in many tissues, is in agreement with previous data in rats (Kekuda et al., 1998; Wu et al., 1998a; Slitt et al., 2002), mice (Verhaagh et al., 1999), and humans (Verhaagh et al., 1999; Wu et al., 2000b). This widespread expression of Oct3 supports its role for the non-neuronal uptake of monoamine neurotransmitters in both the central nervous system and peripheral tissues. Like Oct2, Oct3 tissue distribution has a similar pattern across rodents (mice and rats) and humans.
Oct1-3 share high similarity in their cDNA nucleotide sequence and their predicted amino acid sequence. When Octn1 was cloned, it was annotated differently (Octn instead of Oct) because of the low homology in amino acid sequence with the known members of Octs 1 to 3 (30% similarity). Also, Octn1 is functionally different by being pH-dependent rather than potential-dependent, as are Oct1-3. In the present study, Octn1 mRNA was ubiquitously expressed in most tissues; the only tissue with essentially no expression was the liver (Fig. 2). The highest expression of Octn1 was in kidney, small intestine, and heart. In rats, Octn1 mRNA had a similar tissue distribution (Wu et al., 2000a; Slitt et al., 2002). However, another study reported high expression of Octn1 mRNA in liver, besides kidney and small intestine, in rats (Wu et al., 2000a). In humans, Octn1 mRNA has been reported to be highly expressed in kidney and bone marrow, whereas it is moderately expressed in skeletal muscle, lung, and placenta, has low expression in small intestine, heart, spleen, and uterus, and is undetected in liver (Tamai et al., 1997). Despite the differences in Octn1 tissue distribution among the three species, it seems that Octn1 is most highly expressed in kidney and intestines of all species, but is expressed at low levels in most other tissues.
Like Octn1, Octn2 transports organic cations in a Na+-independent manner. In contrast, Octn2 transports carnitine in a Na+-dependent manner (Ohashi et al., 1999; Wu et al., 1999). Octn2 mRNA expression in mice is high in kidney, moderate in small intestine, and present at low levels in other tissues. The tissue distribution of Octn2 in mice is similar to that for rats (Slitt et al., 2002). A previous study in mice reported high and equivalent Octn2 mRNA expression in testis, kidney, and liver, and low expression in heart (Tamai et al., 2000). In contrast, Western blot analysis in the same study indicated the highest Octn2 protein in kidney, a moderate level in liver and heart, and the lowest level in testes. In humans, Octn2 is highly expressed in kidney, skeletal muscles, placenta, heart, and pancreas, with no expression in liver (Wu et al., 1998b; Tamai et al., 2000). There are major differences in the Octn2 tissue distribution patterns among the three species; however, Octn2 seems to be primarily expressed in kidney in the three species: rats, mice, and humans.
Octn2 is thought to play a major role in the high affinity Na+-dependent (Wu et al., 1999) carnitine uptake. Certain mutations (Tang et al., 1999) in the Octn2 gene result in premature stop codons, and, consequently, the mutant gene produces truncated proteins that cause primary systemic carnitine deficiency syndrome (SCD) (Inano et al., 2003), which is associated with cardiomyopathy, skeletal muscle myopathy, and hypoglycemia (Tamai et al., 2000). SCD symptoms are treated with l-carnitine supplementation, despite the defect in the Octn2 transporter (Horiuchi et al., 1993; Tein, 2003). Therefore, alternative pathways are speculated to compensate for the defect in Octn2 (Tamai et al., 2000). Carnitine administration might also up-regulate the expression of these alternative carnitine transporters. A mutant mouse strain that exhibits a SCD phenotype [jvs (juvenile visceral steatosis)] also has a mutated Octn2 and a functional loss of Octn2 (Koizumi et al., 1988).
Octn3 mRNA expression was highest in testes of mice; low levels were detected in ovary, ileum, and jejunum. The almost exclusive expression of Octn3 in testes has also been reported for humans (Enomoto et al., 2002). In mice, Octn3 protein expression is primarily found in testes and is very weakly expressed in kidney (Tamai et al., 2000). The present data suggest that Octn3 is predominantly expressed in testes. Therefore, Octn3 seems to be responsible for the uptake of carnitine into testes and, eventually, into sperm. Octn3 has a higher selectivity for carnitine transport than Octn1 or Octn2; Octn3 has little or no affinity for organic cation model compounds, e.g., TEA, and is the only Octn to transport carnitine in a Na+-independent manner. Therefore, Octn3 is distinct from Octn1 and Octn2 in both tissue distribution and substrate specificity. Carnitine is important for the maturation of spermatozoa into fertile and motile sperm (Jeulin and Lewin, 1996; Enomoto et al., 2002). Clinical administration of carnitine results in an increase in sperm number and motility (Enomoto et al., 2002). Therefore, Octn3 is indeed a potential target for male infertility screening and treatment. Mutations in Octn3 have also been suggested to represent a risk factor in inflammatory bowel diseases, which may be responsive to carnitine therapy (Lamhonwah et al., 2003).
In summary, the present data demonstrate the relative tissue distribution of Oct1-3 and Octn1-3 mRNA in 14 tissues of mice. Oct mRNA expression was highest in kidney, except for Oct3, which was mainly expressed in placenta and female sex organs, and Octn3, which was primarily expressed in testes. Oct1 was mainly expressed in kidney, followed by liver. Oct2 was almost exclusively expressed in kidney. Oct2 expression was higher in male than female kidneys, because of its induction by testosterone. Oct3 was mainly expressed in placenta and uterus. Octn1 was mainly expressed in kidney, intestine, and heart. Octn2 was mainly expressed in kidney and intestine. Octn3 was almost exclusively expressed in testes. With the exception of Oct1, Octs show similar tissue distribution patterns among mice, rats, and humans. Finally, all Octs reached adult mRNA expression levels in mice at 3 to 4 weeks after birth.
Acknowledgments
We thank David Buckly, Peizhen Song, Xiaohong Lei, and Drs. Chuan Chen and Hong Lu for technical assistance.
Footnotes
-
This work was supported by National Institutes of Health Grants ES-09649 and ES-07079.
-
Article, publication date, and citation information can be found at http://dmd.aspetjournals.org.
-
doi:10.1124/dmd.105.006932.
-
ABBREVIATIONS: Oct, organic cation transporter; Octn, carnitine Oct; TEA, trimethylamine; bDNA, branched DNA; E2, 17β-estradiol; DHT, 5α-dihydroxytestosterone; SCD, systemic carnitine deficiency syndrome; RLU, relative light unit(s).
- Received August 20, 2005.
- Accepted December 14, 2005.
- The American Society for Pharmacology and Experimental Therapeutics


