


Abstract
The challenge of predicting the metabolism or toxicity of a drug in humans has been approached using in vivo animal models, in vitro systems, high throughput genomics and proteomics methods, and, more recently, computational approaches. Understanding the complexity of biological systems requires a broader perspective rather than focusing on just one method in isolation for prediction. Multiple methods may therefore be necessary and combined for a more accurate prediction. In the field of drug metabolism and toxicology, we have seen the growth, in recent years, of computational quantitative structure-activity relationships (QSARs), as well as empirical data from microarrays. In the current study we have further developed a novel computational approach, MetaDrug, that 1) predicts metabolites for molecules based on their chemical structure, 2) predicts the activity of the original compound and its metabolites with various absorption, distribution, metabolism, excretion, and toxicity models, 3) incorporates the predictions with human cell signaling and metabolic pathways and networks, and 4) integrates networks and metabolites, with relevant toxicogenomic or other high throughput data. We have demonstrated the utility of such an approach using recently published data from in vitro metabolism and microarray studies for aprepitant, 2(S)-((3,5-bis(trifluoromethyl)benzyl)-oxy)-3(S)phenyl-4-((3-oxo-1,2,4-triazol-5-yl)methyl)morpholine (L-742694), trovofloxacin, 4-hydroxytamoxifen, and artemisinin and other artemisinin analogs to show the predicted interactions with cytochromes P450, pregnane X receptor, and P-glycoprotein, and the metabolites and the networks of genes that are affected. As a comparison, we used a second computational approach, MetaCore, to generate statistically significant gene networks with the available expression data. These case studies demonstrate the combination of QSARs and systems biology methods.
Predicting the metabolism and toxicity of a drug in humans can use resources that include in vivo animal models, in vitro systems, and high throughput genomics and proteomics methods (Gerhold et al., 2001; Thomas et al., 2001) to generate empirical data for analysis and decision making. The amount and complexity of the data being generated are increasing, requiring not only judicious decisions about which experimental methods to use but also novel tools for visualization and analysis. More recently, within drug disposition and toxicology, in vitro approaches for generating data with drug-metabolizing enzymes, transporters, ion channels, and receptors have been used for computational approaches, including quantitative structure-activity relationships (QSARs) (Ekins and Swaan, 2004). These methods have been used widely and applied for predicting absorption, distribution, metabolism, excretion, and toxicity (ADME/Tox) (Ekins et al., 2005d) properties, at the level of either the individual protein (e.g., P450s; Balakin et al., 2004a,b) or specific properties (e.g., absorption; Zhao et al., 2001; Niwa, 2003). Many of these ADME/Tox proteins are also known to be regulated by nuclear hormone receptors or other transcription factors.
We are also currently witnessing the beginning of a new approach, which aims to understand organisms from computationally generated networks of protein and ligand interactions (Barabasi and Oltvai, 2004). To this point, high throughput data such as those derived from microarrays, have mainly been visualized by clustering approaches (Eisen et al., 1998), which limit associations to the actual genes on the microarray and provide little, if any information on the relationship of the genes to each other. In contrast, network-building tools such as MetaCore (Ekins et al., 2005b) enable the analysis of such data in the context of all known interactions when using a database as the source. Various software resources have been applied to modeling the networks of nuclear hormone receptors and their connections with additional genes and small molecules, using a manually curated database (Ekins et al., 2005c). A second study has indicated how a natural language-processing method, CCNet, was used to show the genes regulated by the nuclear hormone receptor, farnesoid X receptor (Apic et al., 2005). These automated methods enable a more complete understanding of the complexity of these transcriptional factors (Ekins et al., 2002; Ulrich, 2003; Plant, 2004). Ultimately, the pathways generated rely on the quality of the content of the underlying database of literature interactions. These networks can also be used to overlay and explain experimental data from genomic and proteomic studies to further aid in analysis of these complex data. Hence, we are seeing a convergence of the different methods described above to create a field we have termed systems-ADME/TOX (Ekins et al., 2005d).
We have built on the previously described efforts to generate networks of nuclear hormone interactions (Ekins et al., 2005c) as well as interpret microarray data for MCF-7 cells treated with 4-hydroxytamoxifen (OHT) and estrogen (Ekins et al., 2005c; Nikolsky et al., 2005) to develop and apply a novel method for systems-ADME/TOX (Ekins et al., 2005d). This method uses a subset of the MetaCore database, which is considerably enhanced with the previously described key drug-metabolizing enzymes, their substrates, nuclear hormone receptors, and other ADME/Tox-related proteins, to represent the backbone of the system termed MetaDrug. In addition, we have used integrated human drug metabolism reactions (Korolev et al., 2003) and QSAR methods (Ekins et al., 2003; Balakin et al., 2004a,b) to enable the inference of potential interactions from an input molecular structure. These predicted interactions can also be visualized on networks alongside the empirical data and high throughput data (such as microarray) when available. Because there are only a very limited number of molecules for which there is a complete published dataset for drug metabolism including characterization of the enzymes involved and microarray or other high throughput data, we were restricted to datasets with a combination of human or animal data, which we recognize is far from ideal. However, using mechanisms within both MetaDrug and MetaCore to map gene orthologs for different species, we are able to visualize these data. This mixture of data types, sources, and species also presents some difficulty for interpretation because of the differences in metabolism and toxicity between species, but there are currently few alternatives available, unless one has the resources available in a pharmaceutical company to generate such complete datasets. We have therefore analyzed recently published data from in vitro and microarray studies as test cases with this MetaDrug system. This preliminary study provides examples of how the integration of a database of ADME/Tox information, metabolism rules, and QSAR methods may be used to generate predictions and analyze experimental microarray data relevant to drug disposition and toxicity.
Materials and Methods
Data Annotation and Software Programming. The development of the underlying MetaCore and MetaDrug databases (GeneGo, St. Joseph, MI) has been described in detail previously (Ekins et al., 2005b,c; Nikolsky et al., 2005). For example, MetaDrug is an interactive, manually annotated database derived from literature publications on proteins and small molecules of relevance to drug disposition and toxicology in humans. MetaDrug was developed with an Oracle version 9.2.0.4 Standard Edition (Oracle, Redwood Shores, CA)-based architecture for the representation of biological functionality and integration of functional, molecular, or clinical information (Bugrim et al., 2004). Both MetaDrug and MetaCore software runs on an Intel-based 32 bit server running RedHat Linux Enterprise 3 AS (RedHat, Raleigh, NC), and the web server ran Apache 1.3.x/mod_perl (http://perl.apache.org/start/index.html). Software on the server side was written in Perl, whereas the client side required HTML/JavaScript and the Macromedia Flash Player Plug-in (Macromedia Inc., San Francisco, CA).
In addition to the database of ADME/Tox-related proteins and small molecules within MetaDrug, we have integrated cheminformatics tools by incorporating the Accord (Accelrys, San Diego) Oracle plug-in for searching and querying the molecular structure database. A ChemDraw ActiveX version 8 or higher plug-in (CambridgeSoft, Cambridge, MA) for structure sketching is also integrated into the MetaDrug interface. Approximately 70 human metabolic reaction rules (Supplemental Table 1, available online) are included in MetaDrug and represent an expanded version of the subset of rules previously published (Korolev et al., 2003). These metabolic reactions now include many other phase I and II reactions that have been described elsewhere (Ekins et al., 2005a). The prioritization of metabolites was achieved using a modified version of the method described previously (Boyer and Zamora, 2002), in which we have used the MetaDrug database to calculate the occurrence frequency of metabolites relating to the reaction rules. This occurrence frequency is then assigned as a negative log value to predicted molecules; the larger the score, the higher the frequency of similar metabolites observed in our database of literature metabolic information for humans. These rules were coded in a Perl script file used by the proprietary MetaDrug software. The panel of QSAR models (Ekins et al., 2005a) was generated using published data for various P450s (Korolev et al., 2003), transporters, ion channels, and nuclear hormone receptors (Ekins and Swaan, 2004) gathered from many sources. These data were then used with a recursive partitioning tool, ChemTree (GoldenHelix, Boseman, MT) (Young et al., 2002; Ekins et al., 2003) to generate the proprietary models stored in MetaDrug. The QSAR models were also validated by leaving groups out or using other external test sets. The correlation or Spearman's Rho value was then used as an assessment criterion for model utilization. These QSAR models were integrated into MetaDrug, such that after sketching a molecule or selecting a file of structures, it could then be processed to generate metabolites and QSAR predictions as defined by the user. The similarity of the input molecules to those in the individual QSAR model training sets was calculated using the Tanimoto coefficient (Willet, 2003) with Accord software. The Tanimoto coefficient is: a/(a + b + c), where a = the number of bits common to both the query and target structures, b = the number of bits exclusively in the query structure, and c = the number of bits exclusively in the target structure. In this case, a value of 1 indicates that the molecule is identical to 1 in the training set. As this value decreases, the less similar the molecule is to molecules in the training set. The proteins in the MetaDrug database that relate to the specific QSAR models, e.g., CYP3A4, were linked such that predictions could then be visualized as a network of interactions radiating from that protein. ChemTree was also integrated into MetaDrug to allow the user to generate QSAR models for integration within the software from their own data. MetaDrug and MetaCore can be freely evaluated by contacting GeneGo (www.genego.com).
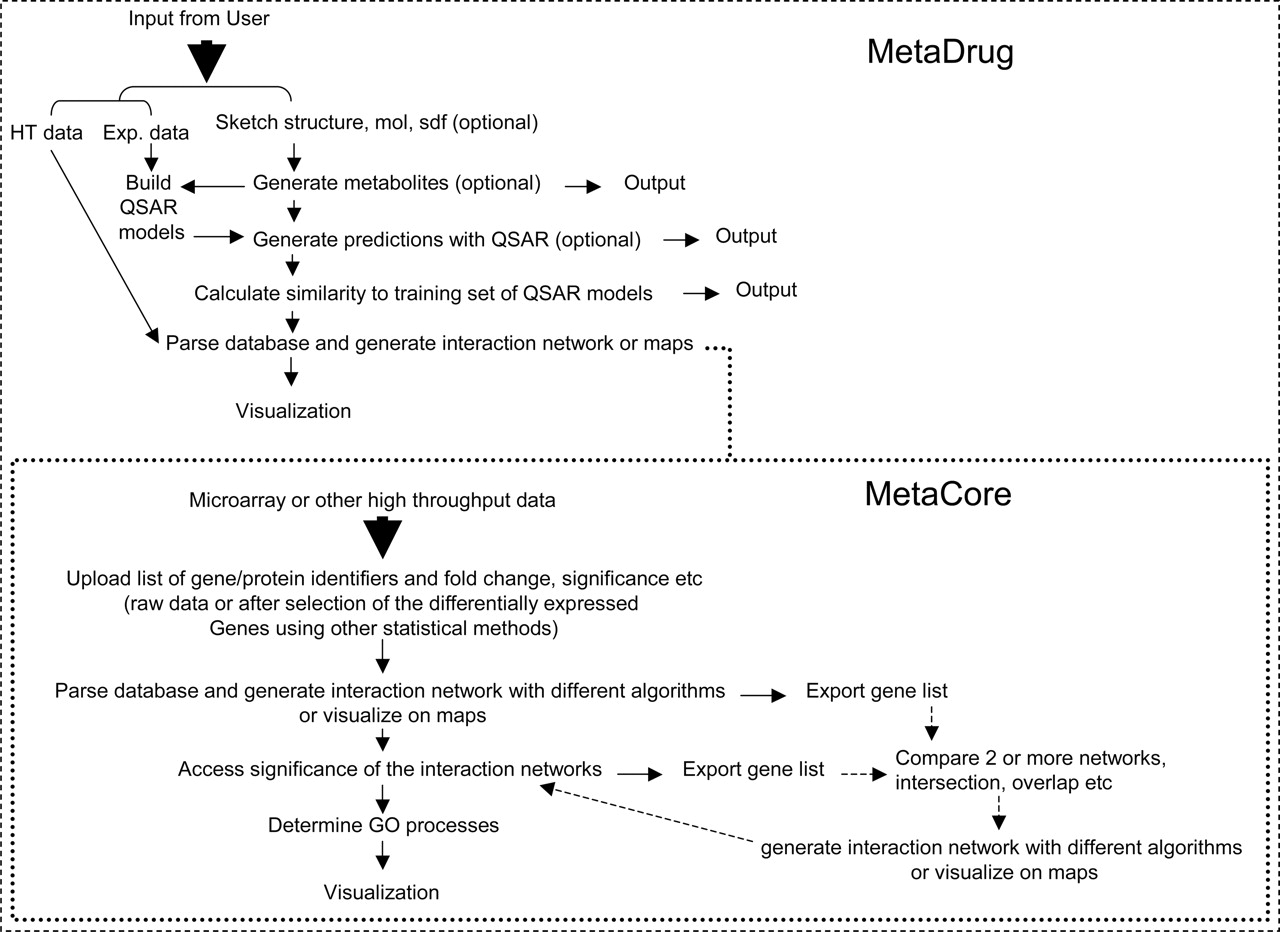
Generation of Metabolite and QSAR Model Predictions. Molecules were either sketched in the ChemDraw plug-in window or loaded from an mol or sdf file (Fig. 1). The molecules (Fig. 2) were then processed through the user-defined metabolite rules and QSAR models developed with literature data (P450s, P-gp, PXRs, etc.) (Balakin et al., 2004a,b). The user can specify which metabolic reaction rules and QSAR models are used as well as the upper and lower prediction thresholds as a means to filter the molecules before visualizing on networks. The previously described network-building algorithms (Ekins et al., 2005c) are used for visualizing the predicted interactions of metabolites or input molecules with the related proteins in MetaDrug. We were able to use the known molecules with metabolic pathways to test the software and predict interactions with these proteins as a network (Ekins et al., 2005a).
Visualization of Microarray Data on Gene Networks in MetaDrug. We have previously described how data from microarray studies can be imported into MetaDrug on the client side as a tab-delimited file (Ekins et al., 2005c). In this study, we have used microarray data from livers of rats after treatment with L-742694 (structurally similar to aprepitant) (Hartley et al., 2004), human hepatocytes treated with trovofloxacin (Liguori et al., 2005), and G0-arrested MCF-7 breast cancer cells treated with OHT (Hodges et al., 2003). In addition, we have visualized the TaqMan real-time PCR data for human hepatocytes and LS174T cells treated with artemisinin (Burk et al., 2005) or other artemisinin analogs (Efferth and Oesch, 2004). In most cases, it is possible to extract the significant up- or down-regulated genes with the accession numbers from the pdf files of the publication (Hartley et al., 2004); in other cases, the data could be downloaded (Hodges et al., 2003) from the National Institute of Environmental Health Sciences website (http://dir.niehs.nih.gov/microarray/datasets/home-pub.htm) or extracted from supplemental files (Liguori et al., 2005) before it was imported into MetaDrug. In some cases it was necessary to convert the gene identifiers from accession numbers to Locuslink identifiers using DAVID (Dennis et al., 2003). The expression intensity values could then be uploaded in MetaDrug to generate a gene network using the “auto expand” network algorithm.

The process flow for using MetaDrug. HT data, microarray-type data but could also be used with in vitro screening data.
The auto expand algorithm starts with a number of root nodes as specified by the user and builds subnetworks around every object from the uploaded set consisting of nearest neighbors. The expansion halts when the subnetworks intersect. The objects that do not contribute to connecting subnetworks are automatically truncated, and there is no user control over the size of the network. Each connection represents a direct, experimentally confirmed, physical interaction between the objects. If a user is building a network around one node only, the network generally consists of the nearest neighbors and their connections within 1 to 2 steps. The auto expand algorithm provides a means to look up one or more genes of interest and identify regulatory cascades that lead to or from the gene(s) of interest. These networks may become quite complex, so it is likely that some filtering may be necessary to simplify the visualization.
Microarray data from rats are mapped onto the human networks using the gene ortholog information within MetaDrug. In some cases, it was also possible to visualize predicted metabolite interactions with proteins and overlay the experimental expression data simultaneously.
Visualization of Microarray Data on Gene Networks in MetaCore and Statistics. MetaDrug contains a subset of the MetaCore database of manually annotated interactions as well as only two of the seven currently available algorithms. Therefore, we have used all of the available microarray data gene lists previously analyzed with the MetaDrug auto expand algorithm and additionally analyzed them in MetaCore using the “analyze networks” algorithm. This algorithm builds on the Dijkstra's “shortest path” algorithm, taking a list of root nodes and, for each node, creating shortest paths networks to the other root nodes in the list; it stops the network at a size defined by the user in the advanced options. This process is repeated iteratively until every node from the list is included in at least one network. The end result of this is that it essentially fragments the “supernetwork,” using the chosen nodes, down into subnetworks. Each subnetwork is associated with a Z-score, a G-score, and a p value, which rank the subnetworks according to saturation with the objects from the initial gene list. The Z-score ranks the subnetworks of the analyze network algorithm with regard to their saturation with genes from the experiment. A high Z-score means the network is highly saturated with genes from the experiment. The G-score combines the Z-score and the sum of the squares of the interactions to and from each of the nodes not related to the initial list. The value for the K coefficient can be specified in the advanced options section for the analyze network algorithm. The G-score downgrades the Z-score if there are high degree nodes that are not from the experiment in the subnetwork. Thus, in general, a highly positive G-score means the network is highly saturated with genes from the experiment and the network contains few to no high degree nodes not in the experiments; and a highly negative G-score means there are many high degree nodes in the network that are not from the experiment. The p value is used to initially rank the subnetworks. The p values throughout MetaCore, for maps, networks, and processes, are all calculated using the same basic formula: a hypergeometric distribution in which the p value essentially represents the probability of particular mapping arising by chance, given the numbers of genes in the set of all genes on maps/networks/processes, genes on a particular map/network/process, and genes in the experiment. This function uses the same variables as the Z-score. The equation for the Z-score, G-score, and p value calculations is described below. 
 where N = total number of nodes in MetaCore database; R = number of the network's objects corresponding to the genes and proteins in your list; n = total number of nodes in each small network generated from your list; r = number of nodes with data in each small network generated from your list; Vi = number of links to/from the i-th node; {n/r} denotes the set of nodes in a small network that are not related to the user's list; and K = user-specified coefficient, used to “demote” networks with high degree nodes that do not correspond to genes/proteins in the user's list
Gene-ontology processes are also mapped to the gene list and individual networks (see below). The analyze networks algorithm is also used with raw data to present multiple pathways that may be statistically feasible for connecting the nodes from the input list with other nodes in the database via shortest pathways. The advantage of this network is that it may find a well connected cluster of root nodes without any predefined restrictions from the user and, therefore, presents more flexibility in the connections possible.

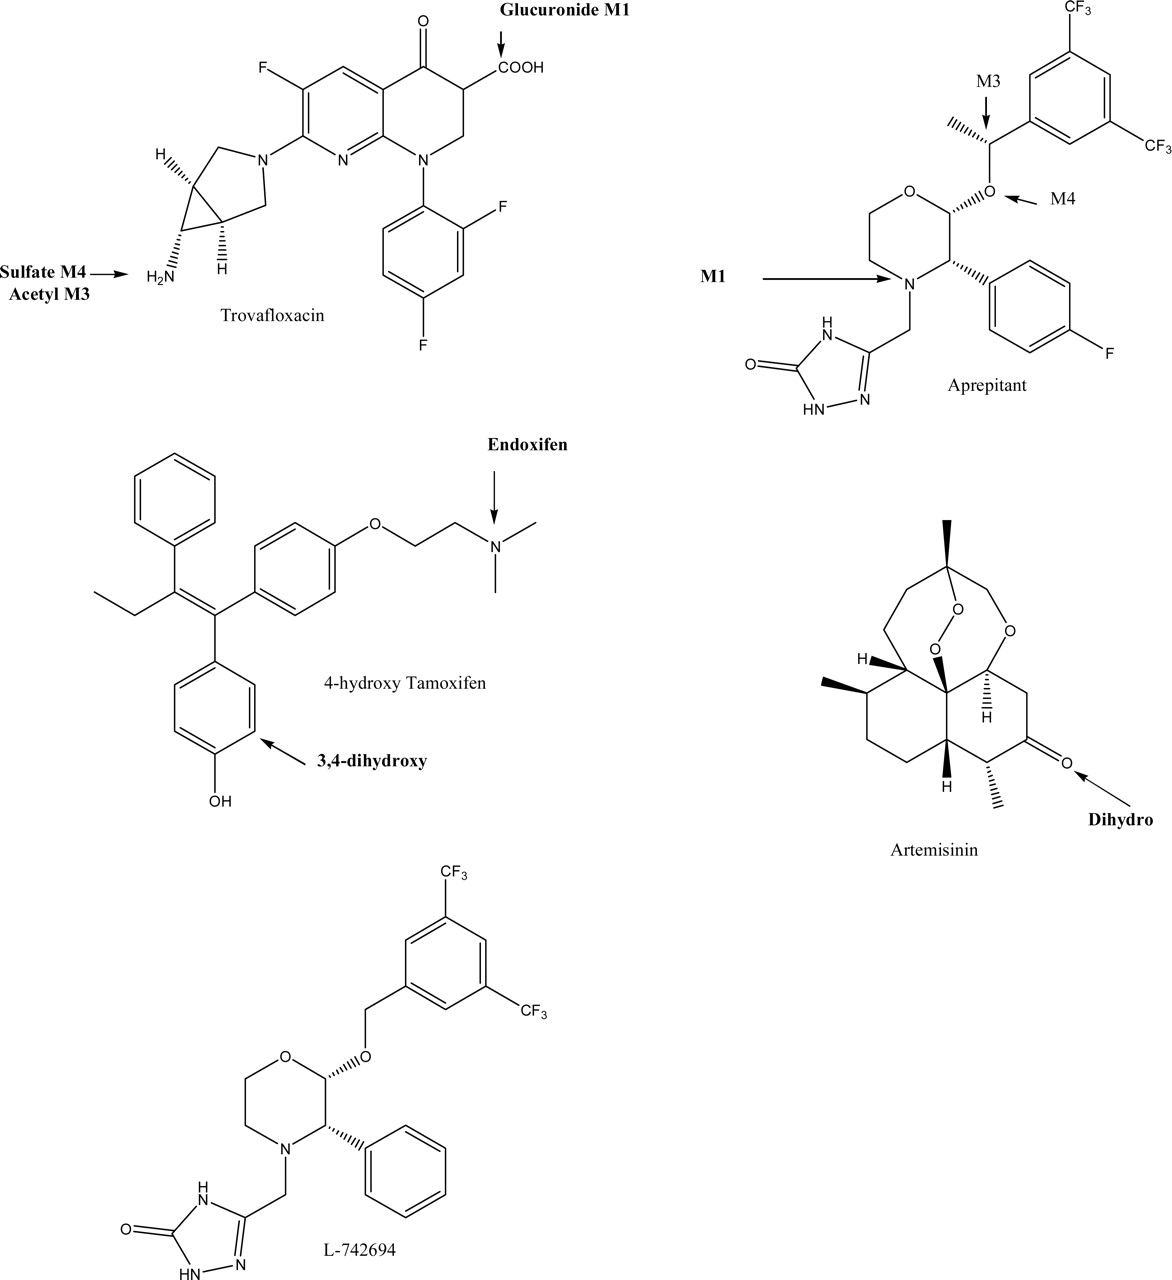
Molecules tested in this study with metabolites discussed in the text. Those highlighted in bold were predicted by MetaDrug.
Results
Generation of Metabolite and QSAR Model Predictions. In the current study, we have used the MetaDrug platform (Fig. 1) to generate metabolism and QSAR predictions for aprepitant, L-742694, trovofloxacin, OHT, and artemisinin. With aprepitant, MetaDrug produced 37 possible metabolites, including one of the four initial metabolites recently identified, namely, the major initial metabolite aprepitant M1 (predicted log OC–1). Aprepitant was predicted to have a relatively high affinity for CYP3A4 Km (predicted, 15 μM; similarity score = 0.78), CYP3A4 Ki (predicted, 13.5 μM; similarity score = 0.78), and interaction with PXR (predicted to bind, probability = 0.89; similarity score = 0.77). In the latter case, using this classification model, values closer to 1 represent PXR ligands and values closer to 0 are unlikely to be PXR ligands. In contrast, 36 possible metabolites were predicted for L-742694, which was indicated to have an affinity for CYP3A4 Km (predicted, 14.8 μM; similarity score = 0.75) CYP3A4 Ki (predicted, 8.1 μM; similarity score = 0.76) and interaction with PXR (predicted to bind, probability = 0.58; similarity score = 0.77). MetaDrug produced 34 metabolites for trovafloxacin, including the major circulating metabolite trovafloxacin glucuronide M1 (predicted log OC–0.9), acetylated trovafloxacin M3 (–1.3), and trovafloxacin sulfate M4 (predicted log OC–2.46). MetaDrug produced 28 metabolites for OHT, including endoxifen (predicted log OC–1) and 3,4-dihydroxytamoxifen (predicted log OC–0.97). OHT had a relatively high affinity for CYP3A4 Km (predicted, 55 μM; similarity score = 1), is also an inhibitor for P-gp (predicted, 15.1 μM; similarity score = 0.81), is further metabolized by phenol and estrogen sulfotransferases (SULT1A1; Km model predicted, 17.4 μM; similarity, 1), and is an inducer of PXR (predicted to bind; probability, 0.90; similarity score = 1). MetaDrug produced 17 metabolites for artemisinin, including dihydroartemisinin (log OC–5) and many hydroxylated metabolites (log OC–0.81). In addition, predictions with various QSAR models indicated that CYP2B6 (13.4 μM; similarity 0.63), CYP3A4 (60.2 μM; similarity 0.7), PXR (predicted to bind; probability = 0.94, similarity 0.63), P-gp substrate (0.53, similarity 0.7), and P-gp inhibitor (64.5 μM; similarity 0.7) were important.

Network visualizations. Aprepitant (pink hexagon)-predicted interactions and microarray data for L-742694. Microarray expression data are overlaid on the key proteins involved in drug metabolism after rat treatment with L-742694 (Hartley et al., 2004) (red circles, up-regulation). Interaction types between nodes on the network are hidden for purposes of clarity. Highlighted lines show predicted interactions. Ligands (purple hexagons) linked to transfactors (red), enzymes (yellow arrows), and transporters (blue) from the MetaDrug database. Highlighted lines show predicted interactions. Small colored hexagons on network edges represent functional interactions (green = positive, red = negative, black = unspecified effects).
Visualization of Microarray Data on Gene Networks in MetaDrug. Microarray data from rat livers after treatment with L-742694 were uploaded into MetaDrug, and 17 of 44 gene identifiers were mapped in the database (Hartley et al., 2004). These genes had been identified from a 25K rat microarray for which a p value (<0.01) and a magnitude of regulation (log 10 ratio >0.5) were considered significant (Hartley et al., 2004). After generating a network, these data were visualized alongside the predicted interactions derived computationally from the QSAR models for the similar molecule, aprepitant (Fig. 3). In this case, CYP3A4 was up-regulated in the experiment, with L-742694 indicative of induction, and this enzyme was also predicted to metabolize aprepitant. Microarray data from human hepatocytes treated with trovafloxacin (Liguori et al., 2005) were uploaded into MetaDrug, and 87 of 141 gene identifiers were mapped in the database. These genes had been selected from an Affymetrix human genome U133A array in which a p value less than or equal to 0.01 was considered significant (Liguori et al., 2005). In this case, the microarray data do not appear to have a direct impact on drug metabolism (data not shown). Microarray data from human MCF-7 cells treated with OHT (Hodges et al., 2003) were uploaded into MetaDrug, and 1446 of 1617 gene identifiers were mapped in the database (Supplemental Fig. 1A). These data were obtained raw from the microarray studies previously published (Hodges et al., 2003). Both CYP3A4 and P-gp (MDR1) were up-regulated in this dataset, indicating that this molecule may regulate its own transport and metabolism. TaqMan real-time PCR data for human hepatocytes and LS174T cells treated with artemisinin demonstrated induction of CYP3A4, CYP2B6, and MDR1 (Burk et al., 2005). This small dataset of uploaded genes was uploaded after assigning LocusLink identifiers. Three of three genes were accessible (Supplemental Fig. 1B). A second dataset used the National Cancer Institute mRNA expression data in 60 cell lines after treatment with artemisinin and related compounds (Efferth and Oesch, 2004). These genes were selected from an initial list of 170 genes after cluster analysis into three groups using the complete linkage method, in which mRNA expression correlated with cytotoxicity IC50 data (Efferth and Oesch, 2004). The genes in clusters 1 and 2 were uploaded in MetaDrug, and 28 of 36 genes were mapped in the database, some of which were present on the network of predicted interactions (Supplemental Fig. 1C).
Visualization of Microarray Data on Gene Networks in MetaCore. The same microarray datasets uploaded in MetaDrug, previously, were evaluated in MetaCore with the analyze network algorithm. The most statistically significant network based on the p value (in parentheses), as described above, was generated in all cases. For L-742694, 17 of 44 genes were uploaded, and this gene list was mapped onto the following GO processes using an approach similar to the EASE tool (Hosack et al., 2003): xenobiotic metabolism (9.12e–13), steroid metabolism (8.84e–12), electron transport (8.53e–11), lipid metabolism (1.98e–7), icosanoid metabolism (4.79e–7), metabolism (3.00e–6), estrogen catabolism (1.02e–5), retinal metabolism (2.03e–5), retinoic acid metabolism (3.38e–5), and aldehyde metabolism (5.07e–5). A network was generated from this gene list (Fig. 4A, p = 6.18e–36, Z-score 20.33) which, in turn, mapped to the following GO processes: electron transport (1.058e–20), steroid metabolism (7.31e–10), xenobiotic metabolism (1.04e–8), icosanoid metabolism (1.94e–8), lipid metabolism (8.51e–7), eye morphogenesis (1.28e–5), drug metabolism (1.32e–5), regulation of heart contraction (6.57e–5), arachidonic acid metabolism (7.89e–5), retinal metabolism (7.89e–5), retinoic acid metabolism (1.31e–4), and vitamin biosynthesis (1.31e–4). The xenobiotic metabolism GO process was also highlighted on this network (Fig. 4B).
For the trovafloxacin dataset, 87 of 141 genes were uploaded, and this gene list was mapped onto the following GO processes: signal transduction (4.37e–9), protein nucleus import (docking) (7.56e–7), intracellular signaling cascade (3.88e–5), cyclic nucleotide metabolism (8.18e–5), thioredoxin pathway (1.02e–4), cGMP-mediated signaling (3.04e–4), cGMP catabolism (3.05e–4), germ cell migration (3.05e–4), protein transport (3.05e–4), and protein-nucleus import (3.28e–4). A network was generated from this gene list (Supplemental Fig. 2A, p = 4.50e–44, Z-score 21.36) which, in turn, mapped to the following GO processes: intracellular signaling cascade (9.453e–9), signal transduction (7.398e–7), calcium ion transport (1.808e–6), dephosphorylation (6.793e–6), protein kinase C activation (9.509e–6), T-cell differentiation (3.408e–5), regulation of cell cycle (8.594e–5), G1/S transition of mitotic cell cycle (3.18e–4), learning and/or memory (4.11e–4), and transcription, DNA-dependent (4.11e–4). The intracellular signaling cascade GO process was mapped on the network (Supplemental Fig. 2B).

A, network visualization generated with MetaCore and the analyze networks algorithm using microarray expression data overlaid on proteins after rat treatment with L-742694 (Hartley et al., 2004) (red circles, up-regulation). B, GO process highlighted for xenobiotic metabolism on Fig. 3A network. Small colored hexagons on network edges represent functional interactions (green = positive, red = negative, black = unspecified effects).
For the OHT dataset, 1358 of 1617 genes were uploaded, and this gene list was mapped onto the following GO processes: protein amino acid phosphorylation (8.54e–59), regulation of cell cycle (1.76e–53), signal transduction (6.87e–45), regulation of transcription, DNA-dependent (2.33e–33), cell proliferation (1.16e–23), DNA repair (3.16e–18), organogenesis (1.61e–15), cell surface receptor-linked signal transduction (1.67e–15), protein amino acid dephosphorylation (3.09e–15), and cell adhesion (3.35e–15). A network was generated from this gene list (Supplemental Fig. 3, p = 5.19e–42, Z-score 14.98) which, in turn, mapped to the following GO processes: regulation of cell cycle (1.81e–6), positive regulation of cell proliferation (6.72e–6), estrogen receptor-overload response (1.51e–4), induction of positive chemotaxis (1.51e–4), collagen catabolism (4.11e–4), chemotaxis (4.57e–4), ovulation (5.23e–4), response to unfolded protein (6.61e–4), leading edge cell differentiation (8.90e–4), and cell motility (1.33e–3).
For the artemisinin dataset, 28 of 36 genes were uploaded, and this gene list was mapped onto the following GO processes: electron transport (3.71e–9), icosanoid metabolism (2.48e–4), regulation of signal transduction (3.09e–4), generation of precursor metabolites and energy (3.74e–4), protein metabolism (4.52e–4), protein targeting (8.07e–4), cholesterol biosynthesis (1.16e–3), steroid biosynthesis (1.56e–3), response to stress (2.64e–3), and positive regulation of cytotoxic T-cell differentiation (2.69e–3). A network was generated from this gene list (Supplemental Fig. 4A, p = 2.81e–41, Z-score 30.67) which, in turn, was mapped to the following GO processes: electron transport (1.80e–6), leading edge cell differentiation (1.08e–5), regulation of cell cycle (1.01e–4), pentose-phosphate shunt (1.57e–4), DNA repair (5.01e–4), icosanoid metabolism (9.25e–4), nucleotide metabolism (1.40e–3), cell proliferation (1.76e–3), response to oxidative stress (2.16e–3), base-excision repair (2.65e–3), negative regulation of protein kinase activity (2.65e–3), and iron ion homeostasis (3.01e–3). The oxidative stress GO process was mapped onto this network (Supplemental Fig. 4B).
Discussion
The human physiology represents a complex system, complicating our attempts at understanding changes in gene, protein, or biological activity upon drug challenge (Nicholson et al., 2004). We would not advocate that it is an impossible task to try to predict these changes as there have been an increasing number of extensive toxicogenomics datasets that have been published from which we can learn. These studies have generally applied clustering methods to interpret the data. Example datasets for molecules evaluated in this way, either in vivo in animal species, in isolated cells, or in cell lines, are accumulating, resulting in the need for accessible databases and tools for expedited analysis, data mining, and hypothesis generation. The MetaDrug database uses a novel architecture described previously (Ekins et al., 2005c), allowing the organization and visualization of biological and chemical information. This approach generates networks, which are more informative than linear pathways, as commonly described in biology text books. We have applied this database platform previously to visualize the nuclear hormone receptor interactions, providing a qualitative understanding of the current state of knowledge (Ekins et al., 2005c). We have used a second platform, MetaCore, which includes more network-building algorithms to visualize microarray data for MCF-7 cells treated with OHT and estrogen for 24 h (Hodges et al., 2003). This process enabled us to generate, compare, and subtract networks to produce signature gene networks for each molecule (Nikolsky et al., 2005).
In the current study, we have extended the MetaDrug platform beyond a database of ADME/Tox-related content to further include a rule-based method to generate predicted metabolites (Korolev et al., 2003) and QSAR methods for predicting interactions with ADME/Tox-related proteins (Balakin et al., 2004a,b; Ekins and Swaan, 2004), as well as other physicochemical properties (Ekins et al., 2005a). Recent testing of MetaDrug with 66 molecules (Supplemental Table 2, available online) indicates that we capture at least 78.8% (on average) of correctly predicted first-pass metabolites. Much earlier testing on 28 of these molecules indicated that approximately 73% of metabolites were correctly identified (Ekins et al., 2005a). However, there is still room for future improvement to minimize the number of total metabolites predicted, as well as the addition of further rules for metabolic reaction not currently captured (e.g., conjugation at the selenium atom in ebselen). The metabolism predictions for aprepitant, L-742694, trovofloxacin, 4-hydroxytamoxifen, and artemisinin, outlined earlier, included the prediction of phase II metabolites. MetaDrug therefore represents a systems-ADME/TOX platform for the prediction of metabolism and interactions from molecular structure as well as the visualization and simultaneous analysis of multiple high throughput data types (such as microarrays) (Ekins et al., 2005d). As such, the approach is highly novel, integrating not only different algorithms for predictions but also data parsers, algorithms for network generation, visualization tools, and data filters. This latter component enables the selection of genes associated with a specific species, tissue, or organelle, for example.
To demonstrate the utility of such a platform, we have analyzed several recently published datasets from in vitro and/or microarray studies for aprepitant (Sanchez et al., 2004), L-742694 (Hartley et al., 2004), trovofloxacin (Dalvie et al., 1997; Liguori et al., 2005), OHT (Crewe et al., 1997; Chen et al., 2002; Desai et al., 2002; Hodges et al., 2003; Bekaii-Saab et al., 2004; Desta et al., 2004), and artemisinin (Svensson and Ashton, 1999; Svensson et al., 2003; Efferth and Oesch, 2004; Burk et al., 2005). In all cases the data were taken from the papers after clustering or other statistical preanalysis. However, we have previously described the analysis of “raw” microarray data without the need for clustering or other similar approaches (Nikolsky et al., 2005). We have used the molecular structure of the test molecules described above with MetaDrug-generated metabolites, predictions for affinity to multiple ADME/Tox-related proteins, and auto expand gene networks of these predicted protein interactions, alongside available microarray data. These gene networks were compared with an analysis performed with MetaCore using the analyze network algorithm with all available microarray data for each compound after the clustering performed in the published papers.
MetaDrug produced 37 possible metabolites for aprepitant, including a major initial metabolite, aprepitant M1. Aprepitant was predicted to have a relatively high affinity for CYP3A4 Km (15 μM), which is comparable to the actual value (∼10 μM). Similarly, the predicted CYP3A4 Ki (13.5 μM) is close to the actual value (10 μM), and the predicted interaction with PXR may indicate that this nuclear receptor is responsible for the induction of CYP3A4 as described in the package insert for this drug (http://www.fda.gov/cder/foi/label/2003/21549_Emend_lbl.pdf). A structurally similar drug, L-742694, was shown to activate rat PXR (Hartley et al., 2004), and transcriptional profiling induced a battery of genes involved in drug metabolism and transport. These genes regulated by L-742694 are mapped on the human ortholog network derived from the QSAR predictions for aprepitant. The high Tanimoto similarity values derived for aprepitant and L-742694 for the CYP3A4 Km, CYP3A4 IC50, and PXR compared with the training sets is indicative of a high degree of structural similarity with molecules in these training sets. The microarray data from rats treated with L-742694 (Fig. 3A) enabled the visualization of up-regulated CYP3A4; CYP3A4 is known to be induced by aprepitant, which is, in turn, metabolized by this enzyme. The QSAR models predicted the role of this enzyme and, incidentally, predicted that this molecule may also bind PXR with a higher probability than the structurally similar L-742694. However, there is currently no published indication whether aprepitant binds to PXR.
MetaDrug produced 34 metabolites for trovafloxacin, including three of the four metabolites described in the literature (Dalvie et al., 1997): trovafloxacin glucuronide M1, acetylated trovafloxacin M3, and trovafloxacin sulfate M4. Microarray data from human hepatocytes treated with trovafloxacin were uploaded into MetaDrug, and 87 of 141 gene identifiers were mapped in the database. In this case, the microarray data do not appear to have a direct impact on drug metabolism pathways. MetaDrug produced 28 metabolites for OHT, including endoxifen and 3,4-dihydroxytamoxifen. OHT had a relatively high affinity for CYP3A4 Km, whereas the similarity score indicated that this molecule is in the training set of the model (Desta et al., 2004). OHT is also an inhibitor for P-gp, with a predicted IC50 (15.1 μM) quite similar to the actual value (7.4 μM) (Bekaii-Saab et al., 2004). OHT is known to be further metabolized via phenol and estrogen sulfotransferases, and in this case, the SULT1A1 Km model predicted a value of 17.4 μM, whereas the similarity calculation indicated that this molecule is in the training set (Chen et al., 2002). OHT was predicted to bind to PXR and, once again, was indicated to be present in the training set (Desai et al., 2002). Binding to PXR would be expected to increase levels of CYP3A4, which is, in turn, involved in OHT formation from tamoxifen (Crewe et al., 1997). Microarray data from human MCF-7 cells treated with OHT were uploaded and were mapped in the MetaDrug database (Supplemental Fig. 1A). Both CYP3A4 and P-gp (MDR1) were up-regulated in this dataset, once again indicating that this molecule may regulate its own transport and metabolism. MetaDrug produced 17 metabolites for artemisinin, including one of the known metabolites observed in human plasma, namely, dihydroartemisinin (Svensson and Ashton, 1999). Little else is known regarding the human in vitro metabolism of this compound. It is possible that CYP2B6 could be responsible for forming this metabolite, since this occurs in the same location as the O-deethylation of β-arteether (Grace et al., 1998), which is mediated by the same enzyme. The hydroxylation of artemisinin may also be mediated by CYP2B6, which is known to be involved in numerous metabolic reactions (Ekins and Wrighton, 1999). In addition, predictions with the various QSAR models indicated that artemisinin binds CYP2B6, CYP3A4, and PXR, and is unlikely to be a P-gp substrate (but is a weak P-gp inhibitor). These predictions are in very good agreement with the metabolism data (Svensson and Ashton, 1999; Li et al., 2003), whereas recent studies suggested that artemisinin binds PXR with an EC50 of 34 μM and inhibits P-gp-mediated digoxin transport with an IC50 of 33 μM (Burk et al., 2005). This same study generated PCR data with human hepatocytes treated with artemisinin to show the induction of CYP3A4, CYP2B6, and P-gp (Burk et al., 2005). The gene expression data can be visualized alongside the predicted interactions to show the other transcriptional regulators of these proteins (Supplemental Fig. 1B). A second dataset derived from the NCI cell lines treated with artemisinin analogs and clustered (Efferth and Oesch, 2004) was also overlapped on the same network (Supplemental Fig. 1C).
In three of the four cases presented, we were able to visualize gene expression data alongside the predicted interactions in MetaDrug using the auto expand algorithm. Using a second platform, MetaCore, we were able to use a different network-building algorithm, namely, “analyze network,” which provides multiple significant small-scale networks with statistical significance and enables the mapping of Gene Ontology data. The network with the most significant p value was then generated in all cases. These networks do not allow the user to generate predicted molecules on the networks as in MetaDrug, but they do provide considerable insight into the significance of the gene expression data. The L-742694 gene expression dataset from rat liver was mapped on the human orthologs in MetaCore and indicated a significant link with metabolism (Fig. 4, A and B) shown by the data mapped to the metabolism-based GO processes. This finding corresponds with the observation that L-742694 has an impact on the PXR-responsive gene battery and that the structurally similar aprepitant is metabolized by CYP3A4 as well as other P450s (Hartley et al., 2004; Sanchez et al., 2004). The trovafloxacin dataset was linked with many GO processes, from signal transduction to protein transport, likely to be involved as part of an oxidative stress response (Supplemental Fig. 2, A and B), which perhaps strengthens the observations made after clustering the human hepatocyte gene expression data (Liguori et al., 2005). The OHT dataset mapped onto the GO processes related to the cell cycle (Supplemental Fig. 3), which corresponds well with the microarray data from MCF-7 cells (Hodges et al., 2003). The artmesinin analog microarray dataset was linked to metabolism, cell cycle, and oxidative stress GO processes (Supplemental Fig. 4), correlating well with the observations of cytotoxicity, observed from clustering the NCI cell line data (Efferth and Oesch, 2004), and metabolism in human cells (Burk et al., 2005). The ability to highlight the genes involved with each GO process on the networks is a valuable approach for quickly identifying their position and relationships with other genes on the network. It is important to note that although we are able to map a large number of the genes uploaded into the software either directly or using DAVID, there will be future improvements in the database or the use of different identifiers instead of LocusLink (e.g., HomoloGene), which will enable more genes to be visualized. Another important consideration is the potential for species differences in receptor binding, metabolism, and toxicity. One example we have used previously to illustrate the utility of building species-specific gene networks is the drug pyrazinamide. This drug blocks NAD+ metabolism to result in the accumulation of the toxic uric acid metabolite in humans, but not in mice (Bugrim et al., 2004). We have also previously indicated how MetaDrug can be used to simulate the effect of knockout or inhibition of a target gene, by simply removing it from a network. This would then open the possibility to allow the user to consider species differences or different genotypes.
From these test cases, it is apparent that although we can suggest the majority of the major metabolites for these compounds, we either do not identify some others or predict metabolites that have not been identified to date. This will need to be rectified in future by allowing the users to add their own reaction rules to the software to generate metabolites currently missing. Overprediction will require the development of a machine-learning algorithm based on the available human metabolism data, or an expansion of the rules for metabolic pathways using reasoning (Button et al., 2003) or alternative approaches. The availability of multiple QSAR models for particular ADME properties is currently limited to the published literature available to us. The capability to generate QSAR models with the software included in MetaDrug (not discussed here) will allow the users to incorporate their own data for ADME/Tox properties or therapeutic targets, whether based around a single or multiple structural series. There is considerable flexibility in the users of this system being able to add their own biological data (e.g., in vitro screening data, or unpublished protein interactions or other biological knowledge) into the Oracle database structure to further customize MetaDrug.
In summary, we have developed and applied additional utilities that have been added to the MetaDrug software platform. This software suite now incorporates reaction rules for metabolite prediction, QSAR models, and visualization tools, in addition to a database of manually curated human ADME/Tox data. We have used this software to generate predictions for several drug-like molecules and, additionally, we have visualized the experimental gene expression data for L-742694, trovofloxacin, OHT, and artemisinin using this software. Networks were also generated with MetaCore and the analyze network algorithm to further aid in the construction of statistically significant visualizations of the gene expression data correlated with GO processes. The analyze network algorithm also has been recently added to MetaDrug because of this demonstrated utility. The MetaDrug system represents a prototype for integrative or systems-ADME/TOX that builds on the database- and network-building tools such as MetaCore. In the future, we will probably test more compounds not included in the software training sets as these data become available in the literature. At present, we are quite limited in testing the software, relying on molecules and microarray data in the public domain, and envisage that future National Institutes of Health efforts to collate such information (Waters et al., 2003) will improve future modeling and validation studies in this area. The present version of MetaDrug is focused on predicting human drug metabolism and interactions with ADME/Tox proteins, although it is likely that future versions will be required to enable predictions for other species.
Footnotes
-
Funding and Competing Financial Interest: The development of MetaDrug was supported by National Institutes of Health Grants 1-R43-GM069124-01 and 2-R44-GM069124-02 “In silico Assessment of Drug Metabolism and Toxicity”. MetaDrug and MetaCore are proprietary tools developed and licensed by GeneGo, Inc. All authors are employees of GeneGo Inc.
-
Article, publication date, and citation information can be found at http://dmd.aspetjournals.org.
-
doi:10.1124/dmd.105.008458.
-
ABBREVIATIONS: QSAR, quantitative structure-activity relationship; ADME/Tox, absorption, distribution, metabolism, excretion, and toxicity; P450, cytochrome P450; OHT, 4-hydroxytamoxifen; P-gp, P-glycoprotein; PXR, pregnane X receptor; L-742694, 2(S)-((3,5-bis(trifluoromethyl)benzyl)-oxy)-3(S)phenyl-4-((3-oxo-1,2,4-triazol-5-yl)methyl)morpholine; DAVID, database for annotation, visualization and integrated discovery.
-
↵
 The online version of this article (available at http://dmd.aspetjournals.org) contains supplemental material.
 - Received November 21, 2005.
- Accepted December 21, 2005.

- The American Society for Pharmacology and Experimental Therapeutics


