


Abstract
We explored the properties of a catenary model that includes the basolateral (B), apical (A), and cellular compartments via simulations under linear and nonlinear conditions to understand the asymmetric observations arising from transporters, enzymes, and permeability in Caco-2 cells. The efflux ratio (EfR; Papp,B→A/Papp,A→B), obtained from the effective permeability from the A→B and B→A direction under linear conditions, was unity for passively permeable drugs whose transport does not involve transporters; the value was unaffected by cellular binding or metabolism, but increased with apical efflux. Metabolism was asymmetric, showing lesser metabolite accrual for the B→A than A→B direction because of inherent differences in the volumes for A and B. Moreover, the net flux (total - passive permeation) due to saturable apical efflux, absorption, or metabolism showed nonconformity to simple Michaelis-Menten kinetics against CD,0, the loading donor concentration. EfR values differed with saturable apical efflux and metabolism (>1), as well as apical absorption (EfRs <1), but approached unity with high passive diffusive clearance (CLd) and increasing CD,0 at a higher degree of saturation of the process. The Jmax (apparent Vmax estimated for the carrier system) and  [or the
  based on a modified equation with the Hill coefficient (β)] estimates from the Eadie-Hofstee plot revealed spurious correlations with the assigned Vmax and Km. The sampling time, CLd, and parameter space of Km and Vmax strongly influenced both the correlation and accuracy of estimates. Improved correlation was found for compounds with high CLd. These observations showed that the catenary model is appropriate in the description of transport and metabolic data in Caco-2 cells.
The majority of drugs available on the market are in oral dosage forms. For the assessment of permeability and oral drug absorption, in silico models (Stenberg et al., 2001) and high throughput systems, such as the parallel artificial membrane permeability assay (Kansy et al., 1998) and cell-based systems (Hidalgo et al., 1989) exist to relate drug permeability to absorption, especially for compounds that do not undergo intestinal metabolism (Usansky and Sinko, 2005). The most popular high-throughput screening tool for drug permeability is human colon carcinoma (Caco-2) (Hidalgo et al., 1989) or transfected Madin-Darby canine kidney (Irvine et al., 1999) cells. Upon culture, Caco-2 cells differentiate and become confluent to form monolayers with tight junctions and polarized apical/mucosal (A side) and basolateral/serosal (B side) membranes that are structurally and functionally similar to those of enterocytes.
ABC efflux transporters such as P-glycoprotein (Pgp) multidrug resistance-associated protein 2 (MRP2), and the breast cancer-resistant protein (BCRP) are expressed on the mucosal membrane of Caco-2 (Hunter et al., 1993; Hirohashi et al., 2000), as are the absorptive transporters, such as the proton-coupled oligopeptide transporter (PEPT1) (Guo et al., 1999) and the organic anion transporting polypeptide (OATP) (Kobayashi et al., 2003). Likewise, on the serosal membrane, basolateral efflux transporters such as MRP3 (Hirohashi et al., 2000) and organic solute transporters α and β (OSTα-OSTβ) (Okuwaki et al., 2007) are expressed in Caco-2. In addition, multiple metabolic enzymes such as the sulfotransferases, UDP-glucuronosyltransferases (H. Sun, L. Zhang, E. C. Chow, G. Lin, K. S. Pang, Z. Zuo, unpublished data), and the glutathione S-transferases (Peters and Roelofs, 1989) reside in the Caco-2 cell monolayer. Besides, CYP3A4, which is inherently poorly expressed in the cell monolayer, may be induced by incubation with 1α,25-dihydroxyvitamin D3 or acquired by transfection of the CYP3A4 gene (Cummins et al., 2001). The Caco-2 system allows for paracellular transport (Adson et al., 1994), and Ca2+-free buffer has often been used to disrupt paracellular transport of fluorescein, a highly fluorescent probe, for assessment of the contribution of the pathway (Troutman and Thakker, 2003a). Furthermore, an unstirred water layer that can impede the transport of highly lipophilic drugs has been described for the Caco-2 cells (Hidalgo et al., 1991).

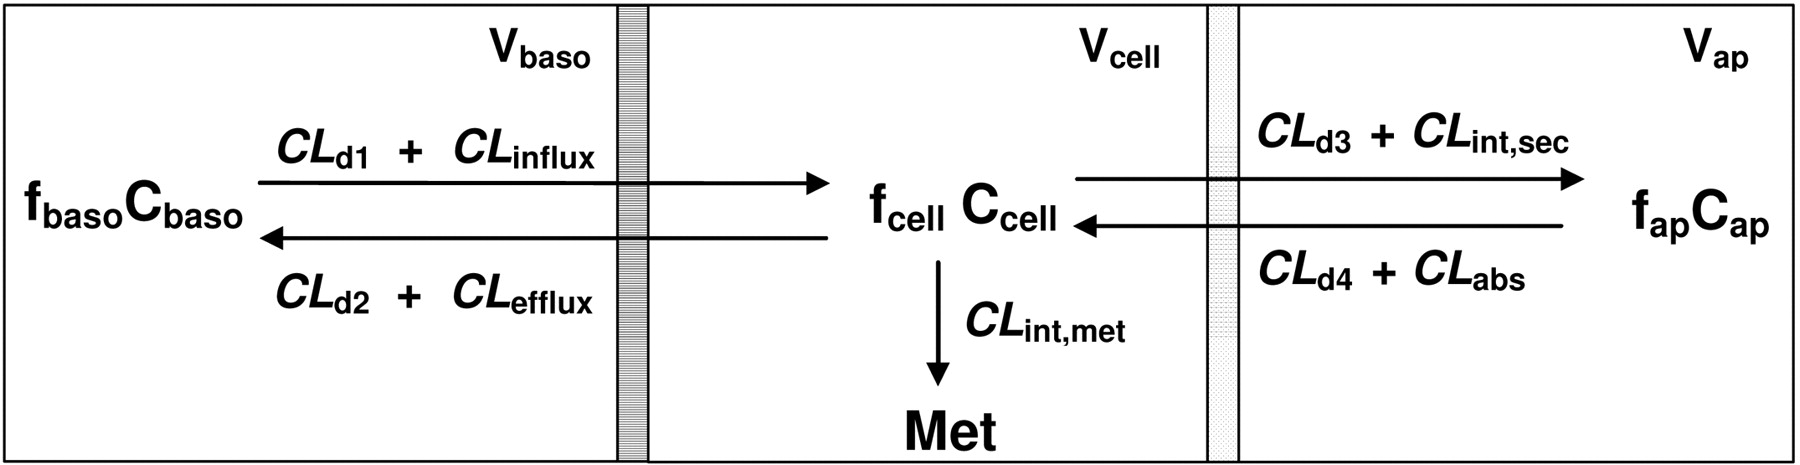
Schematic presentation of the Caco-2 cell-based system by a catenary model comprising the basolateral (baso), cell, and apical (ap) compartments. V, f, and C denote volume, unbound fraction, and the concentration of drugs of each compartment, respectively; M denotes formed metabolite(s). CLd1 and CLd2,CLd4, and CLd3 denote the influx and efflux and passive diffusion clearance on the basolateral and apical membrane, respectively. CLinflux and CLefflux represent the transporter-mediated influx and efflux intrinsic clearances on the basolateral membrane; CLabs and CLint,sec denote transporter-mediated intrinsic clearances of absorption and efflux on the apical membrane, respectively; CLint,met is the metabolic intrinsic clearance. Under nonlinear conditions, CLinflux,CLefflux,CLabs and CLint.sec, and CLint,met may be replaced by the Vmax/(Km + Cu), where Cu is the unbound drug concentration.
Cell-based permeability models have become a necessary strategy in the drug discovery paradigm (Lentz et al., 2000; Polli et al., 2001). The protocol facilitates the drug-discovery scenario to define whether new drug entities are Pgp substrates. Inhibitors such as GF120918 are used to obliterate apical efflux and identify Pgp involvement. In parallel, computational models have evolved to describe Caco-2 transport. However, most of the interpretations express simplified views and provide approximate solutions for the passive permeability coefficient, Papp, by assuming that the system is a single barrier. Even for nonlinear cases, influx or efflux at the apical membrane was simplified by viewing the system as a single barrier and assuming that drug molecules present at either the apical or basolateral compartment have direct access to intracellular enzymes or efflux transporters (Guo et al., 1999; Williams et al., 2002; Troutman and Thakker, 2003b; Tran et al., 2004).
We are of the view that the single-barrier model for the Caco-2 cell monolayer is inadequate and that a catenary model comprising basolateral (B), apical (A), and cellular compartments (Ito et al., 1999; Tam et al., 2003; Irie et al., 2004; González-Alvarez et al., 2005) is more appropriate than what routine analyses subscribe, especially under nonlinear conditions. Given the importance of the Caco-2 system in drug discovery and development, we explored properties of the catenary model to gain a mechanistically based understanding of the asymmetric observations arising from transporters, enzymes, and effective permeability under both linear and nonlinear conditions. We examined the definition of Papp under “sink” and “nonsink” conditions and when the parameter was based on cumulative or timed sampling. The definition of EfR and its dependence on transport, binding, and metabolic parameters was studied. Moreover, the appropriateness of estimates of Michaelis-Menten parameters Vmax (as Jmax) and Km (as  or
or  ) was investigated.
Theory
The Caco-2 Cell Model. We hereby briefly revisit the terminologies and concepts. Although we refer our terminology to the Caco-2 system, the kinetics derived may also apply to transfected cell lines or other similar, in vitro systems. The test compound is administered into the donor side, the apical or basolateral compartment, and samples are withdrawn at the alternate site (receiver side). Both sink and nonsink conditions for the Caco-2 system have been considered. Sink conditions refer to the situation in which back diffusion of drug in the receiver side to cell monolayer is negligible. Sink condition would be satisfied when the sampling is conducted within the time interval that drug concentration in the receiver side remains <10% of the loading concentration, CD,0 (Troutman and Thakker, 2003a), or when drug in the serosal side is removed rapidly and irreversibly, leaving no chance for the drug to return back to the enterocyte. In contrast, no assumption needs to be made for nonsink conditions; there is no need to assume that drug concentrations are maintained high in the donor side but low in the receiver side and that drug molecules in the receiver side do not re-enter the cell compartment.
Definition of Papp and EfR. The most common approach is to document drug appearance in the receiver side. This permeability term, Papp, defined in eq. 1, is commonly known as the apparent or effective permeability (Hilgers et al., 1990),  where (ΔAR/Δt) is the rate of drug appearance in the receiver side, S is the surface area of the transwell (4.71 cm2 for transwell of 24-mm insert diameter; Yamaguchi et al., 2000), and CD,0 is the initial drug concentration in the donor side at time = 0. When the value is based on cumulative sampling (total amount transported from time = 0 up to the last sampling point), the cumulative Papp is obtained. However, when the value is based on sampling at various time intervals, the incremental Papp is obtained, and CD,0 denotes the donor concentration at the onset of the time interval (Youdim et al., 2003). Permeability, when based in absence of transporters, denotes the ability of the molecule to traverse membranes by passive means. However, high passive permeability is not synonymous with high lipophilicity because hydrogen bonding or the presence of unstirred water layer for this group of compounds can delimit permeability to such an extent that the compounds would exhibit a low permeability.
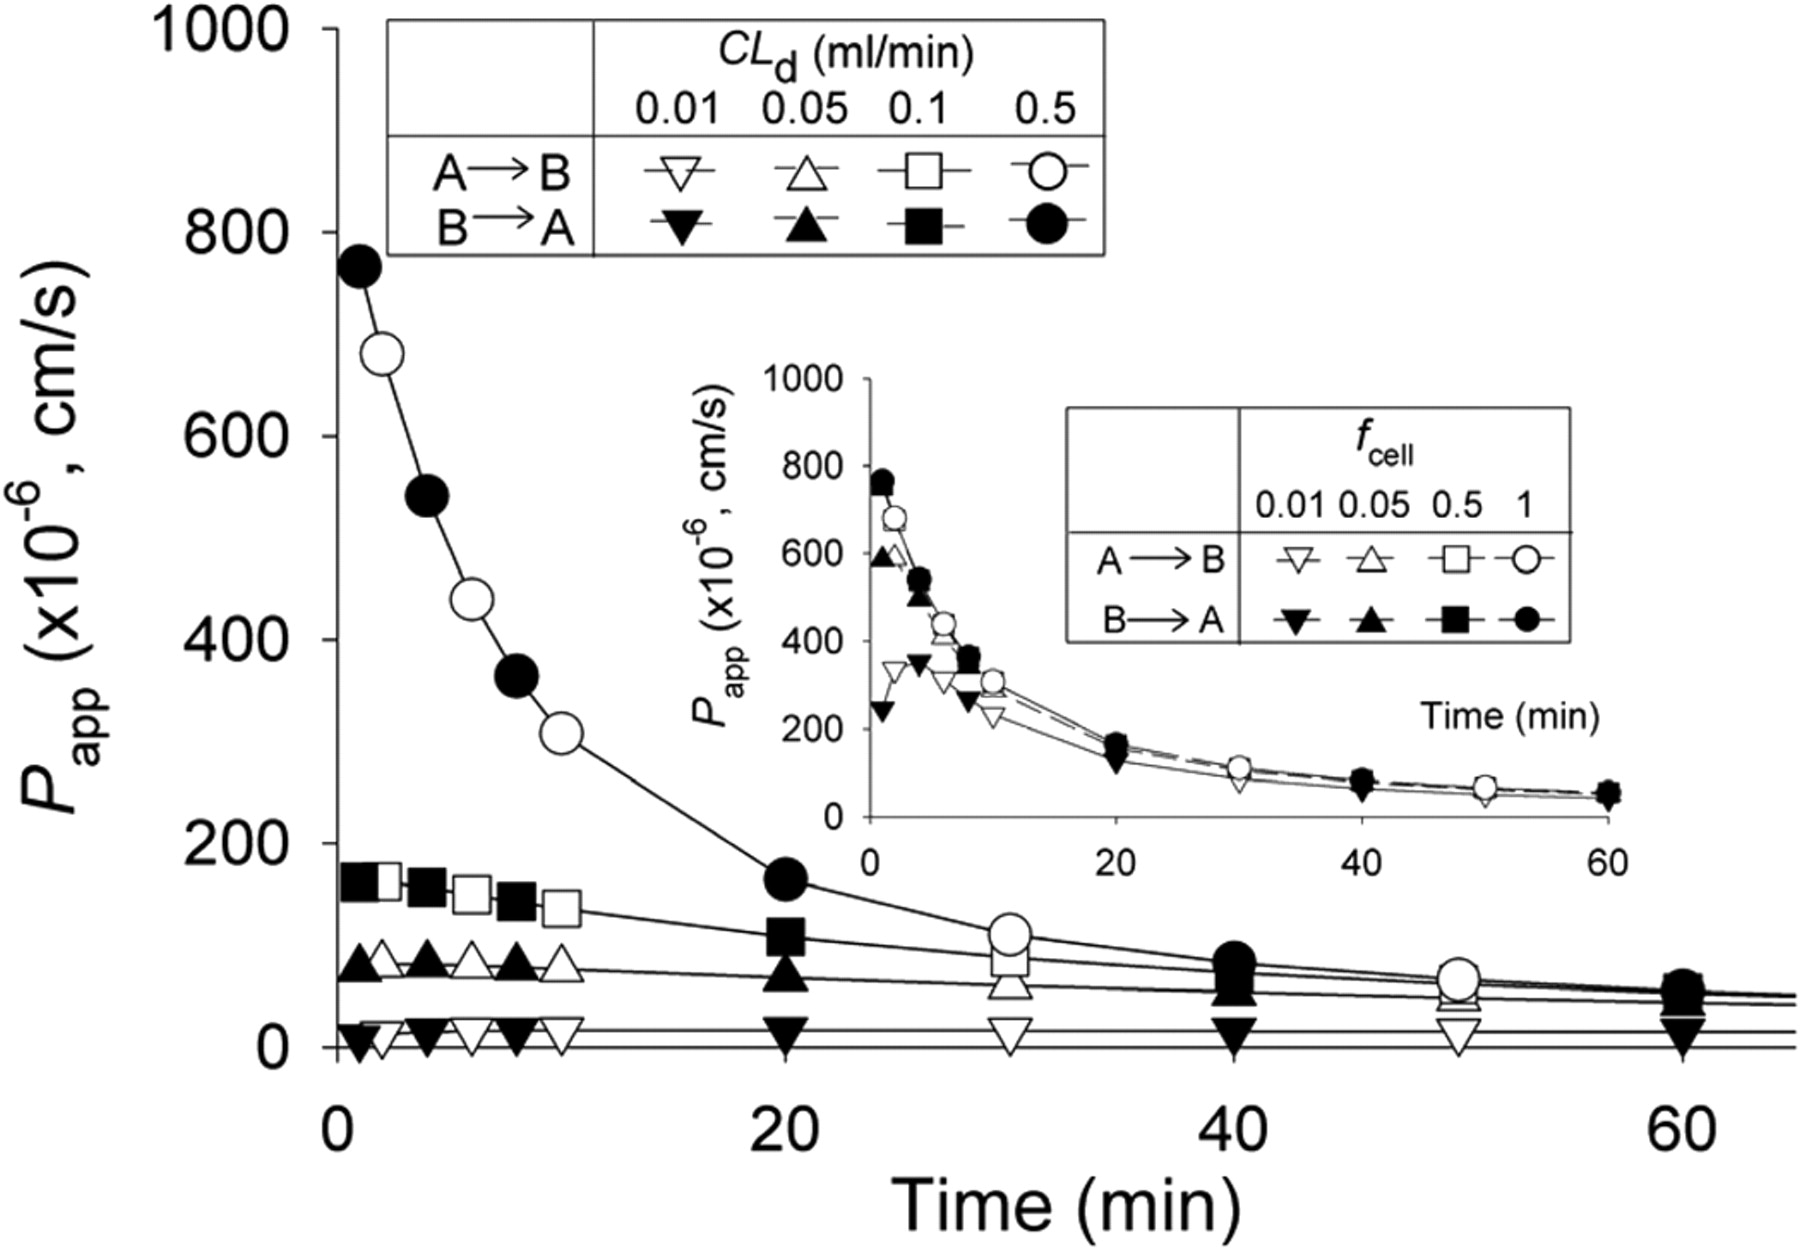
The effective permeabilities Papp according to eq. 1 for the A→B and B→A directions were identical when transporters and enzymes were absent: CLinflux = CLefflux = CLint,sec = CLabs = CLint,met = 0 and CLd1 = CLd2 = CLd3 = CLd4 = CLd. Note that, in the insets, Papp decreased with cellular binding (fcell denotes the unbound fraction in the cell).

The effective permeabilities Papp versus time for the A→B and B→A directions were different when CLd1 = CLd2 = CLd3 = CLd4 = CLd = 0.2 ml/min (A) or 0.05 ml/min (B) and the corresponding EfRs at varying apical efflux activities (CLint,sec). All the unbound fractions were equal to unity; CLinflux = CLefflux = CLint,met = CLabs = 0.

The effective permeabilities Papp versus time for the A→B and B→A directions were identical when CLd1 = CLd2 = CLd3 = CLd4 = CLd = 0.2 ml/min (A) or 0.05 ml/min (B) at varying cellular metabolic activities (CLint,met). All the unbound fractions were equal to unity; CLinflux = CLefflux = CLint,sec = CLabs = 0.
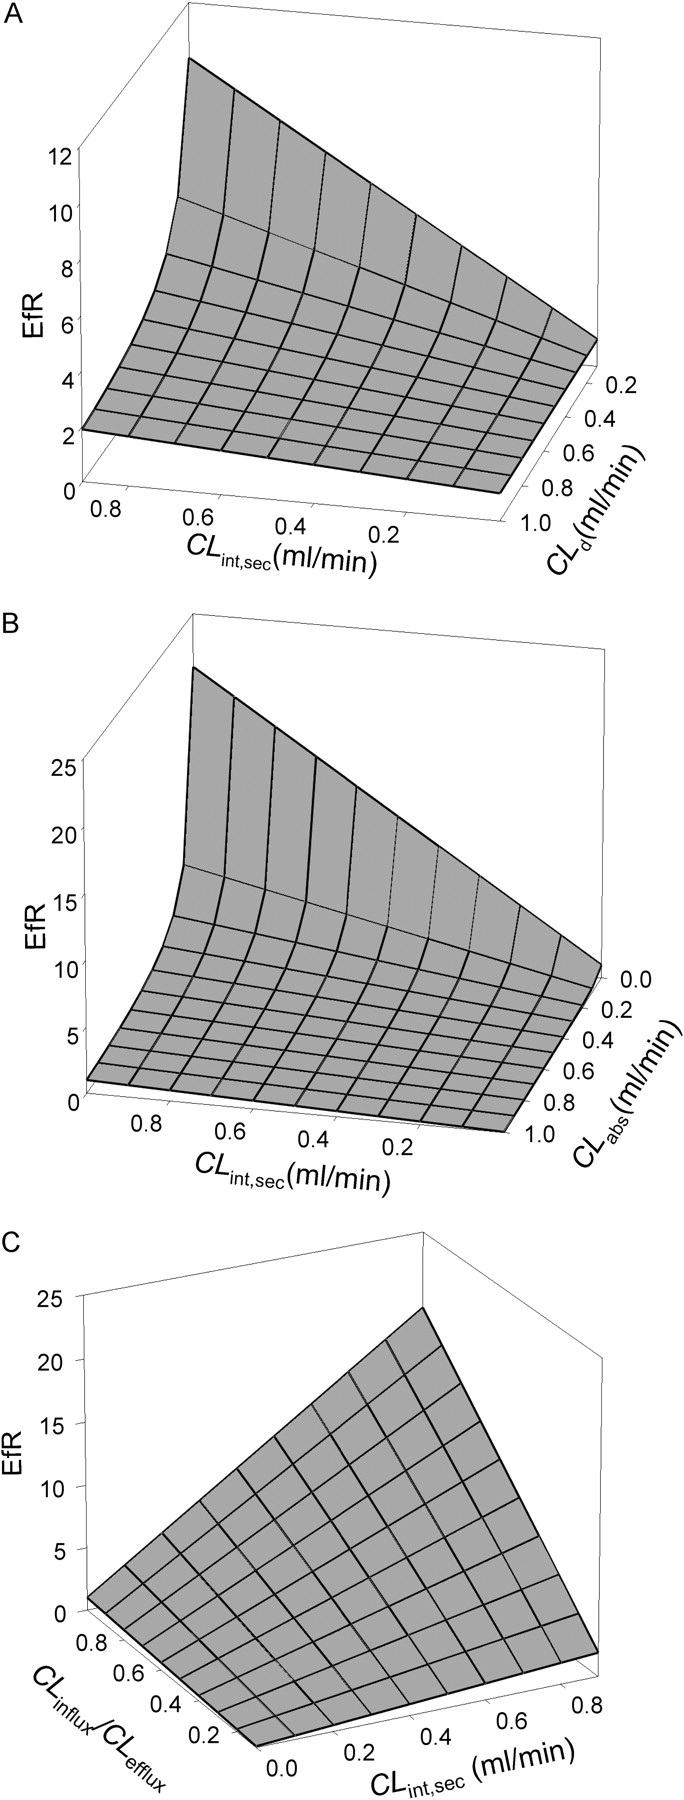
Influence of CLint,sec, together with CLd (A), CLabs (B), and CLinflux/CLefflux (C), on EfR under linear conditions, based on eq. 12. All passive clearances were assumed to be equal (CLd1 = CLd2 = CLd3 = CLd4 = CLd), and unbound fractions in basolateral and apical compartment were equal (fap = fbaso). For (A) and (B), CLinflux = CLefflux = 0 at the basolateral membrane; for (B) and (C), CLd was assigned as 0.05 ml/min, respectively, and in (A) and (C), CLabs = 0.
Usually, the purpose of transport studies in Caco-2 monolayer is to ascertain whether the test compound is a substrate of the efflux transporter, especially Pgp. The efflux ratio, or ratio of effective permeability for a drug given into B to appear in the A (B→A) direction to that in the A→B direction (eq. 2), is used.  Generally speaking, a value of <1.2 or 1.5 for EfR infers that only passive diffusion is involved in drug transport, whereas EfR values that greatly exceed unity suggest that test compounds are substrates of efflux transporters at the apical membrane (Lentz et al., 2000; Polli et al., 2001). However, the inference is less certain for highly permeable substrates, even though the compounds are Pgp substrates; rapid influx of drugs by passive diffusion or active uptake transporters on the apical membrane can overcome the effect of apical efflux (Lentz et al., 2000).
For EfR values falling between approximately 1 and 1.5, there exists the dilemma of identifying whether the test compound is a substrate of Pgp or other efflux transporters. Methods involving use of inhibitors are thus developed. The effective permeability (Papp) in the presence of the specific inhibitors [GF120918 for Pgp and BCRP (den Ouden et al., 1996), Ko143 for BCRP (Allen et al., 2002), and MK571 for the MRPs (Gekeler et al., 1995)] would be reduced to approximate values of the passive permeability (PPD) when the transporter component is drastically reduced or totally obliterated. To avoid ambiguity in the definition of the concentration employed, the inhibitor should be added to both A and B compartments.
The absorptive quotient (AQ) (eq. 3) and the secretory quotient (SQ) (eq. 4) are introduced with administration of the inhibitor into the apical and basolateral sides (Troutman and Thakker, 2003c). These expressions are derived from Papp in absence and presence (PPD,A→B or PPD,B→A) of inhibition. 
 A change in Papp with inhibitors will alter the AQ and SQ values if apical efflux transporters are involved. The enhancement of the asymmetric transport of drugs in A→B (absorptive) direction with attenuation of transport in B→A (secretory) direction with Pgp inhibitors suggests that Pgp is involved in drug transport. The unidirectional measurements of AQ or SQ would reduce the workload in drug screening while providing reliability to bidirectional study for identification of Pgp substrates. It has been proposed that, if the AQ or SQ value is more than 0.3, the drug is considered to be a Pgp substrate (Thiel-Demby et al., 2004).
Caco-2 Cells and Enzymes. Caco-2 also houses various drug metabolizing enzymes, and the system has been used to study drug metabolism as well as the interplay between transporters and enzymes (Cummins et al., 2001). Metabolism in Caco-2 monolayer could modulate Papp, EfR, and net efflux rates. The effects of metabolism have not been properly addressed.
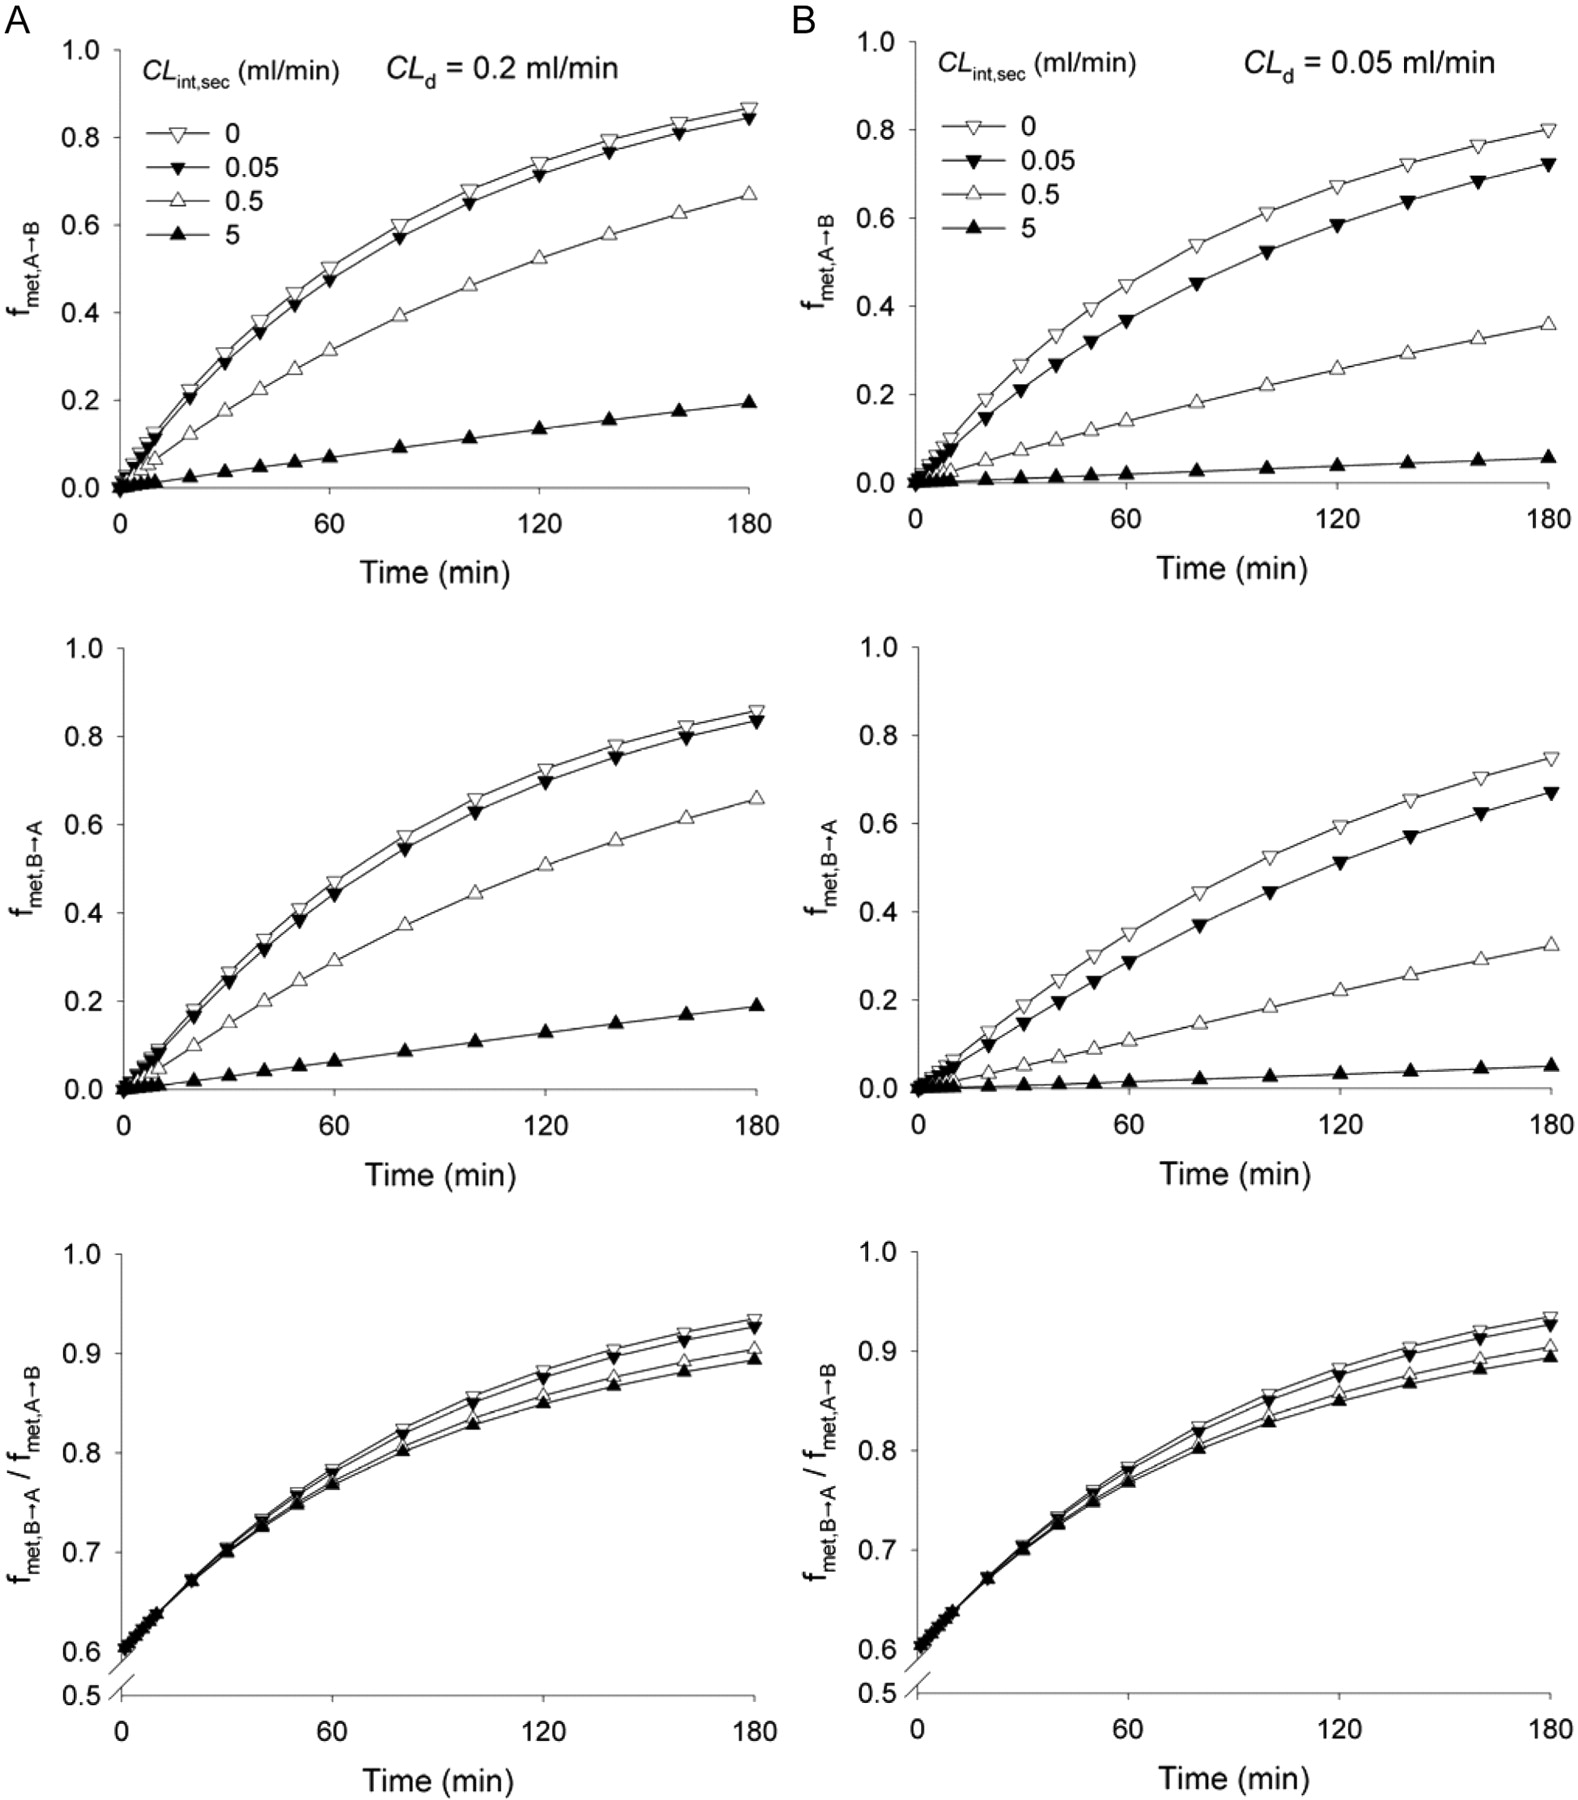
Influence of Pgp-mediated efflux (CLint,sec, from 0 to 5 ml/min) on the asymmetry in metabolite formation at 1-h sampling expressed as a fraction of the dose of metabolite formed, fmet, from the B→A direction versus the A→B direction under linear conditions for solutes of (A) high (CLd1 = CLd2 = CLd3 = CLd4 = CLd = 0.2 ml/min) or (B) low (CLd1 = CLd2 = CLd3 = CLd4 = CLd = 0.05 ml/min) passive permeability. In all simulations, CLint,met = 0.05 ml/min, CLabs = 0, CLinflux = CLefflux = 0 at the basolateral membrane, and unbound fractions were equal to unity.
Various laboratories have used different terminologies to express the cellular metabolism within the Caco-2 cell system. One of these is the extraction ratio (ER), given by the ratio of the total amount of the metabolite (Mettotal) divided by the sum of the Mettotal and the drug amount(s) in the receiving compartment (DR; eq. 5) (Fisher et al., 1999) or by the sum of Mettotal,DR, and the drug amount(s) in the cell (Dcell) (eq. 6) (Cummins et al., 2001). 
 These equations on the extraction ratio have been misconstrued to describe the extents of metabolism because the equations have neglected to consider the entire mass of the system, namely, drugs in the donor and/or cell compartments in the system. The above equations have led to the misconception that metabolism can be increased with increase in efflux transport under linear conditions. A simple equation (eq. 7) that describes the fraction of dose metabolized (fmet) has been used to correct for the misconception (Tam et al., 2003):
  The parameter, fmet, expressed as a fraction of dose reflects the metabolic efficiency of the system and is more appropriate to describe the extent of drug metabolism in the Caco-2 monolayer.

Effects of saturable, apical efflux (Vmax = 50 nmol/min, Km = 10 μM) on the effect of permeability (Papp,A→B, Papp,B→A) and efflux ratio (EfR) for a solute of high (A) and low (B) passive, diffusive clearance (CLd1 = CLd2 = CLd3 = CLd4 = CLd = 1 or 0.05 ml/min, respectively). In all simulations, CLabs = CLinflux = CLefflux = 0, fap = fbaso = fcell = 1, and CLint,met = 0.1 ml/min; CD,0 was varied from 0.5 to 500 μM to reach greater degrees of saturation of apical efflux.
Nonlinearity. To understand the transport mechanism of drugs across the Caco-2 monolayer, the individual contribution of passive diffusion/permeability (PPD) and transporters (Pc) to the overall or total permeability (Papp) has to be distinguished under nonlinear situations. The carrier-mediated permeability (Pc) has been defined as Jmax/( + CD,0) and Jmax/
 for nonlinear and linear cases, respectively (Troutman et al., 2003b).
 and Jmax are estimates of the Michaelis-Menten constant (Km) and maximum flux (Vmax) for the transporter, respectively. Usually, Pc, or the carrier-mediated permeability associated with the saturable process, is estimated from eq. 8 as Papp - PPD. In the case of saturable apical efflux, PPD may be evaluated from use of inhibitors of efflux transporters. The apical, absorptive transporter or enzyme activity is usually negligible in nontransfectants (Caco-2 cells), and transporter/metabolic activity shows up only in transfectants. Thus, Papp may be evaluated from transfectants and PPD from mock-transfected Caco-2 cells (Cummins et al., 2001; Bhardwaj et al., 2005).

Effects of saturable, apical efflux on rates of metabolism expressed as a fraction of the dose metabolized (fmet,A→B) and (fmet,B→A) on the asymmetry of metabolism for a solute of high or low passive, diffusive clearance (CLd1 = CLd2 = CLd3 = CLd4 = CLd = 1 or 0.05 ml/min, respectively); CLabs = CLinflux = CLefflux = 0, fap = fbaso = fcell = 1, and CLint,met = 0.1 ml/min. In this simulation, the Km (10 μM) for apical efflux was kept constant, whereas the Vmax was varied from 0 to 1000 nmol/min at CD,0 = 100 μM.
Analogously, the net flux due to carrier-mediated transport (Jc) is viewed as the difference between the total flux (J) and flux due to passive diffusion (Jm) and was estimated as PcSCD,0. These relate to the estimated parameters, Jmax (for Vmax) and  (for Km). In most of the investigations, it has been assumed that apical efflux is the saturable process and that substrate concentration at the vicinity of the transport process is the initial loading concentration, CD,0.
  The strategies taken involved plotting Jc versus CD,0 in the Eadie-Hofstee plot for the appraisal of Jmax and
  (Troutman and Thakker, 2003b). More often than not, curvature was observed in the plot of Jc versus CD,0, since CD,0 is not the substrate concentration and the Caco-2 system is not a single barrier. To improve the fit, a Hill number or coefficient, β, an estimate of the number of binding sites on the transporter, was added into eq. 10 (Stephens et al., 2001).
  The equation was rearranged as shown below.
  In this “improvised method,” Jmax was first estimated from the y-intercept of the Eadie-Hofstee plot, and β and
  were estimated from refitting of data to eq. 11.

Effect of saturable, apical efflux (Vmax = 0.5 nmol/min and Km = 0.5 μM) on (A) carrier-mediated effective permeability, Pc, (B) the net flux associated with carrier (Jc) at 1-h sampling, and (C) the resulting Eadie-Hofstee plots at different loading concentrations (CD,0) in both A→B (open symbols) and B→A (solid symbols) directions, when passive diffusion [CLd: ○, • (0.01 ml/min), ▿, ▾ (0.1 ml/min), and □, ▪ (1 ml/min) (see inset)] was altered. The unbound fractions were all set to unity; CLint,met was set to 0.01 ml/min; CLinflux = CLefflux = CLabs = 0. Note the nonconformity of some of the data to Michaelis-Menten kinetics. Usually, the early data points were used to estimate the Jmax (y-intercept at Jc/CD,0 = 0) then the  from the slope (-
 ) or
) or  with an equation associated with the Hill coefficient (eq. 11).
Materials and Methods
The Catenary Caco-2 Cell Model. A catenary model similar to those used by others (Ito et al., 1999; Tam et al., 2003; Irie et al., 2004; González-Alvarez et al., 2005) was employed to appraise various aspects of the effective permeability, efflux ratio, and data interpretation on transporters and enzymes in Caco-2 monolayers. The model comprised the absorptive and ABC transporters of the apical membrane and influx and efflux barriers at the basolateral membrane as two sets of potential barriers. The complexity of housing the ABC transporters in a lipid bilayer was not considered (Tran et al., 2005) because the equilibrium of drug molecules between the aqueous compartment and inner/outer plasma membrane would be achieved rapidly. In addition, paracellular transport was neglected, as this could be embedded in the parameter for passive diffusion permeability.
The cell monolayer is viewed as a system that includes transporters and enzymes and allows for drug diffusion and cellular binding. The net flux associated with drug permeation in the catenary model involves two different barriers—one at the apical membrane, separating the apical compartment and cell, and the other at the basolateral membrane, separating the basolateral compartment and cell (Fig. 1). The terms CLabs and CLd4 denote the absorptive clearance ascribed to transporter-mediation and passive diffusion on the apical membrane, respectively; CLint,sec and CLd3 denote the secretory and passive transport clearances of drug from the cell back to the apical compartment, respectively; CLd1 and CLinflux represent the passive and transporter-mediated influx clearances of drug between the basolateral compartment and cell monolayer, respectively; CLd2 and CLefflux represent the passive and transporter-mediated efflux clearances of drug between cell monolayer and the basolateral compartment, respectively. Unless specified, it was assumed that the clearances driven by passive diffusion are equal (CLd1 = CLd2 = CLd3 = CLd4 = CLd). These CLd terms relate to drug permeability by passive diffusion. A drug with high CLd is highly permeable, whereas a drug with low CLd is poorly permeable and requires transporters to facilitate transport.
In this study, simulations were conducted to produce profiles on transport and metabolism of solutes in the Caco-2 monolayer that was grown on a transwell of 24-mm insert diameter (six-well plate). Vap (1.5 ml) and Vbaso (2.5 ml) were the volumes of buffer solution in the apical and basolateral compartments, respectively. One popular approach to estimate the cellular volume (Vcell) is by geometrical calculation, in which Vcell equals the insert area × cell height. Blais et al. (1987) had measured the cell height by a pulse height analyzer and estimated Vcell to be 3.66 μl/mg protein. Since the protein content of a confluent Caco-2 monolayer was 3 mg (Irie et al., 2004), the Vcell was calculated to be 10.98 μl (3.66 μl/mg × 3 mg). In the second method, Yamaguchi et al. (2000) studied sulfanilamide, a poorly protein-bound compound whose transport was mediated only by passive diffusion, and estimated Vcell to be 12.15 μl from the amount of sulfanilamide cumulated in the cell monolayer/external sulfanilamide concentration at equilibrium. Hence, in the present study, we took the average value of these Vcell values, 11.56 μl, for all simulations.
Under nonlinear conditions, the rate of solute appearance in the receiver side changed with the initial concentration in the donor side, CD,0. These changes with concentration were observed with saturation of the apical efflux (González-Alvarez et al., 2005), apical influx (Tamai et al., 1997), basolateral influx (Irie et al., 2004), or metabolism (H. Sun, L. Zhang, E. C. Chow, G. Lin, K. S. Pang, and Z. Zuo, unpublished data). The linear model described in Fig. 1 was modified to include nonlinearity by substitution of the clearance term of the apical or basolateral membrane with Vmax/(Km + Cu), where Cu was the unbound drug concentration and Vmax and Km were the maximum velocity and Michaelis-Menten constant, respectively.
For simplicity, metabolism within the system was viewed as the aggregate amount of metabolite formed that was associated with the metabolic intrinsic clearance, CLint,met. Drug binding to proteins in the apical and basolateral compartments would occur due to the presence of sloughed-off mucosal cells (unbound fractions, fap and fbaso, respectively) and within the cell (unbound fraction, fcell). Binding would affect the mass transfer and metabolic rates that are based on unbound drug concentrations. The assumption was made that formed metabolites did not compete with the parent drug for the transporters, enzymes, and drug-protein binding. The substrate was further assumed to undergo simple Michaelis-Menten kinetics for both transport and metabolism under nonlinear conditions.
Solutions and Simulations. Mass balance equations (see Appendix) based on the catenary model shown in Fig. 1 were developed. Under linear condition, the equations were solved for Papp and EfR with the program Maple 9.0 (Waterloo Maple Inc., Waterloo, Canada). Computer simulations were performed under linear and nonlinear conditions with Scientist (Micromath, Salt Lake City, Utah). Different CLd,CLint,met,CLabs,CLint,sec, Vmax, and Km were assigned.
Results
Linear Conditions. Both sink and nonsink conditions were examined. The Papp under nonsink conditions was best to describe drug transport, and the incremental Papp, estimated at different time intervals, was less stable than the cumulative Papp [based on (amount transported)/(time 0 to time of sampling)] in the description of EfR (data not shown). Hence, further analyses only pertained to the cumulative Papp. Although an explicit solution was found for Papp by matrix inversion for nonsink conditions, the solution was not readily presentable because the expression was very lengthy. Instead, computer simulation was used to show patterns of Papp and the factors that modulated Papp.
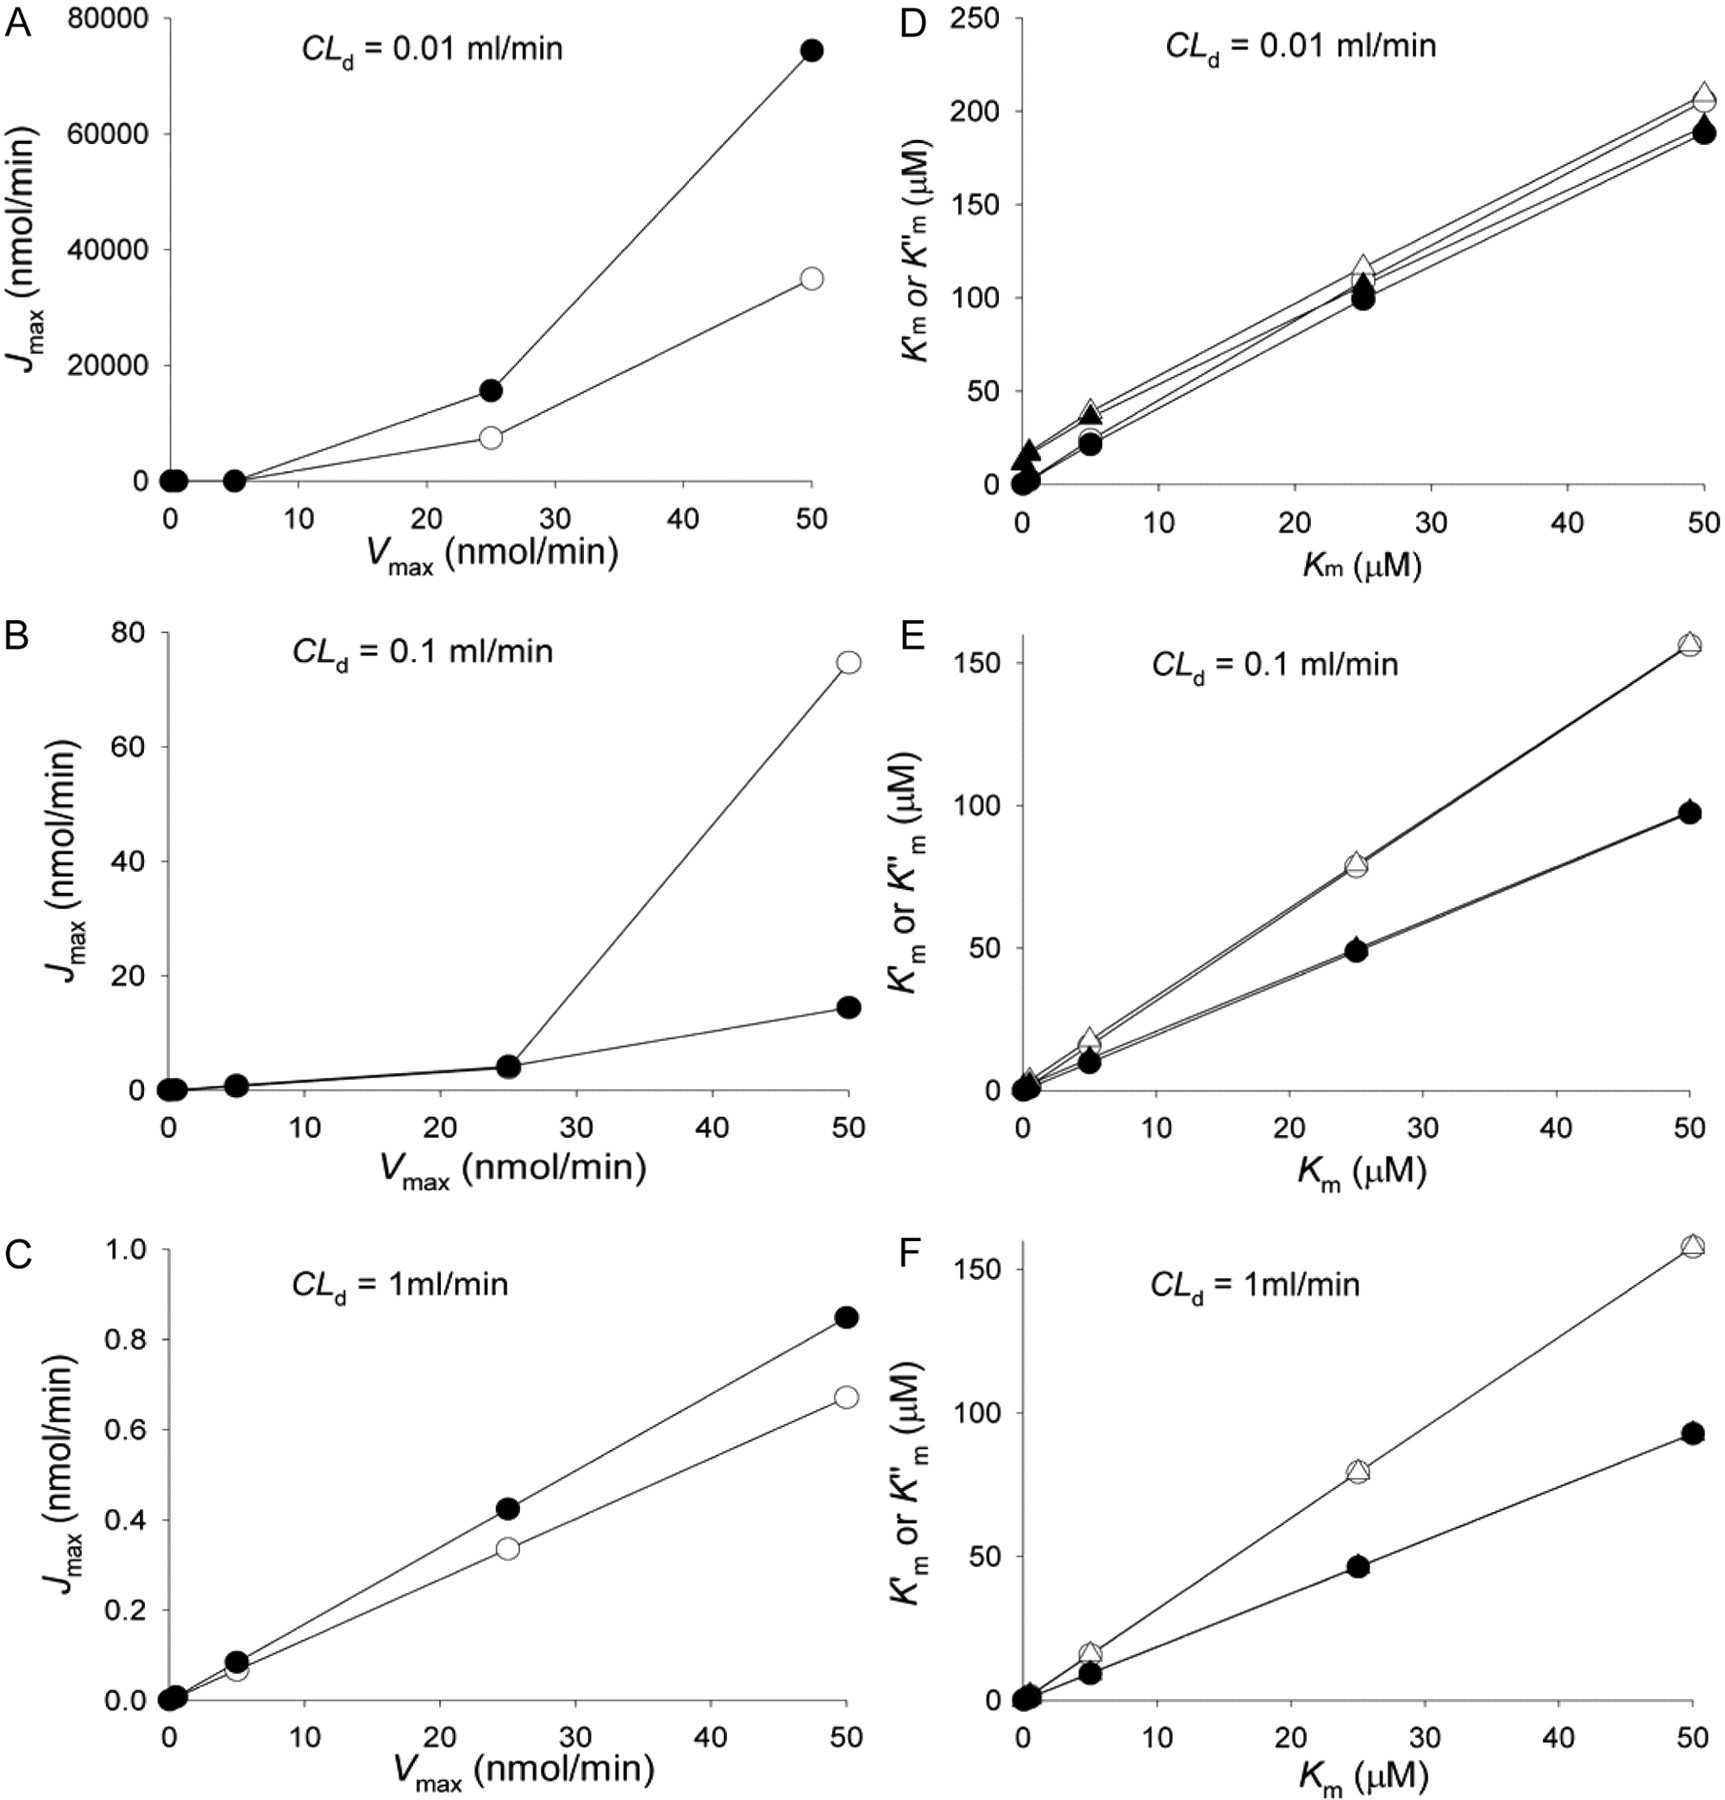
Correlation between estimated parameter Jmax at 1-h sampling versus the assigned Vmax (A, B, and C) and  and
and  versus the assigned Km (D, E, and F) for the apical efflux transporter in the Caco-2 cell monolayer (data of Tables 1 and 2) when different CLd (0.01, 0.1, and 1 ml/min) were used for simulation. D–F,
  (○, •) and
  (▵, ▴) were represented against Km. Transport in A→B and B→A directions was denoted by open and solid symbols, respectively. For the simulations, all the unbound fractions were set to unity; CLinflux = CLefflux = CLabs = 0; CLint,met = 0.01 ml/min.
Papp and EfR in Absence of Metabolic Enzyme and Transporter Activity. When transporter and enzyme activities were absent,Papp was found to be time- and permeability-dependent (Fig. 2). With the assumption that CLd = CLd2 = CLd3 = CLd4 = CLd, Papp,A→B and Papp,B→A profiles were found to be identical (Fig. 2), resulting in EfR values that were constant (unity) and time-invariant. Binding within the cell further affected the Papp patterns (Fig. 2, insets), rendering decreased Papp with decreasing unbound fraction, fcell. However, binding would not alter EfR, as predicted by eq. 12.
Papp and EfR in the Presence of Efflux or Metabolism.Papp was found to be modulated by CLint,sec (Fig. 3) at both high and low passive diffusion clearance, CLd. Papp,B→A was increased, whereas Papp,A→B was decreased with increasing CLint,sec; thus, EfRs were increased, and the values were higher for drugs with low CLd (Fig. 3). By contrast, Papp values were identical in both absorptive and secretory directions, and Papp decreased with increasing CLint,met (Fig. 4); the Papp values were lower for drugs of lower CLd. Values of the resultant EfR converged at unity, regardless of values of CLint,met.

Effects of saturable, apical absorption (Vmax = 0.5 nmol/min and Km = 0.5 μM) on (A) carrier-mediated permeability, Pc, (B) the net flux associated with carrier Jc at 1-h sampling, and (C) the resulting Eadie-Hofstee plots at different loading concentrations (CD,0) in both A→B (open symbols) and B →A (solid symbols) directions when passive diffusion [CLd: ○, • (0.01 ml/min), ▿, ▾ (0.1 ml/min), and □, ▪ (1 ml/min) (see inset)] was altered. The unbound fractions were all set to unity; CLint,met was set to 0.01 ml/min; CLinflux = CLefflux = CLint,sec = 0. Note the nonconformity of some of the data to Michaelis-Menten kinetics. Usually, the early data points are used to estimate the Jmax (y-intercept at Jc/CD,0 = 0) then the  from the slope (-
 ) or
) or  with an equation associated with the Hill coefficient (eq. 11).
Solution for EfR. The solution for EfR existed in a concise form under linear conditions, and was similar to that reported by Adachi et al. (2001), with the exception of the unbound fractions.  CLint,met and fcell were absent in eq. 12 for EfR. The equation implied that, under linear conditions, intracellular metabolism and the binding of drugs to intracellular protein would not influence EfR. When protein was absent (fap = fbaso = 1) or when binding was similar (fap = fbaso), the binding terms would disappear and the fbaso and fap terms were canceled, and eq. 12 was further simplified.
  Based on eq. 13, the effect of the various clearances on EfR was investigated. The results are summarized in three-dimensional graphical presentations. As shown in Fig. 5A, values of EfR fell between 1 and 2 when the test compounds were of high CLd (∼1 ml/min), even when the efflux transporter activity (CLint,sec) was substantial (0.8 ml/min). The same was observed for compounds that were actively taken up by the apical transporters (CLabs >> CLd4), rendering values of EfR below unity (Fig. 5B). However, extremely high EfR values would result with increasing CLint,sec but decreasing CLd (Fig. 5A) or CLabs (Fig. 5B), which disallowed rapid equilibration of drug between the cellular and the apical compartment. By contrast, decreasing values of CLinflux/CLefflux would furnish modest values of EfR (between 0.5 and 2) even for substrates that were readily effluxed out at the apical membrane (CLint,sec = 0.9 ml/min) (Fig. 5C).
With the assumption that CLd1 equals CLd2,CLd3 equals CLd4, and only apical efflux is carrier-mediated (i.e., CLabs = CLinflux = CLefflux = 0), eq. 13 was further simplified.  Equation 14 inferred that EfR was dependent on the relative magnitude of CLint,sec and CLd4 in absence of transporter-mediated apical influx, basolateral influx and efflux. For a Pgp substrate such as verapamil, which has a high CLd,CLint,sec ∼ CLd and the efflux ratio was close to 2. For other drugs of low CLd that are Pgp substrates (CLint,sec > CLd), EfR was disproportionately higher (Lentz et al., 2000; Polli et al., 2001). Fortunately, the ambiguity may be removed with the use of potent Pgp inhibitors that would drastically reduce the EfR, revealing AQ and SQ values that denote Pgp transport. Therefore, EfR values needed to be appraised and compared, together with other permeability data with Pgp inhibitors, such as AQ and SQ.
Asymmetry of Metabolism. The amount of metabolite formed (Mettotal) was normalized to the dose and expressed as fmet (eq. 7). A faster metabolite formation rate was observed with apical over basolateral dosing, even with identical initial concentration administered. The observed asymmetry in metabolism resulting from administration into the apical or basolateral side was expected because of differences in volumes (Vap and Vbaso). When identical permeability clearances existed across the apical and basolateral membranes (CLd1 = CLd2 = CLd3 = CLd4) and carrier-mediated transport was absent (CLabs = CLint,sec = CLinflux = CLefflux = 0), fmet,B→A/fmet,A→B was less than 1 (Fig. 6). When Vap and Vbaso were equal, the metabolic asymmetry disappeared (simulation not shown). With increasing incubation time, fmet,A→B, fmet,B→A, and fmet,B→A/fmet,A→B increased and finally approached 1 (when time approached infinity in this system, all drugs ultimately became metabolized and fmet in both directions equaled unity). Again, the passive diffusion clearance (CLd) was important, and a greater permeability of the solute facilitated a faster entry of drug for cellular metabolism (Fig. 6, A and B). Carrier-mediated efflux on the apical side (CLint,sec) decreased values of fmet,B→A and fmet,A→B by removing cellular substrate for metabolism and also affected the value of fmet,B→A/fmet,A→B, accentuating the asymmetry observed for metabolite formation.

Correlation between estimated parameter Jmax at 1-h sampling versus the assigned Vmax (A, B, and C) and  and
and  versus the assigned Km (D, E, and F) for the absorptive, apical transporter in the Caco-2 cell monolayer (data of Tables 3 and 4) when different CLd (0.01, 0.1, and 1 ml/min) were used for simulation. D–F,
  (○•) and
  (▿▾) estimates are plotted against the true Km. Transport in A→B and B→A directions was denoted by open and solid symbols, respectively. For the simulations, all the unbound fractions were set to unity; CLinflux = CLefflux = CLint,sec = 0; CLint,met = 0.01 ml/min.
Nonlinear Conditions. Saturable terms, Vmax and Km, were used as replacement of the intrinsic clearances in the catenary model (Fig. 1); CLd1,CLd2,CLd3, and CLd4 were set equal to CLd, and the unbound fractions were set to unity. For each simulation, only one saturable process (apical influx or efflux, basolateral influx or efflux, or intracellular metabolism) was considered in the Caco-2 system. Simulations were then performed to provide data for appraisal of the appropriateness of the estimates ( or
or  and Jmax) versus the assigned Km and Vmax for the saturable process. The strategy generated sets of data with assigned constants (Km and Vmax,CLd and CD,0), and these were further manipulated into forms used in data interpretation. The true values and the derived estimates were then compared.
First, the manner in which saturation of apical efflux transporters affected Papp and EfR at increasing CD,0 was examined. Solutes with high CLd entered the cell compartment rapidly and readily saturated apical efflux with increasing CD,0. Values of Papp,A→B increased with CD,0 (Fig. 7, top panel), whereas Papp,B→A decreased with CD,0 (Fig. 7, middle panel). These resulted in attenuated EfRs (Fig. 7, bottom panel). By contrast, less changes for Papp,A→B and Papp,B→A were found for drugs of low CLd because these failed to enter the cell readily to saturate apical efflux transporters. Second, the effect of saturable apical efflux on metabolism was considered. The presence of apical efflux reduced the fraction of dose metabolized, fmet, since efflux was competing with metabolism. An increase in Vmax for apical efflux also reduced fmet, regardless of whether the drug was given to A or B, and this existed when the drug equilibrated rapidly (Fig. 8A) or slowly (Fig. 8B).
Eadie-Hofstee Plot. Characteristic profiles were obtained upon plotting Pc (eq. 8) and Jc (eq. 9) against CD,0 (Figs. 9, A and B) when saturable efflux existed. A lack of conformity to linearity was commonly observed with the Eadie-Hofstee plot for the estimation of  and Jmax (flux versus flux/CD,0) (Fig. 9C). Usually, the intercept and slope of the plot associated with the straight line component would be used for estimation of Jmax and
  , respectively (see straight line in inset, Fig. 9C, for drug of high CLd). Poor estimates would result when curvature existed in the Eadie-Hofstee plot for solutes of low CLd (<1 ml/min). When eq. 10 was used to improve the fit with the Hill coefficient, β,
  , estimated from refitting of data to eq. 11, was not much improved compared with
  (see below). The estimate of Jmax remained unchanged since the parameter was estimated from the y-intercept of the Eadie-Hofstee plot.
Estimation of Parameters: Nonlinear Apical Efflux. With varying CLd (0.01, 0.1, or 1 ml/min), further simulations were performed with varying Vmax (0.05 to 50 nmol/min) at a fixed Km (0.5 μM) for apical efflux. The simulations were repeated by changing the Km (0.5 to 50 μM) at a fixed Vmax (0.5 nmol/min) to arrive at different sets of Jc at varying sampling times (0–120 min). The plots Pc, the carrier-mediated flux Jc versus CD,0, and the Eadie-Hofstee plot (Figs. 9, A–C) revealed that CLd strongly influenced the curvature of the Eadie-Hofstee plot with time. Higher values of Pc and Jc were obtained for the B→A than the A→B direction, yielding asymmetric Jmax and lower  estimates (Tables 1 and 2). The early data points of the Eadie-Hofstee plots were used to estimate the Jmax and
  from the intercept and slope, respectively (Fig. 9C). A linear relationship was observed for the Eadie-Hofstee plot only with higher CLd (Fig. 9C, inset). Upon presenting the entire set of estimates, it was apparent that Jmax differed from the assigned Vmax and varied according to the value of CLd (Fig. 10; Table 1). The correlation was poor at low CLd (0.01 ml/min), whereas an improved and linear correlation was identified at increasing CLd (≥1 ml/min) (Fig. 10, A–C). The estimated
  and
and  were less affected by CLd. Linear relationships were found between
  and
and  and the assigned Km (Fig. 10, D–F); the values became closest when CLd was highest (Table 2). However, no further improvement was provided with use of eq. 10 or eq. 11 to arrive at
  (Table 2; Fig. 10, D–F).
Correlation between Vmax and Jmax, for apical efflux at various CLd, when CLint,met = 0.01 ml/min and Km = 0.5 μM CLinflux = CLefflux = CLabs = 0 and CLd1 = CLd2 = CLd3 = CLd4 = CLd; all the unbound fractions were set to unity.
Correlation between Km,  , and
, and  for apical efflux at various CLd when CLint,met = 0.01 ml/min and Vmax = 0.5 nmol/min CLinflux = CLefflux = CLabs = 0 and CLd1 = CLd2 = CLd3 = CLd4 = CLd; all the unbound fractions were set to unity.
Estimation of Parameters: Nonlinear Apical Absorption. With varying CLd (0.01, 0.1, or 1 ml/min), simulations were performed with varying Vmax (0.05 to 50 nmol/min), but at a fixed Km (0.5 μM), and at varying Km (from 0.5 to 50 μM) but at a fixed Vmax (0.5 nmol/min) for the apical absorption transporter to arrive at sets of Pc and Jc data (Fig. 11). With saturable apical absorption, higher Pc and Jc values were obtained in the B→A and not A→B direction, except for drugs of a very low CLd (Fig. 11, A and B). Again, curvatures were observed for the Eadie-Hofstee plot, except for drugs of high CLd (Fig. 11C, inset). The estimated Jmax was poorly correlated to the Vmax, especially when CLd was lower (Fig. 12, A–C; Table 3), but a linear correlation between Jmax and Vmax was attained when CLd values were high (Fig. 12C). The correlation between  and
and  to Km was acceptable among the various CLd (Fig. 12, D–F; Table 4), and an improved correlation existed when the CLd values were high (Fig. 12F). Again, no further improvement was demonstrated with use of eq. 10 or eq. 11 to arrive at
  (Table 4; Fig. 12, D–F).
Correlation between Vmax and Jmax, for apical influx at various CLd, when CLint,met = 0.01 ml/min and Km = 0.5 μM CLinflux = CLefflux = CLint,sec = 0 and CLd1 = CLd2 = CLd3 = CLd4 = CLd; all the unbound fractions were set to unity.
Corelation between Km (0.5 μM),  , and
, and  for apical influx at various CLd when CLint,met = 0.01 ml/min and Vmax = 0.5 nmol/min CLinflux = CLefflux = CLint,sec = 0 and CLd1 = CLd2 = CLd3 = CLd4 = CLd; all the unbound fractions are set to unity.
Estimation of Parameters: Nonlinear Metabolism. With varying CLd (0.01, 0.1, or 1 ml/min), simulations were performed with varying Vmax (0.05 to 50 nmol/min) at a fixed Km (0.5 μM) for the metabolism and at varying Km (0.05 to 50 μM) at a fixed Vmax (0.5 nmol/min) to arrive at sets of Pc and Jc data (Fig. 13). With saturable metabolism, values of Pc were higher with higher CLd (Fig. 13A). Higher Jc values were observed in the A→B but not B→A direction (Fig. 13B), yielding correspondingly higher Vmax (y-intercept) (Fig. 13C). The correlation between Jmax and Vmax was poor regardless of values for CLd (Fig. 14, A–C; Table 5). By contrast, a linear correlation was found between  and
and  with Km among the various CLd (Fig. 14, D–F; Table 6); the correlation improved when CLd values were high. Again, no further improvement was provided with use of eq. 10 or eq. 11 to arrive at
  (Table 6; Fig. 14, D–F).
Correlation between Vmax and Jmax for cellular metabolism (Km = 0.5 μM) at various CLd when other satiable components (apical/basolateral influx, efflux) were absent CLinflux = CLefflux = CLint,sec = CLabs = 0 and CLd1 = CLd2 = CLd3 = CLd4 = CLd; all the unbound fractions were set to unity.
Correlation between Km,  , and
, and  for cellular metabolism at various CLd when other satiable components (apical/basolateral influx, efflux) were absent CLinflux = CLefflux = CLint,sec = CLabs = 0 and CLd1 = CLd2 = CLd3 = CLd4 = CLd; all the unbound fractions were set to unity.
Sampling Time. Sampling in the Caco-2 system was often performed at 1- or 2-h intervals. However, the manner in which sampling time affected the Jc estimates was seldom studied. We examined how sampling time affected estimation of Pc and Jc within the sets of simulations performed on saturation of apical efflux, apical absorption, and metabolism. Indeed, the sampling time affected values of Jc, although saturation profiles were retained versus CD,0 in both A→B and B→A (Fig. 15). Hence, the general shapes were retained for all of the Eadie-Hofstee plots, but estimates for  and Jmax would change when the sampling time, whether 0.5, 1, or 2 h, was used (data not shown).

Effect of saturable cellular metabolism (Vmax = 0.5 nmol/min, Km = 0.5 μM) on (A) carrier-mediated effective permeability, Pc, (B) the net flux associated with carrier Jc at 1-h sampling, and (C) the resulting Eadie-Hofstee plots at different loading concentrations (CD,0) in both A→B (open symbols) and B→A (solid symbols) directions when passive diffusion [CLd: ○, • (0.01 ml/min), ▿, ▾ (0.1 ml/min), and □, ▪ (1 ml/min)] was altered. The unbound fractions were all set to unity; CLinflux = CLefflux = CLabs = CLint,sec = 0. Note the nonconformity of some of the data to Michaelis-Menten kinetics. Usually, the early data points are used to estimate the Jmax (y-intercept at Jc/CD,0 = 0) then the  from the slope (-
 ) or
) or  with an equation associated with the Hill coefficient (eq. 11).
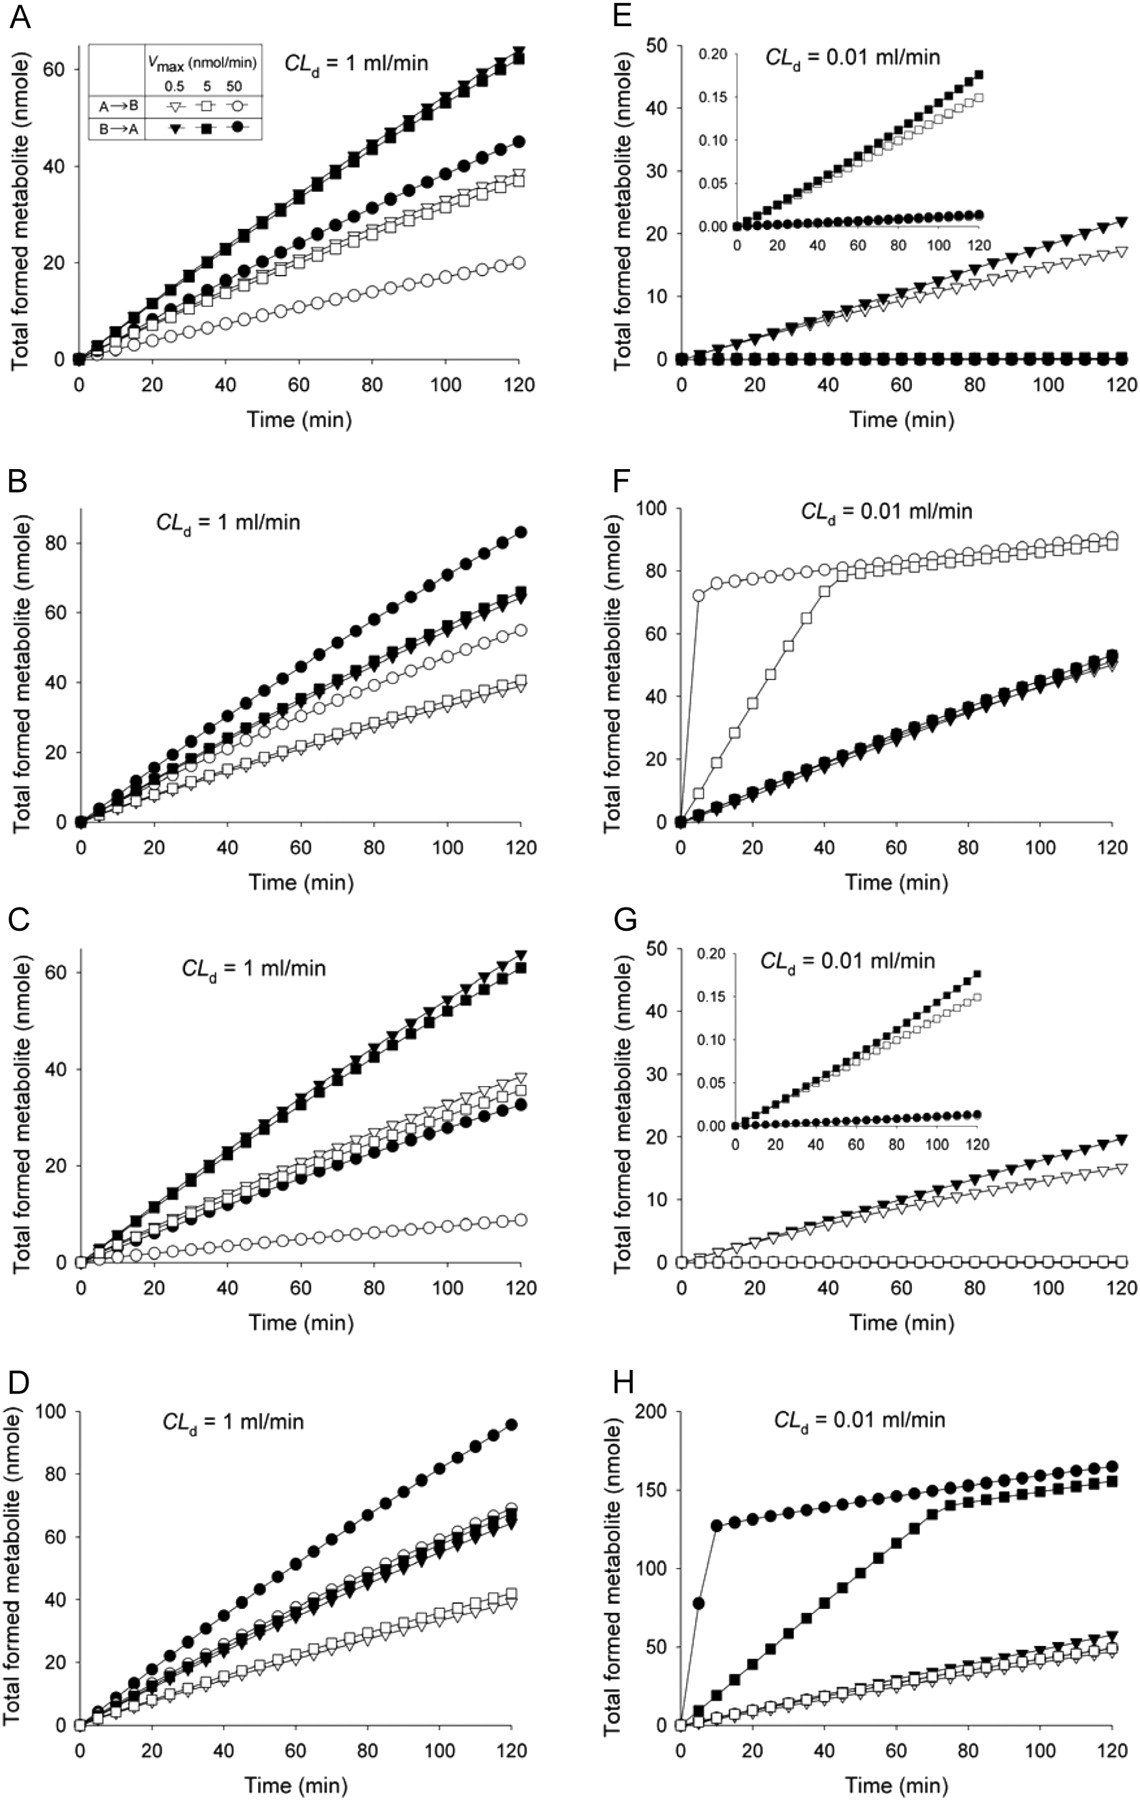
Effect of Nonlinear Metabolite Formation. Simulation was performed to examine how the various saturable processes affected metabolite formation. For drugs of high CLd (1 ml/min), saturable apical efflux (Fig. 16A), apical absorption (Fig. 16B), basolateral efflux (Fig. 16C), and basolateral influx (Fig. 16D) resulted in asymmetric metabolite formation, namely, higher for the secretory direction over the absorptive direction. The trend was partially due to the higher volume of the basolateral compartment; the dose VbasoCD,0 was larger than VapCD,0. Patterns for metabolite formation under saturable apical efflux (Fig. 16A) and basolateral efflux (Fig. 16C) were similar; lesser metabolism was observed with higher Vmaxs to bring drug molecules out of the cell. The cumulative amount of metabolite formed was time-dependent (Fig. 16). In addition, similar patterns existed between the profiles of metabolite formation for saturable absorption or basolateral influx; greater extents of metabolism were found associated with higher Vmax, since this tended to bring more drug molecules into the cell (Figs. 16, B and D). For drugs of poor diffusion clearance (CLd = 0.01 ml/min), greater amounts of metabolite formed were seen in the B→A direction, except when the apical transporter was present (Fig. 16F). At low CLd, drug transport into and out of the cell would be nominal, unless there was enhanced apical absorption by transporters, rendering a greater extent of metabolism in the A→B direction; the trend intensified with increased Vmax for the absorptive transporter (Fig. 16F).

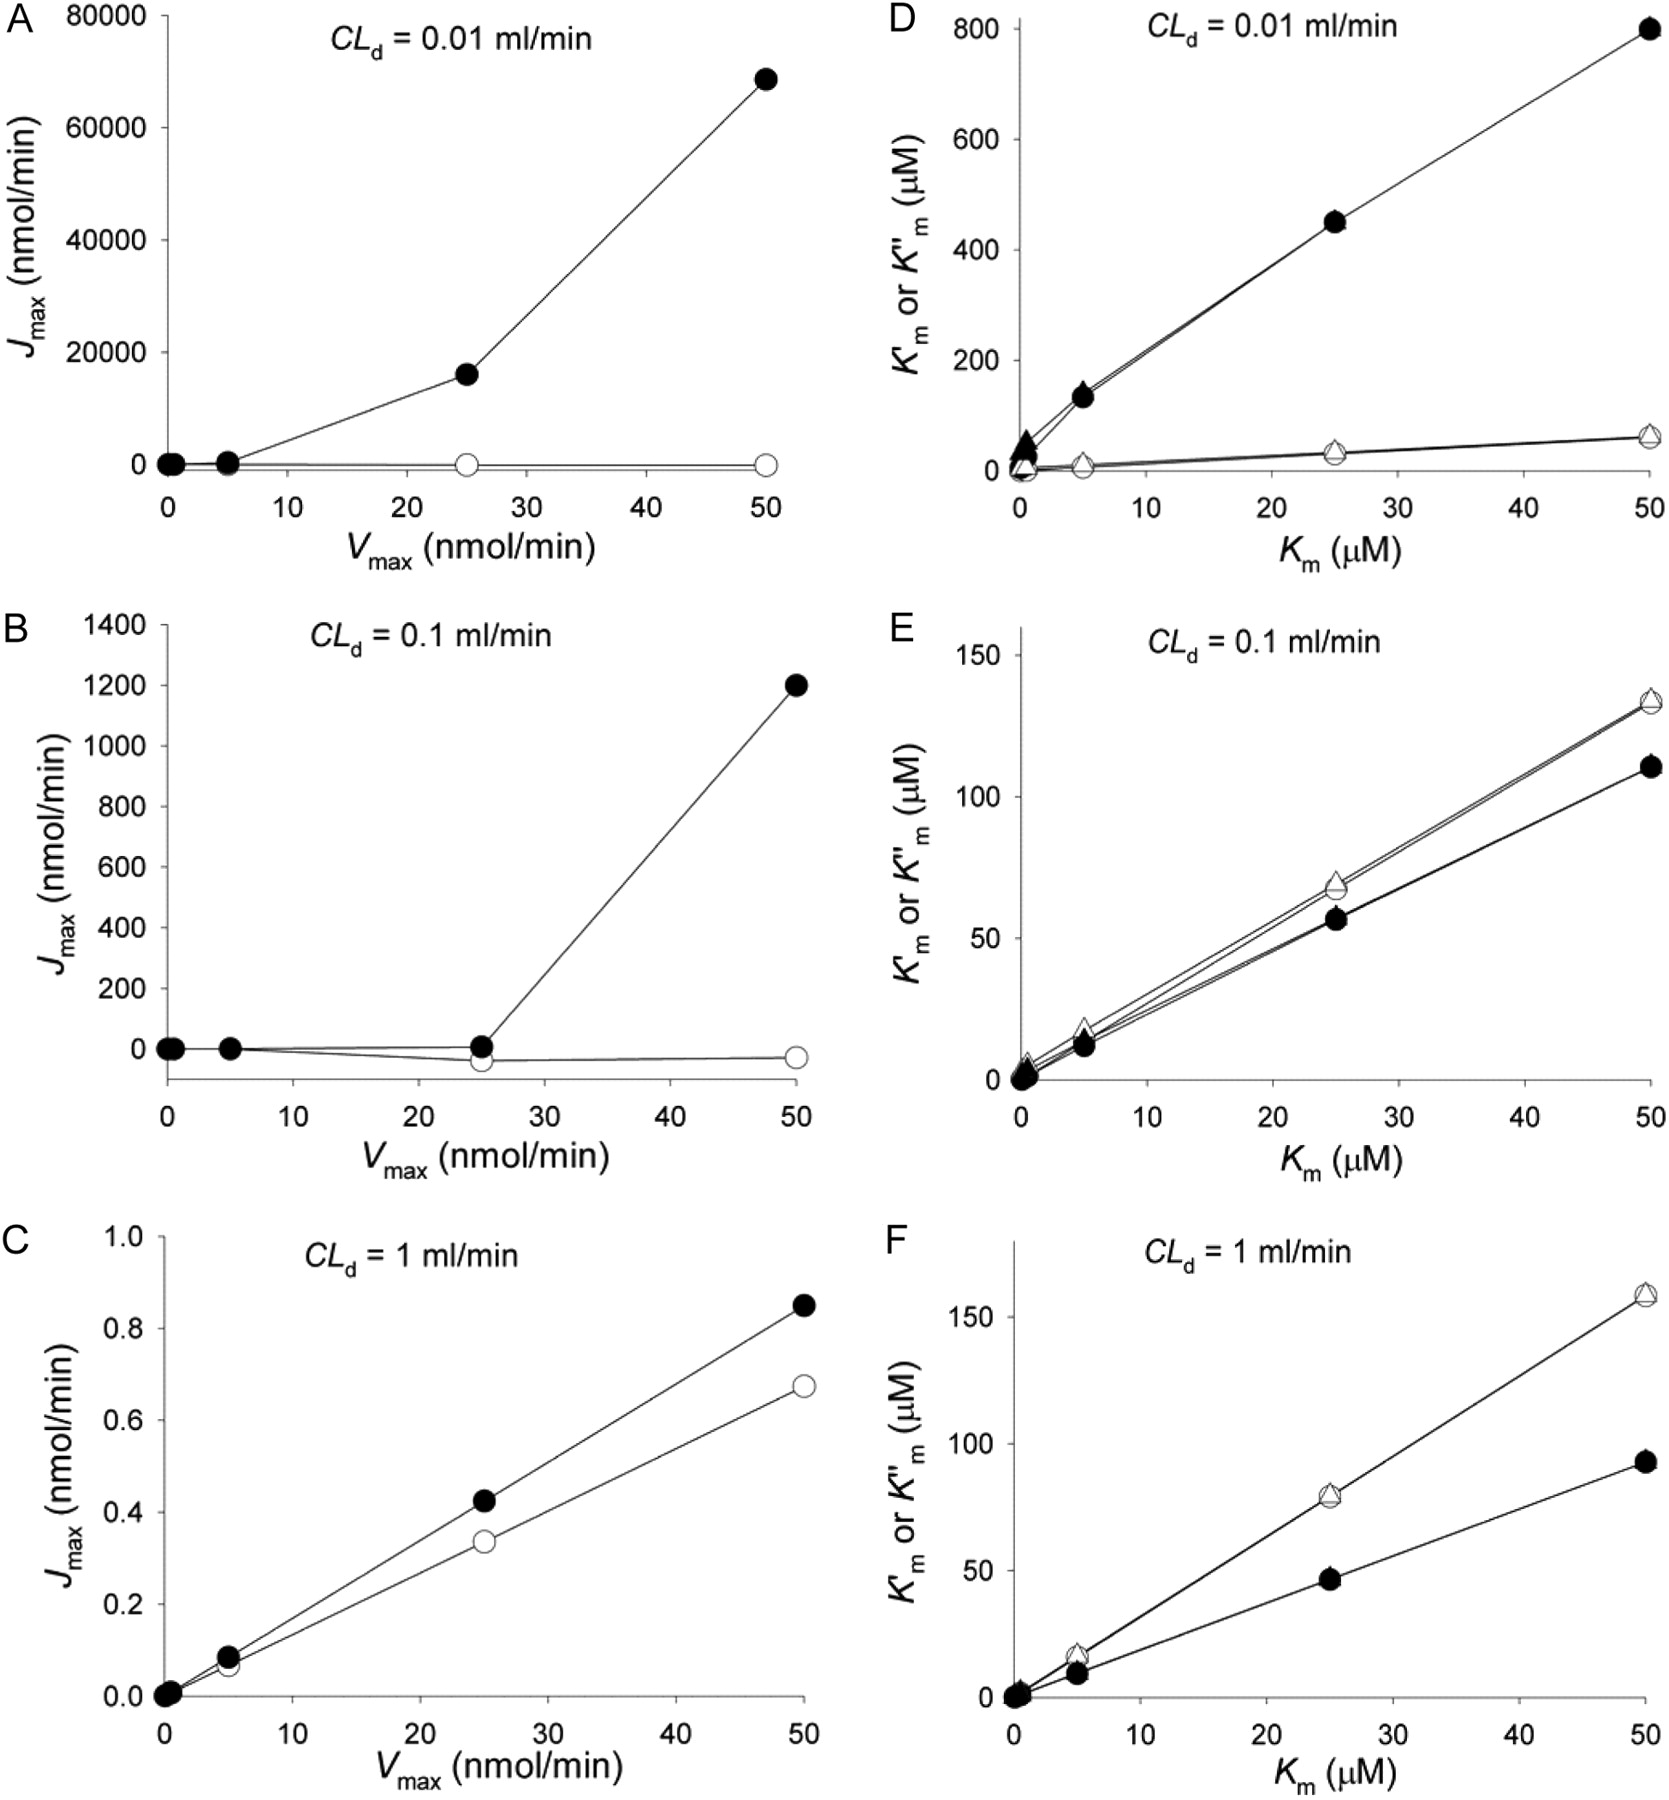
Correlation between estimated parameter Jmax at 1-h sampling versus the assigned Vmax (A, B, and C) and  and
and  versus the assigned Km (D, E, and F) for saturable cellular metabolic activity in the Caco-2 cell monolayer (data of Tables 5 and 6) when different CLd (0.01, 0.1, and 1 ml/min) were used for simulation. Transport in A→B and B→A directions was denoted by open and solid symbols, respectively. In (B),
  and
and  were represented by ○, • and ▵, ▴, respectively. For the simulations, all the unbound fractions were set to unity; CLinflux = CLefflux = CLabs = CLint,sec = 0.
When metabolite formation (at 1 h) was further examined at increasing CD,0, a trend indicating higher metabolite formation for the B→A direction over the A→B direction was unilaterally observed (Fig. 17, A–D), regardless of the saturable process (apical efflux, apical absorption, basolateral influx, or basolateral efflux). The cumulative amount of metabolite formed was less with higher Vmax associated with saturable apical efflux (Fig. 17A) and saturable basolateral efflux (Fig. 17C), and opposite trends existed with saturation of apical absorption and basolateral influx (Fig. 17, B and D). For drugs of poor diffusion clearance (CLd = 0.01 ml/min), higher metabolite formation was again seen in the B→A direction, except when apical absorptive transport was present (Fig. 17F). At low CLd, transport into and out of the cell would be nominal unless there was enhanced absorption by transporters, rendering more metabolism in the A→B direction. The trend intensified when the Vmax for the absorptive transporter was increased (Fig. 17F).
Effect of Nonlinear Processes on EfR. Patterns of EfR under nonlinear conditions were examined. In these simulations, the saturable component was assigned a Vmax of 0.5 nmol/min and Km of 0.5 μM, and CLd1 = CLd2 = CLd3 = CLd4 = CLd. EfR values differed with saturable apical efflux and metabolism (>1) and apical absorption (EfRs <1) but approached unity with high CLd and increasing CD,0 at a higher degree of saturation of the process. Saturable apical efflux (Fig. 18A) resulted in EfR values that exceeded unity but approached unity at high CD,0 when the apical efflux transporter was becoming saturated. Similar to the linear case, lower EfR values were found at higher CLd. A reverse trend was observed for saturable apical influx, showing EfR values below unity (Fig. 18B); increasingly higher EfRs resulted with higher CLd and CD,0. With saturable metabolism, an upswing then downswing pattern was observed for EfR with CD,0, and the changes were more pronounced for higher CLd (Fig. 18C). For saturable apical efflux, influx, and metabolism, rapid drug entry by passive diffusion (high CLd) counteracted the effects of the saturable process on EfR. Eventually, the EfR values returned to unity when the apical efflux, absorptive, or metabolic process failed to contribute significantly to the system with increasing CD,0, as if only passive diffusion prevailed under linear conditions (Fig. 5; eq. 12).
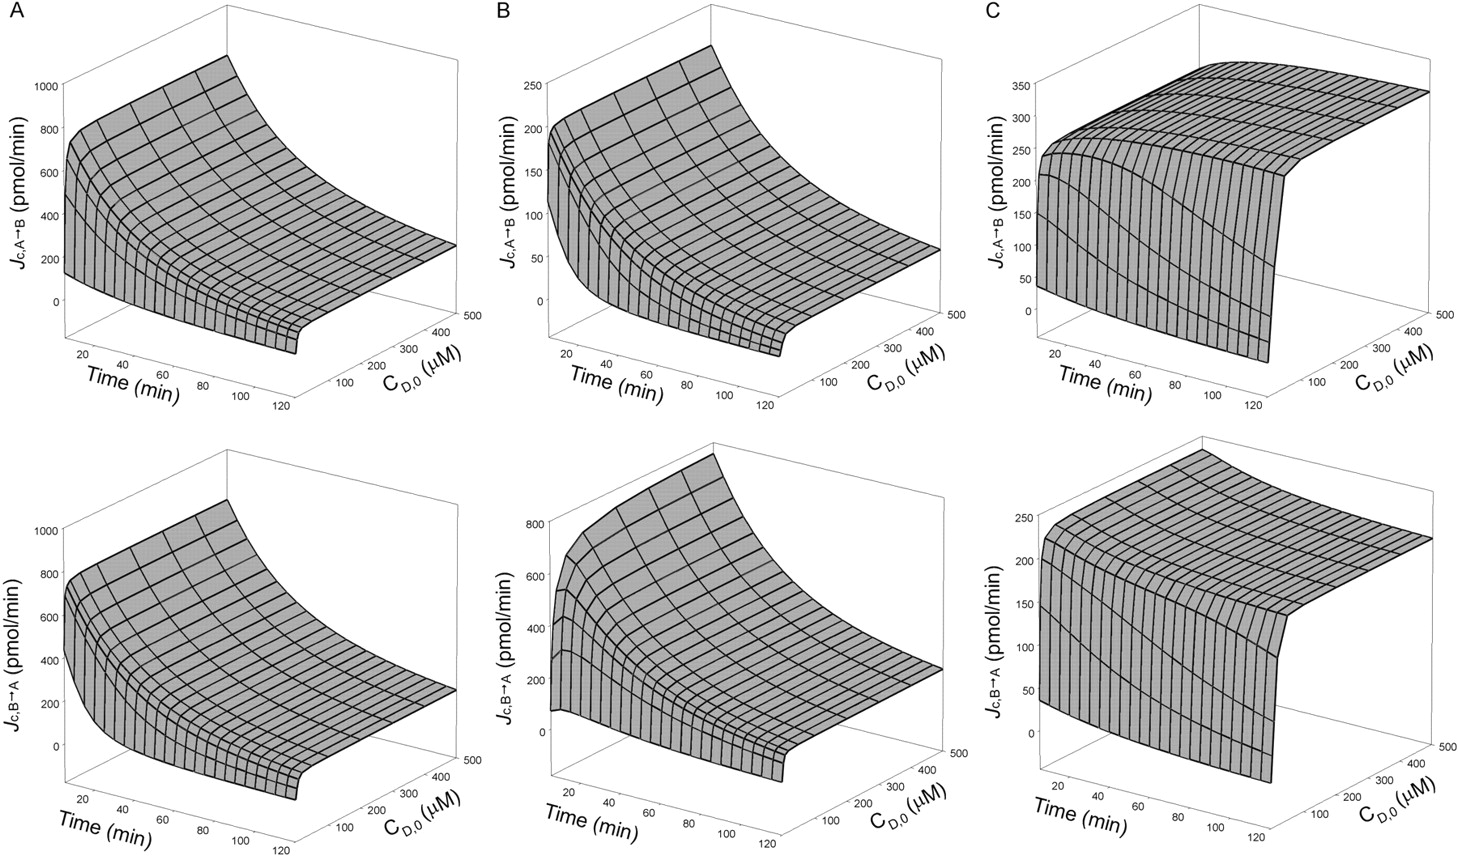
Time- and concentration-dependent profiles of Jc in A→B (upper panel) and B→A (lower panel) directions when saturation of (A) apical efflux (Vmax = 0.5 nmol/min, Km = 0.5 μM; CLinflux = CLefflux = CLabs = CLint,met = 0), (B) apical absorption (Vmax = 0.5 nmol/min, Km = 0.5 μM; CLinflux = CLefflux = CLint,sec = CLint,met = 0), and (C) metabolism (Vmax = 0.5 nmol/min, Km = 0.5 μM; CLinflux = CLefflux = CLint,sec = CLabs = 0) were examined. The simulations were set as follows: CLd1 = CLd2 = CLd3 = CLd4 = CLd = 0.1 ml/min; the unbound fractions were set to unity.
Other Simulations. Other scenarios such as saturation of basolateral influx or basolateral efflux were not examined. This was because the patterns generated would be similar to those simulated for saturation of apical influx and apical secretion (mirror images for donor versus receiver side), although minor differences would exist due to differences in volumes (Vap and Vbaso).
Discussion
The Caco-2 system has become the gold standard to relate drug permeability to oral drug absorption (Hidalgo et al., 1989; Lentz et al., 2000; Polli et al., 2001; Thiel-Demby et al., 2004). Due to the prevalent use, a thorough examination in revisiting the terminologies used in literature and data interpretation in the Caco-2 monolayer is therefore justified. Equation 1 was established under Fick's law to define drug permeability, Papp, with the assumptions that the driving force is the concentration gradient difference and a single barrier exists for the Caco-2 monolayer (Hilgers et al., 1990). Although Papp is a time-dependent variable and higher Papp is associated with higher CLd, the ratio of Papp (Papp,B→A/Papp,A→B) yields a meaningful EfR that is time-independent and CLd-invariant when transporter activity is absent.
The meaning of EfR under linear conditions was further clarified by eq. 12. As shown in eq. 12, EfR is dependent not only on the apical, secretory intrinsic clearance (CLint,sec) but also on the relative magnitude of passive diffusion and transport clearances at the basolateral membrane (CLd1 + CLinflux)/(CLd2 + CLefflux), CLd3 and CLd4, and the apical absorptive clearance CLabs. Hence, the value of EfR may not always identify whether a test compound is a Pgp substrate. For drugs of rapid uptake clearances at the apical membranes, values of EfR are reduced by high CLd4 (eq. 14) or CLabs values (Fig. 5); the asymmetrical influx and efflux on basolateral membrane (CLinflux/CLefflux) can also modulate the EfR. The same comment was made by Adachi et al. (2001). Even with the simplification that CLabs = 0 and all diffusive clearances are identical (CLd1 = CLd2 = CLd3 = CLd4), values of EfR may still hover around unity for drugs whose diffusion clearance (CLd4) is high in relation to that of the secretory clearance (eq. 14) (Lentz et al., 2000).
In addition, EfR will be affected differentially by secretion and metabolism under linear conditions. Pgp-, BCRP-, or MRP2-mediated efflux tends to provide higher EfR values when CLint,sec >> CLd and when the passive diffusion clearance (CLd) is low, rendering asymmetry in permeability from the B→A direction over the A→B direction (Fig. 3). For solutes of high CLd, ambiguous EfR values (close to unity) may result unless CLint,sec is extremely high (Fig. 3A). The possibility that the compound is a Pgp substrate needs to be clarified with use of inhibitors by the AQ and SQ (eqs. 3 and 4). For solutes with low CLd, higher EfR values will result as a consequence of secretion for Pgp substrates (Fig. 3B). By contrast, EfR is not affected by metabolism; the metabolic intrinsic clearance affects Papp in the B→A and A→B directions to the same extent, thereby EfR remains unchanged (Fig. 4). The extent of metabolite formation in the A→B direction is higher than that in the B→A direction. The pattern is inherently asymmetric simply because of unequal Vap and Vbaso, and metabolite formation is reduced by apical secretion in both directions (Fig. 6).

Modulation of metabolite formation (CLint,met = 0.01 ml/min) by saturable efflux (A, E) or influx (B, F) on the apical membrane, or efflux (C, G) or influx (D, H) on the basolateral membrane, for drugs of high CLd (CLd = CLd1 = CLd2 = CLd3 = CLd4 = 1 ml/min) (A–D) or low CLd (0.01 ml/min) (E–H). Simulation was performed at CD,0 = 100 μM when only one saturable pathway existed (Km = 0.5 μM and Vmax was varied from 0.5 to 50 nmol/min); all the unbound fractions were set to unity.
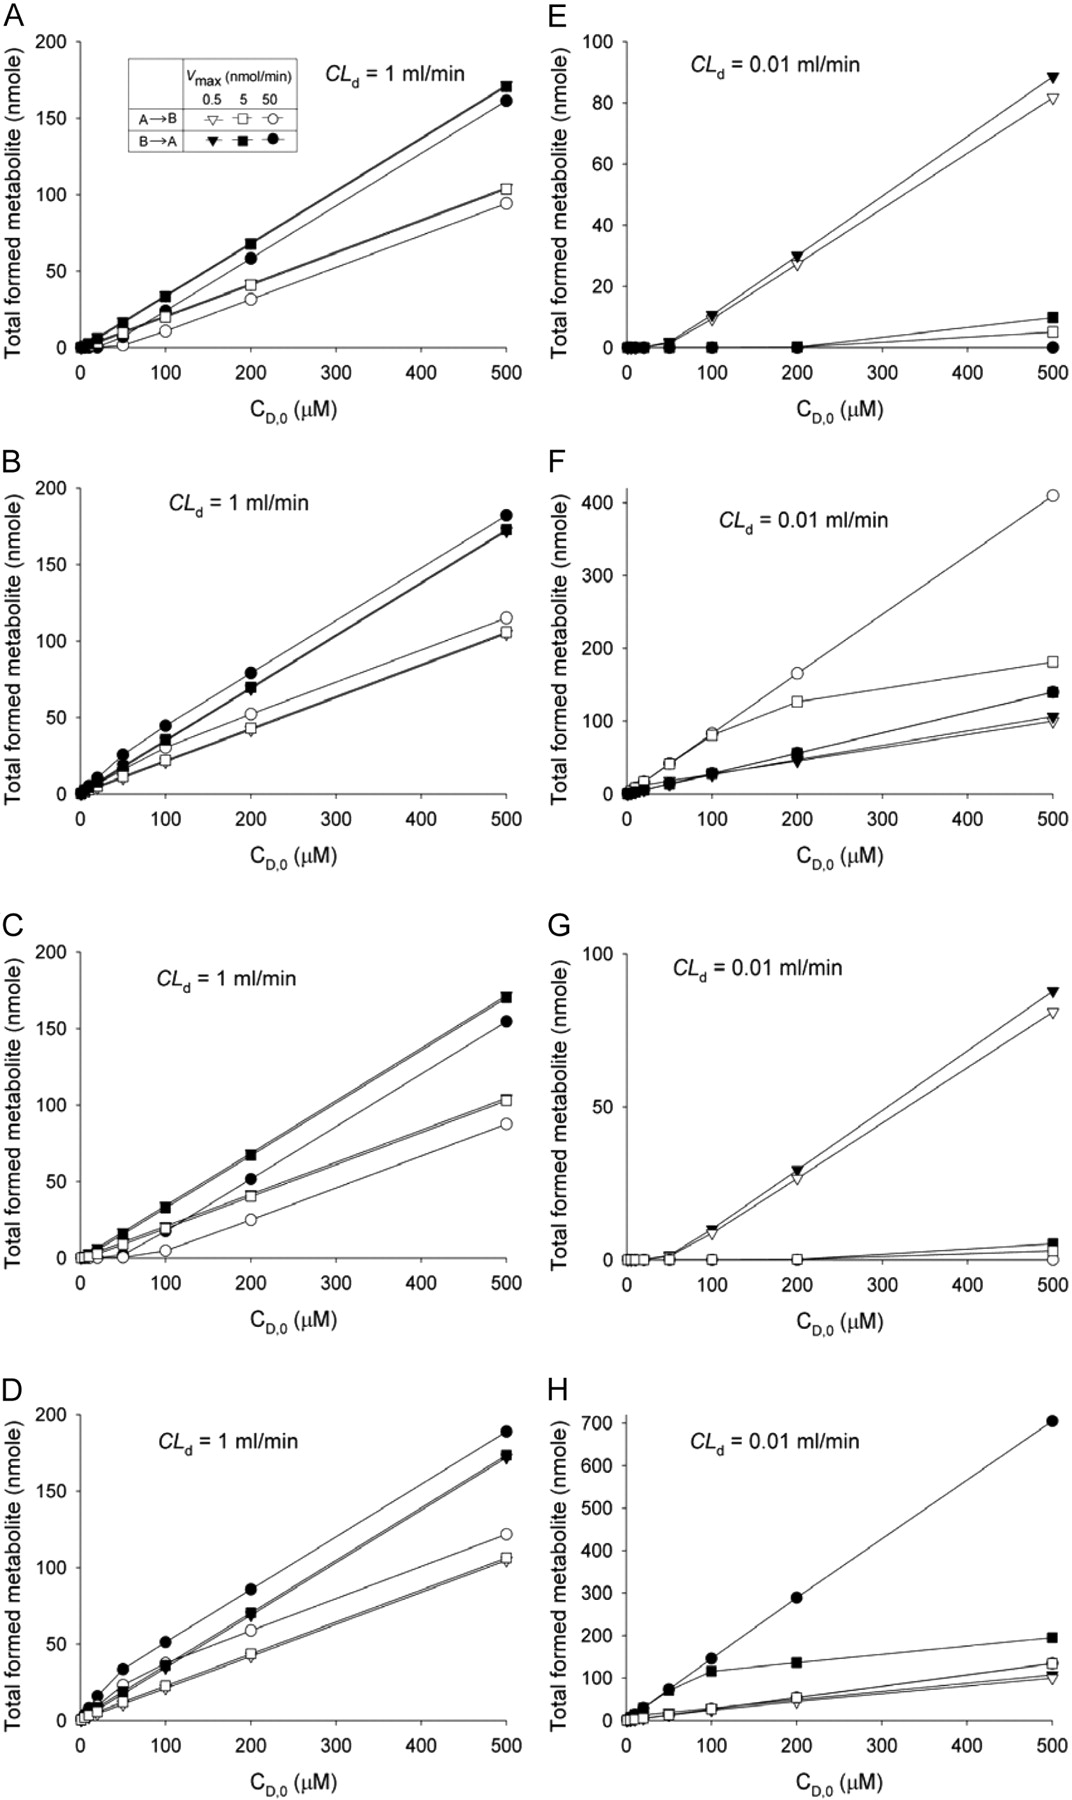
Modulation of metabolite formation by saturable efflux (A, E) or influx (B, F) on the apical membrane, or efflux (C, G) or influx (D, H) on the basolateral membrane, for drugs of high CLd (CLd = CLd1 = CLd2 = CLd3 = CLd4 = 1 ml/min) (A–D) or low CLd (0.01 ml/min) (E–H). Simulation was performed for CD,0 = 1 to 500 μM, with sampling at 1 h, when only one saturable pathway existed (Km = 0.5 μM and Vmax was varied from 0.5 to 50 nmol/min); CLint,met = 0.01 ml/min, and all the unbound fractions were set to unity.
Saturation of transport and metabolic processes, however, will be encountered with increasing drug loading concentration within the Caco-2 cell system. The biggest disappointment in other existing data interpretation strategies lies in treating the Caco-2 cell system as a single barrier for parameter estimates of saturable processes. Even when perfect data for Pc and Jc are attainable with use of “specific” inhibitors that completely block the secretory process, or when transport/metabolic activities are associated only with transfected but not mock-transfected cells to enable precise measurements, the Jmax and  estimates are far from the true values (Tables 1, 2, 3, 4, 5, 6). The method, based on the assumption that the Caco-2 cell system is a single barrier, will yield inappropriate estimates.

Modulation of the efflux ratio estimated at 1 h for sampling by saturable apical efflux (A), apical influx (B), and intracellular metabolism (C). The value of EfR = 1 is denoted by the dotted line. In (A) and (B), CLint,met = 0.01 ml/min. Only one saturable component (Vmax = 0.5 nmol/min and Km = 0.5 μM) was present at a time. For simulation, the following assumptions were made: CLd = CLd1 = CLd2 = CLd3 = CLd4 = 0.01, 0.1, or 1 ml/min; all the unbound fractions equaled unity.
In addition, the time of sampling (Fig. 15), the passive permeability of drug, tissue binding, and metabolism, and the parameter space of Km and Vmax strongly influence both the correlation and accuracy of prediction. Saturation in apical absorption, efflux, or metabolism in the Caco-2 system results in similar Eadie-Hofstee plots for the receiver side that show nonconformity to simple Michaelis-Menten kinetics (Figs. 9C, 11C, and 13C). The net flux is a consequence of multiple processes involving more than a single barrier, and CD,0 cannot estimate the substrate concentration in the vicinity of the transporter or enzyme. The estimated Jmax is poorly correlated to the true Vmax, especially for substrates of low diffusive clearance (CLd < 1 ml/min); the observation persists when apical influx, secretion, or cellular metabolism is the saturable process (Figs. 10, 12, and 14, A–C; Tables 1, 3, and 5). Jmax is correlated with the true Vmax only for solutes of high CLd for apical secretion and absorption but not for cellular metabolism (Figs. 10C, 12C, and 14C). An improved correlation is also observed with reduction of assigned values of Vmax (<20 nmol/min) or increased values of CD,0 for simulation (data not reported). By contrast, a linear correlation is found between the estimated  or
or  and Km when apical influx, secretion, or cellular metabolism is the saturable process (Figs. 10, 12, and 14, D–F; Tables 2, 4, and 6). The finding is in contrast to that of Bentz et al. (2005), who commented that a better correlation existed between Jmax and Vmax and not
  or
or  and Km. The correlation is again dependent on values of CLd, since drugs with higher CLd equilibrate faster between the donor, cellular, and receiving sites, rendering improvement in the correlation (Figs. 10, 12, and 14; Tables 1, 2, 3, 4, 5, 6).
  , the parameter obtained by fitting Pc to the Hill-equation-like formula, fails to furnish additional physical meaning or improvement over
  in the correlation with Km. The existence of correlation between effective and true parameters (Jmax versus Vmax and
  or
or  versus Km) is useful (Figs. 10, 12, and 14), since changes in Jmax or
  (e.g., induction or inhibition) would commensurate with those of Vmax or Km, rendering useful interpretation on inhibition or induction of transporter or enzyme in the Caco-2 cell system.
For the description of added complexities such as carrier-mediated transport, intracellular metabolism, and saturation of the above processes, we propose use of the catenary model (Fig. 1) for proper data interpretation in the Caco-2 system. The presentation of mass transfer (Appendix) in this kinetic model had allowed us to simulate data over time to conduct a thorough theoretical examination on transport and metabolism. Through this exercise, we obtained analytical solutions for EfR under linear conditions and examined the effects of transport and metabolic intrinsic clearances (CLd1,CLd2,CLd3,CLd4,CLint,sec,CLabs, and CLint,met). Moreover, the model yielded data on Pc, PPD, and Jc under nonlinear conditions for illustration with the Eadie-Hofstee plots. Although saturation of the basolateral influx or efflux process was not simulated, these patterns could be inferred because the data would be mirror images of saturable apical influx and efflux. For the first time, trends in EfR according to CLd and CD,0 with varying saturable processes were shown (Fig. 18); EfR values greater than unity would not conclusively reflect involvement of apical efflux transporters since the same trends were observed with saturation in metabolism (Fig. 18C). Although we had not explored a wide parameter space, the analyses showed that the single barrier model for the Caco-2 cell monolayer was inadequate to provide sound estimates of Vmax and Km of saturable systems.
The usefulness of the catenary model has been demonstrated fully by the present analysis. In this model, the timed samples collected are utilized fully for data fitting. However, due to the large number of parameters to be ascertained and saturation of one or more of the processes, the fit of the timed-metabolite data may not always lead to fruitful outcomes. The usual strategy is to add the total amount of formed metabolite (amount in cell + donor + receiver compartments) to describe metabolism in the fitting procedure. Additional data on metabolite transport or metabolic data are absolutely necessary and would greatly add to the accuracy of the fit. The model was able to describe saturable efflux (Ito et al., 1999), saturable apical absorption, and basolateral influx (Irie et al., 2004), and recently, saturable metabolism and substrate inhibition (H. Sun, L. Zhang, E. C. Chow, G. Lin, K. S. Pang, and Z. Zuo, unpublished data). Proper data interpretation with the catenary model would definitely remove the bias in parameter estimates, avoid viewing the Caco-2 cell monolayer as a single barrier, and provide accurate estimates.
Appendix
Mass Balance Equations in Caco-2 Cell Monolayer for Linear Conditions
In the apical compartment:  In the cellular compartment:
  In the basolateral compartment:
Mass Balance Equations in Caco-2 Cell Monolayer for Nonlinear Conditions
For Saturation of Apical Secretion
In the apical compartment:  In the cellular compartment:
  In the basolateral compartment:
For Saturation of Apical Absorption
In the apical compartment:  In the cellular compartment:
  In the basolateral compartment:
For Saturation of Cellular Metabolism

In the cellular compartment:  In the basolateral compartment:
Footnotes
-
This work was supported by the Canadian Institute for Health Research, Grant MOP64350.
-
Article, publication date, and citation information can be found at http://dmd.aspetjournals.org.
-
doi:10.1124/dmd.107.015321.
-
ABBREVIATIONS: ABC, ATP-binding cassette; Pgp, P-glycoprotein; MRP, multidrug resistance-associated protein; BCRP, breast cancerresistant protein; GF120918, N-(4-[2-(1,2,3,4-tetrahydro-6,7-dimethoxy-2-isoquinolinyl)ethyl]-phenyl)-9,10-dihydro-5-methoxy-9-oxo-4-acridine carboxamide; A, apical; B, basolateral; CD,0, initial loading concentration in donor side at t = 0; Papp, effective permeability; EfR, efflux ratio; MK571, 3-[[3-[2-(7-chloroquinolin-2-yl)vinyl]phenyl]-(2-dimethylcarbamoylethylsulfanyl)methylsulfanyl] propionic acid; PPD, passive permeability; DR and Dcell, drug amounts in receiver and cell, respectively; AQ, absorptive quotient; SQ, secretory quotient; Mettotal, total amount of metabolite; ER, extraction ratio; CLint,sec, intrinsic clearance for apical efflux, mediated by transporters; CLint,met, metabolic intrinsic clearance; CLabs, intrinsic clearance for apical absorption, mediated by transporters; CLinflux and CLefflux, intrinsic clearances for basolateral influx and efflux, respectively, mediated by transporters; CLd, passive diffusion clearance common across apical and basolateral membranes; CLd4 and CLd1, passive diffusion clearance from the apical and basolateral compartments into the cell compartment, respectively; CLd3 and CLd2, passive diffusion clearance from the cell compartment into the apical and basolateral compartments, respectively; Vap and Vbaso, volumes of buffer solution in the apical and basolateral compartments, respectively; Vcell, cellular volume; Pc, Jc, and Jmax, the permeability, flux, and apparent Vmax estimated for the carrier system, respectively;
 and , the apparent Kms estimated from the Eadie-Hofstee plot, with and without the Hill coefficient, respectively; fmet, fraction of dose metabolized.
 - Received February 23, 2007.
- Accepted October 9, 2007.


- The American Society for Pharmacology and Experimental Therapeutics


