


Abstract
The neonatal period of liver development is an often overlooked phase of development. For instance, ontogeny of xenobiotic-metabolizing enzymes can markedly affect biotransformation as the liver matures. To systematically examine the ontogenic gene expression patterns of cytochrome P450 genes (P450) in mice, the gene expression profiles of 19 xenobiotic-metabolizing P450 in Cyp1 to 4 families were determined. The mRNA levels in C57BL/6 mouse livers were quantified using branched DNA technology at the following ages: gestational day 17 (2 days before birth) and postnatal days 0, 1, 3, 5, 10, 15, 20, 30, and 45. Among the 13 P450 genes expressed in mouse livers, three distinct ontogenic expression patterns were identified by cluster analysis. Genes in group 1 (Cyp3a16 as well as 3a41b in male) were expressed in the perinatal period, but they were essentially nondetectable by 30 days of age. Genes in group 2 (Cyp2e1, 3a11, and 4a10 as well as 3a41b in female) quickly increased after birth and reached maximal expression levels by day 5. Genes in group 3 (Cyp1a2, 2a4, 2b10, 2c29, 2d22, 2f2, 3a13, and 3a25) were expressed at low levels until days 10 to 15, but they markedly increased at day 20 to a high and stable level. In conclusion, the developmental expression of P450 in mouse liver can be divided into three patterns, suggesting that different mechanisms are responsible for the expression of P450 during liver maturation.
Approximately three-quarters of drugs that are primarily cleared via metabolism are biotransformed by members of the cytochrome P450 (P450) superfamily. Humans have approximately 57 functional P450 enzymes, of which approximately 20 members in the CYP1, 2, 3, and 4 families are probably involved in drug metabolism. It has been known since the 1950s that P450 enzymes are not mature at birth (Fouts and Adamson, 1959); however, at that time, it was thought that there was only one or perhaps two P450 enzymes. Since the cloning of the P450 genes, ontogenic expression of some P450 genes in human livers has been reported (de Wildt et al., 1999; Koukouritaki et al., 2004; Blake et al., 2005; Leeder et al., 2005; Gaedigk et al., 2006; Hines, 2007). Based on hepatic ontogenic gene expression patterns, human drug-metabolizing P450 genes have been categorized into three developmental patterns (Hines, 2007). Considerable differences in the ontogenic gene expression contribute to variations in drug metabolism between children and adults. These differences result in children being less responsive to drug therapy and higher risks for adverse reactions for some drugs metabolized by P450 enzymes.
Variations in P450 gene expression among different individuals at different ages are due not only to ontogeny but also to genetic polymorphisms, environmental factors (e.g., diet and toxicants), and therapeutic agents (e.g., drugs). Moral, ethical, and technical limitations for studying human fetal and neonatal samples have precluded an in-depth understanding of the mechanisms controlling ontogenic expression of human P450 genes (Rowell and Zlotkin, 1997). Therefore, to understand the factors and mechanisms governing the developmentally programmed P450 gene expression patterns, it would be advantageous to have a laboratory animal model that can minimize the influences of genetics, environment, and scarcity of tissues.
Mice have been used to study ontogenic expression of P450 genes (Choudhary et al., 2003, 2005). These studies examined the expression of 40 P450 genes in embryonic developmental stages from E7 to E17 and in eight adult tissues. Some xenobiotic-metabolizing P450 genes are not expressed in embryonic developmental stages, but they are expressed in adult livers. However, there is a lack of expression data for the xenobiotic-metabolizing P450 genes during the postnatal period (i.e., after birth but before adult).
Mouse liver originates from the gut endoderm on embryonic day 8.5 (Douarin, 1975; Houssaint, 1980). One day later, the liver assumes the morphological appearance of hepatoblasts, which are capable of differentiating into either hepatocytes or bile duct epithelial cells (Shiojiri and Mizuno, 1993; Rogler, 1997). Hematopoietic stem cells migrate to the fetal liver at embryonic day 10.5 (E10.5) to generate numerous hematopoietic cells (Medvinsky and Dzierzak, 1996; Sánchez et al., 1996; Mukouyama et al., 1998). Thus, from E10.5 to E15, fetal liver is predominately a hematopoietic organ. By E14.5, immature hepatoblasts begin to differentiate into hepatocytes and bile-duct epithelial cells (Douarin, 1975; Houssaint, 1980). At gestation day 17, only 30% of liver is devoted to hematopoiesis (Marie and Cresteil, 1989; Sasaki and Sonoda, 2000), although hematopoietic stem cells are still observed in liver until postnatal day 5 (Apte et al., 2007). From the day of birth (19 days postcoitus) to postnatal day 9, the liver mass increases >3 folds (Sasaki and Sonoda, 2000). Rapid cellular proliferation between postnatal day 5 and day 20 has also been reported, and by postnatal day 30, mouse livers are histologically identical to livers of mice at 3 months (Apte et al., 2007). However, much is not known about how and when the xenobiotic-metabolizing P450 genes become activated or suppressed after hematopoiesis but before adulthood. Understanding the regulation of ontogenic expression is important because ontogeny affects both the expression and inducibility of xenobiotic-metabolizing genes during postnatal liver development (Fouts and Adamson, 1959; Rich and Boobis, 1997).
Mice have over 102 P450 enzymes (Nelson et al., 2004); however, the exact number involved in drug metabolism is not entirely clear. In the present study, 19 mouse P450 genes from families 1 to 4 were selected based on their sequence homology to the 19 human drug-metabolizing P450 genes (Table 1). Gene expression levels were quantified from gestational day 17 (day –2) to day 45 of age using a branched DNA signal amplification assay. Because of lack of specific antibodies against most of the mouse P450 proteins, gene expression at the protein level was not determined in this study. The data indicate that, in mice, there are also three developmental patterns of P450 expression. Some mouse P450 genes are similar, but others are not similar to their human homologous P450 genes.
Human P450 genes responsible for xenobiotic metabolism, and their homologous mouse genes
Materials and Methods
Animals. Eight-week-old C57BL/6 breeding pairs of mice were purchased from Charles River Laboratories, Inc. (Wilmington, MA). Mice were housed according to the American Animal Association Laboratory Animal Care guidelines and were bred under standard conditions in the Laboratory Animal Resources Facility at the University of Kansas Medical Center. The use of these mice was approved by the Institute of Laboratory Animal Resources (1996). Breeding pairs were set up at 4:00 PM and separated at 8:00 AM the following day. The body weights of the females were recorded each day to determine pregnancy status. Livers from male and female offspring were collected at the following 10 ages: day –2 (gestational day 17), 0, 1, 3, 5, 10, 15, 20, 30, and 45 days of age (n = 5), which represents periods of prenatal (day –2), neonatal (day 0 to 10), juvenile (day 15 to 30), and young adult (day 45). Due to the difficulty in distinguishing gender from days –2 to 5 mice, livers from male and female offspring of the same litter were pooled at each age to achieve the desired amount of tissue. From days 10 to 45, male and female liver samples were separated (5 males and 5 females per age). Livers were frozen in liquid nitrogen immediately after removal and stored at –80°C.
Total RNA Extraction. Total RNA was isolated using RNAzol B reagent (Tel-Test Inc., Friendswood, TX) according to the manufacturer's protocol. RNA concentrations were quantified using a NanoDrop Spectrophotometer (NanoDrop Technologies, Wilmington, DE) at a wavelength of 260 nm. The integrity of total RNA was evaluated by formaldehyde-agarose gel electrophoresis and confirmed by visualization of 18S and 28S rRNA bands.
Cyp mRNA Levels Quantified by the Multiplex Suspension Array. The mouse Cyp1a1, 1a2, 1b1, 2a4, 2b10, 2c29, 2c39, 2c66, 2d22, 2e1, 2f2, 2j6, 3a11, 3a13, 3a16, 3a25, 3a41b, 4a10, and 4f18 mRNA levels were quantified by the Multiplex Suspension Array according to the manufacturer's protocol (Panomics, Fremont, CA). In brief, individual bead-based oligonucleotide probe sets, specific for each gene examined, were developed by Panomics (panel identification: 20044). The genes and accession numbers are listed in Table 1, and they are also available at www.panomics.com. Three types of oligonucleotide probes were used: capture extenders, ligation extenders, and blockers. The capture extenders discriminate the target RNA via cooperative hybridization among the different capture beads within the bead array. On the first day, 6 μg of total RNA was loaded in each well and incubated overnight with bead-based probe sets. On the second day, signal amplification was mediated by amplification molecules that hybridize to the tail of the ligation extenders. Each amplification unit contains multiple hybridization sites for biotinylated label probes that bind Streptavidin-conjugated R-Phycoerythrin (Panomics). The resulting fluorescence signals were analyzed using a Bio-Plex 200 System Array reader with Luminex 100 X-MAP technology, and data were acquired using Bio-Plex Data Manager Software Version 5.0 (Bio-Rad, Hercules, CA). All data were standardized to the internal control, Gapdh, and reported as mean fluorescence intensity of specific mRNA normalized to Gapdh mRNA. The cutoff value for whether a gene is expressed at a detectable level was conservatively set at 1% of the Gapdh expression level. Information on method validation is available at www.panomics.com.
Statistical Analysis. Statistical differences of mRNA levels between male and female mice were determined at ages after day 5 by the Student's t test (JMP version 7.0; SAS Institute, Cary, NC). Gene expression data from either male or female mice were analyzed using a two-way hierarchical clustering method (JMP version 7.0) using Ward's minimal variance and displayed as a dendrogram.
Results
The NCBI HomoloGene Database (http://www.ncbi.nlm.nih.gov/sites/entrez/query.fcgi?db=homologene) was interrogated to find homologous genes in mice that are conserved for human P450 genes involved in drug metabolism. Table 1 lists the human P450 genes queried and their murine homologous P450 genes, GeneID, mRNA accession, protein accessions, and identity of DNA and protein sequences. Homologous sequences for human CYP2A6 and CYP2C9 were not annotated in mice. Most human P450 genes have only one homologous mouse gene, but some human P450 genes have multiple mouse homologues. For examples, CYP2A13 is homologous to Cyp2a4 and 2a5, CYP2C8 to Cyp2c66 and 2c65, CYP3A4 to Cyp3a11, 3a41a, 3a41b, and 3a44, CYP3A43 to Cyp3a25 and 3a57, whereas CYP4A11 is homologous to Cyp4a10 and 4a32. Only one mouse homolog was selected for each human P450 gene, with the exception of two Cyp3a, Cyp3a11, and Cyp3a41b, for CYP3A4, which encodes the most important P450 enzyme for xenobiotic metabolism.

Gene expression profile for Cyp1a2. Each bar represents the mean from n = 5 animals per age. Mice aged between days 2 to 5 were not separated by gender (see text) and are denoted as a mixed population. Error bars indicate means ± S.E. Units are expressed relative to Gapdh.
Ontogenic Gene Expression Patterns
Cyp1 Family. The mRNAs of Cyp1a1, 1a2, and 1b1 in mouse liver samples were examined, but only Cyp1a2 was detected. The developmental profile for Cyp1a2 mRNA is shown in Fig. 1. Cyp1a2 expression gradually increased between 1 and 20 days of age. Between 20 and 45 days of age, Cyp1a2 mRNA remained relatively constant.
Cyp2 Family. mRNA levels were detectable in perinatal mouse livers for Cyp2a4, 2b10, 2c29, 2d22, 2e1, and 2f2 but not for 2c29, 2c66, and 2j6. As shown in Fig. 2, Cyp2a4, 2c29, and 2f2 had similar expression profiles in that they were not expressed, or were expressed at low levels until day 10 or 15, and then dramatically increased to reach their respective plateaus. In contrast, Cyp2b10 was low at all ages, but it increased steadily over the first 20 to 30 days of life, reaching only ∼10% of Gapdh expression at days 30 and 45. Cyp2d22 displayed a similar expression profile as Cyp1a2, with expression gradually increasing from –2 to 20 days of age, followed by a relatively constant plateau from days 20 to 45. A distinct developmental expression was observed for Cyp2e1 in which the mRNA increased sharply from day –2 to day 0, and it remained relatively constant thereafter. Sexually dimorphic expression was observed after day 30 for Cyp2a4, with higher expression in female than in male mice. Cyp2c66 and 2j6 were nondetectable in the mouse livers at all ages.

Gene expression profiles for Cyp2a4, 2b10, 2c29, 2d22, 2e1, and 2f2. Bars represent the mean from n = 5 animals per age. Mice aged between days –2 to 5 were not separated by gender (see text) and are denoted as a mixed population. Error bars indicate means ± S.E. Differences (p < 0.05) in expression levels between males and females are indicated by an asterisk.
Cyp3 Family. Three general profiles of ontogenic development were also observed for the Cyp3a isoforms in mouse liver (Fig. 3). Cyp3a11 increases markedly between day –2 and day 0, then it remains constant until day 15, when it increases again to another steady level. Cyp3a13 and 3a25 show a similar increase in expression shortly after birth, decrease from days 3 to 5, and then increase to steady-state levels by day 20. Cyp3a16 is expressed around birth, increases at day 0, remains relatively constant until day 20, and then decreases to a nearly undetectable level by day 45. This expression profile was also quantified by real-time polymerase chain reaction with a similar ontogenic gene expression pattern (data not shown). Cyp3a41 in male mice have a similar expression profile as Cyp3a16, in that it is expressed high before birth and increased markedly during the first 3 days of life. However, the decrease in Cyp3a41b in female mice was not maintained, instead it increased at 30 days of age. The gender-difference data agree with the previous finding that Cyp3a41b is a female-specific enzyme in adult mouse liver (Sakuma et al., 2002).
Cyp4 Family. Cyp4a10 was expressed at very low levels at day –2 and increased at day 1. This surge at day 1 gradually declined throughout the next several days until day 30, when another surge in expression was noted. Although Cyp4a10 was detected in perinatal livers at high levels (Fig. 4), Cyp4f18 was very low at all ages (data not shown).
Hierarchical Clustering. The expression data from male and female genes were analyzed to determine the correlation of gene expression patterns among the P450 and to estimate the age that reflects a dramatic change in P450 gene expression in liver. Of the 13 P450 genes found to be expressed in liver and separated by gender, two-way clustering of the gene expression patterns with respect to age revealed three distinct clades of genes, which we simply define as groups 1, 2, and 3.

Gene expression profiles for Cyp3a11, 3a13, 3a16, 3a25, and 3a41b. Bars represent the mean from n = 5 animals per age. Mice aged between days –2 to 5 were not separated by gender (see text) and are denoted as a mixed population. Error bars indicate means ± S.E. *, p < 0.05.

Gene expression profile for Cyp4a10. Bars represent the mean from n = 5 animals per age. Mice aged between days –2 to 5 were not separated by gender (see text) and are denoted as a mixed population. Error bars indicate means ± S.E.

A, hierarchical clustering of expression profiles for 13 P450 genes expressed in livers of male C57BL/6 mice. The two trees describe the relationship between different gene expression profiles (left tree) and different ages (bottom tree). The dendrogram scale represents the correlation distances. Average expression from five animals per age is given by shaded squares. Dashed lines categorize the grouping of expression patterns into either group 1, 2, or 3. B, ontogenic profiles of average gene expression levels among the different groups.
In males, group 1 consists of Cyp3a16 and 3a41b; group 2 includes 2e1, 3a11, and 4a10; and group 3 has 1a2, 2f2, 2a4, 2c29, 2d22, 3a25, 2b10, and 3a13 (Fig. 5A). According to these data, the largest correlation distance with respect to age (as shown by the clade separation on the dendrogram scale) is observed between days 15 and 20. The mean relative expression levels for members of these groups are plotted on the expression/time curve in Fig. 5B. On average, group 1 genes are expressed higher than groups 2 and 3 genes before birth (day –2), increase substantially until day 3, then decrease and remain relatively constant until 15 days old, and then decrease to nondetectable levels after 30 days. Group 2 genes are also expressed at very low levels on day –2, but their gene expression increases more rapidly after birth, essentially reaching maximal expression levels by day 5. Group 3 genes are expressed at low levels at day –2, remain at low levels through day 10, but dramatically increase to a plateau at day 20.
Female mice also fall into three distinct groups: group 1 only has Cyp3a16; group 2 includes 2e1, 3a11, 3a41b, and 4a10; and group 3 contains Cyp1a2, 2a4, 2f2, 2b10, 2c29, 2d22, 3a13, and 3a25 (Fig. 6A). Similarly as with males, the largest correlation distance of the P450 gene expression levels on the dendrogram scale with respect to age is between 15 and 20 days of age. Most of the genes in female mouse liver clustered into the same groups as males, thus, it is not surprising that their average expression profiles are also similar (Fig. 6B). Only Cyp3a41b exhibits significant gender differences, and it belongs to group 2 in females but group 1 in males.
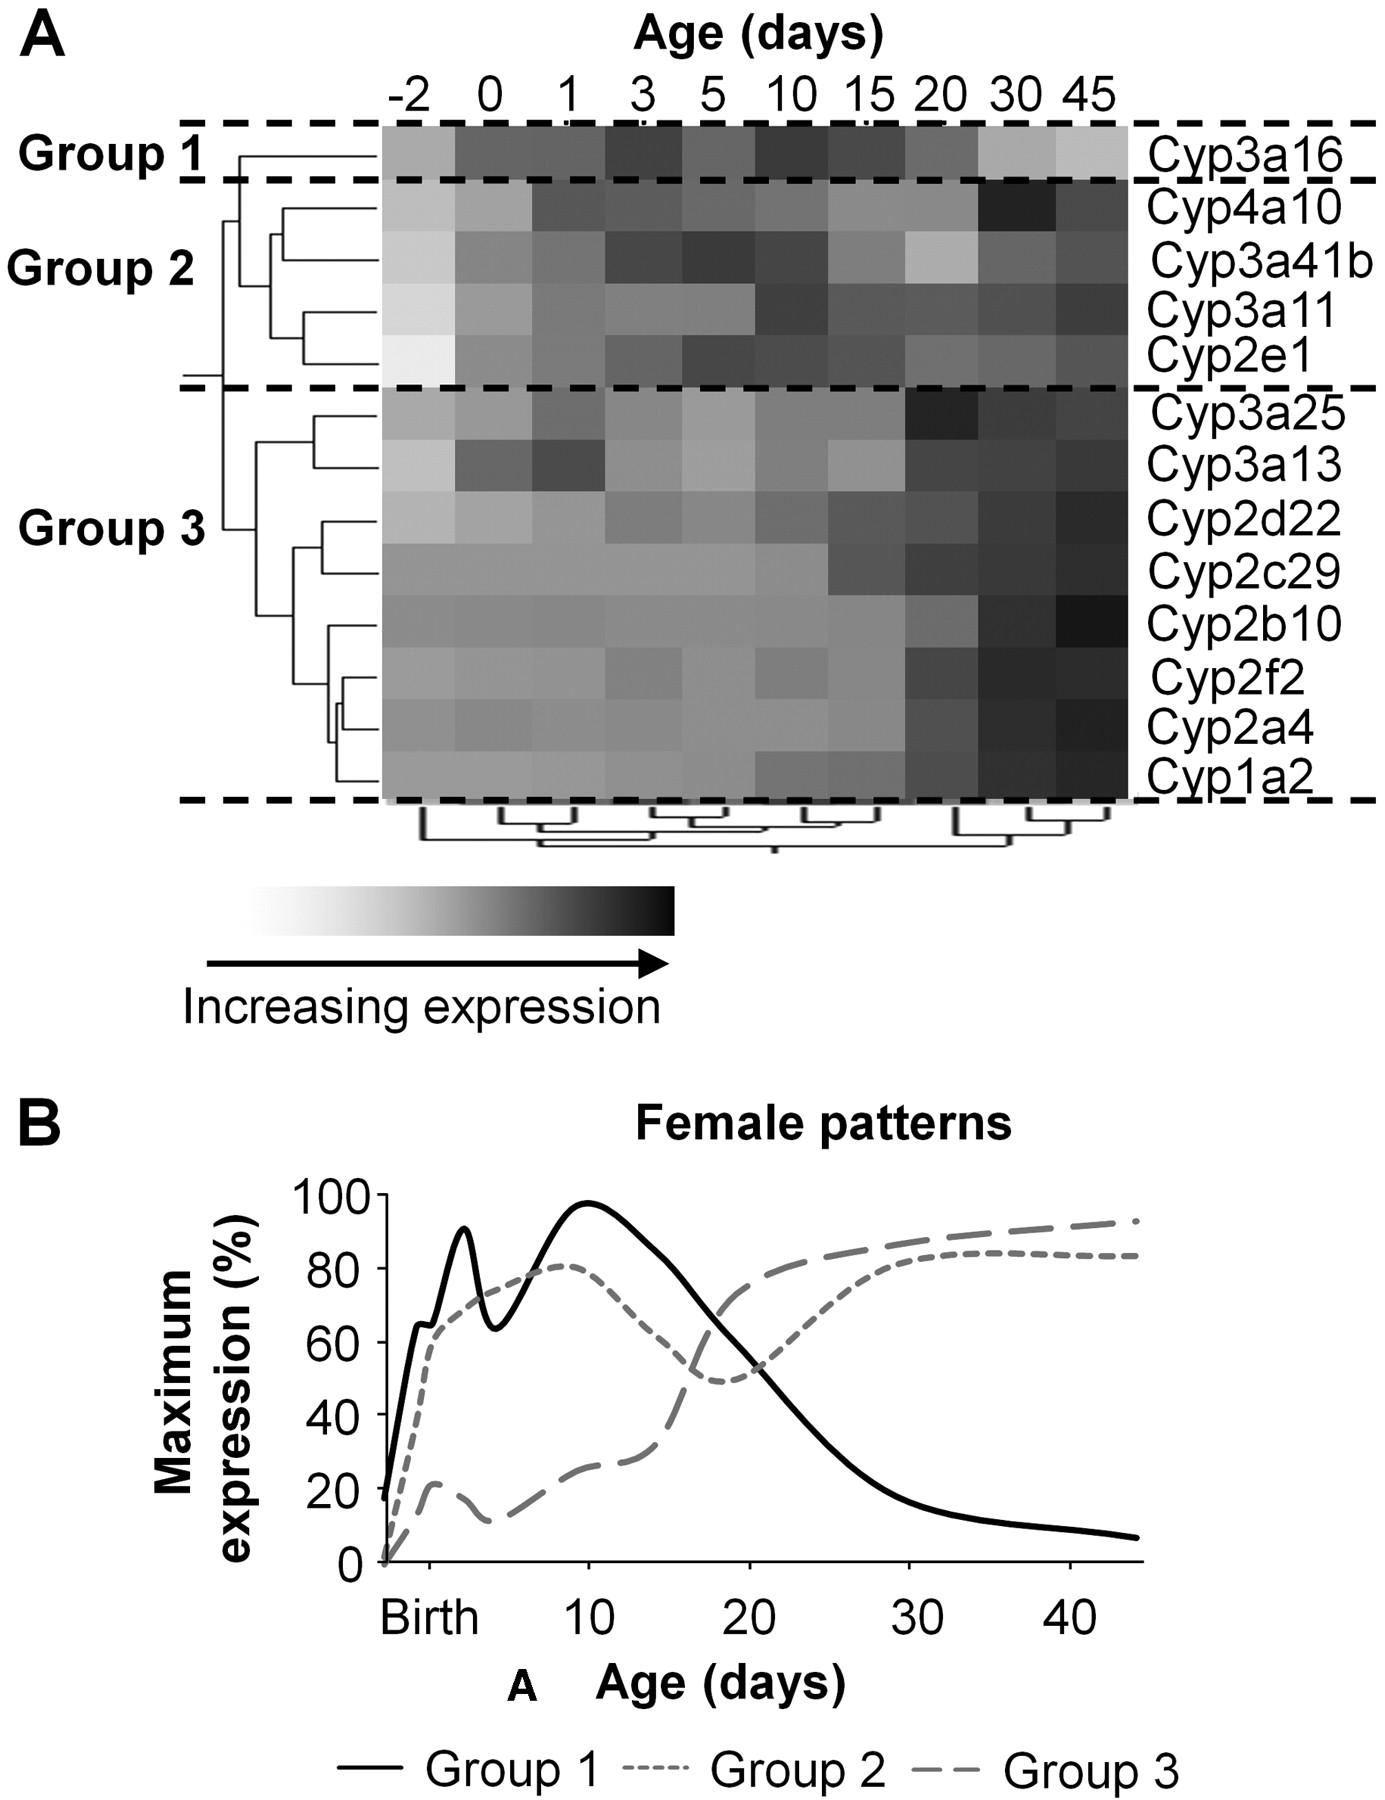
A, hierarchical clustering of gene expression profiles for 13 P450 isoforms expressed in livers of female C57BL/6 mice. The two trees describe the relationship between different gene expression profiles (left tree) and different ages (bottom tree). The dendrogram scale represents the correlation distances. Average expression from five animals per age is given by shaded squares. Dashed lines categorize the grouping of expression patterns into either group 1, 2, or 3. B, ontogenic profiles of the average gene expression levels among the different groups.
Discussion
The ontogenic expression patterns of 19 xenobiotic-metabolizing P450 genes in C57BL/6 mouse liver were characterized throughout postnatal liver maturation using a sensitive and quantitative technique, without potentially biasing amplification steps. Thirteen of the 19 P450 genes were classified as being expressed during postnatal liver maturation. Three expression patterns were identified in both male and female mice by two-way clustering analysis (Figs. 5B and 6B). Group 1 genes are restricted to the perinatal period, and they essentially disappear in the adult. Group 2 genes are expressed at low levels before birth, but they increase soon after birth and reach their maximal expression by postnatal day 5. Group 3 genes are expressed at low levels until days 10 to 15, but they markedly increase at day 20 to a stable high level thereafter. Only Cyp3a41b shows different mRNA expression patterns between male and female mice, and it is a female-specific enzyme in adult livers.
Based on hepatic ontogenic gene expression patterns, human P450 genes have also been categorized into three groups (Hines, 2007), but they are not completely the same as the mouse patterns reported in this study. P450 genes in the first group, such as CYP3A7, are expressed at high levels during prenatal and neonatal stages and then are silenced or expressed at low levels at 1 to 2 years after birth (Lacroix et al., 1997; de Wildt et al., 1999; Stevens et al., 2003). Mouse P450 genes in group 1 identified in this study have a similar expression pattern. Although not as highly expressed as CYP3A7 in human fetal liver, mouse Cyp3a16 (and Cyp3a41b in males) seem to be best correspond to the human CYP3A7 profile but on a dramatically condensed time scale. Human P450 genes in Hines' second group, including CYP3A5 and CYP2C19, are expressed at highly variable levels throughout development but generally independent of age (Wrighton et al., 1990; de Wildt et al., 1999; Stevens et al., 2003). No mouse P450 genes in the current study were expressed similarly to human CYP3A5 or CYP2C19. Human P450 genes in the third group, such as CYP2C9, CYP2D6, CYP2E1, and CYP3A4, are not expressed or are expressed at low levels in the prenatal stage, but they substantially increase their gene expression within the first 1 to 2 years of life (de Wildt et al., 1999; Koukouritaki et al., 2004; Hines, 2007; Stevens et al., 2008). Mouse P450 genes in group 2, including Cyp2e1, 3a11, and 4a10 (3a41b in female), are somewhat similar to the human group 3 albeit in a dramatically condensed time scale. For the majority of mouse P450 examined (group 3), the data show an alternative pattern that is not observed in human P450, where expression is relatively low until days 10 to 15 but then dramatically increases to adult levels by day 20.
Perhaps the most intriguing results are the marked differences in the expression profiles of the three groups of P450 between days 15 and 20. Although purely speculative, one can envision that these gene expression changes observed between 15 and 20 days are in response to dietary changes, because mice transition from milk to chow during this period. If this hypothesis holds true, then dietary factors may serve as signaling molecules to initiate a cascade whereby the liver becomes capable of responding to its environment, highlighting the importance of diet on gene expression patterning. Further studies, including measuring levels of individual P450 protein isoforms and catalytic activities, will be required when such technologies become available for mice.
The current study generates complementary knowledge on gene expression profiles during liver maturation to a previous study on the expression profiling of 40 mouse P450 genes in embryonic and adult tissues (Choudhary et al., 2003). The previous study examined the expression patterns of 40 P450 genes in four embryonic developmental stages (E7, E11, E15, and E17) and 8 adult tissues (8–12 weeks). The two sets of data together provide a complete picture of gene expression patterns of 12 P450 genes through embryonic development (E7–E17 before birth) and postnatal maturation (days 0–45) to adult (older than 8 weeks). The two sets of data have good concordance in the most examined P450 genes with one exception. Choudhary et al. (2003) indicated Cyp1a1 as being expressed in adult mouse liver, whereas this set of data indicates it is not expressed in the liver of adult mice. Further interrogation of the SymAtlas Gene expression database [http://symatlas.gnf.org/SymAtlas/ (Su et al., 2004)], a web application for publishing experimental gene expression datasets, supports our findings for absence of gene expression of Cyp1a1 in adult mouse liver. Furthermore, it is well recognized that CYP1A1 is expressed at very low levels in human livers (Westerink et al., 2008) but remains highly inducible (Drahushuk et al., 1998; Olinga et al., 2008; Pushparajah et al., 2008). Because Choudhary et al. (2003) used pooled samples from BALB/c mice, the possibility exists that the conflicting data are the result of different mouse strains used. The current study also provides ontogeny of gene expression during liver maturation in the Cyp2c66, 2c39, 2e1, 2j6, 3a16, 3a41b, and 4f18 genes, which were not included in the Choudhary studies (Choudhary et al., 2003).
The similarity in expression between mouse and human P450 homologues has previously been reported for CYP1A1, CYP1A2, and CYP2E1 (Choudhary et al., 2005); however, these comparisons were only made during fetal and adult stages, rather than determining patterns of expression occurring during the neonatal period. The ontogenic profiles of P450 gene expression in this study yield insight into the functional transition period of the liver in a critical developmental stage: after hematopoiesis and before adult.
Taken together, these data indicate that at least three different patterns of gene expression exist in xenobiotic-metabolizing P450 enzyme genes in mice. However, the mechanisms controlling the developmental patterning of P450 expression has not yet been determined. It is also not clear whether human P450 expression is regulated through similar mechanisms as mouse P450. Nevertheless, it is interesting to ponder why some P450 genes are expressed in the perinatal period (e.g., Cyp3a16), whereas others are not expressed until much later (e.g., Cyp1a2, 2a4, and 2f2). No doubt, the epigenetic environment, such as DNA methylation and histone modifications, may shed clues into the observed ontogenic expression patterns. The mechanisms responsible for the regulation of these expression patterns may be of considerable importance in understanding the kinetics of xenobiotic metabolism during the neonatal period.
Acknowledgments
We thank Ye Li, Scott Reisman, and Kaori Nakamoto for technical support.
Footnotes
-
This work was supported by National Institutes of Health [Grant 5P20 RR021940].
-
Article, publication date, and citation information can be found at http://dmd.aspetjournals.org.
-
doi:10.1124/dmd.108.023812.
-
ABBREVIATIONS: P450, cytochrome P450.
- Received August 25, 2008.
- Accepted October 6, 2008.
- The American Society for Pharmacology and Experimental Therapeutics


