


Abstract
Several antihistamine drugs including terfenadine, ebastine, and astemizole have been identified as substrates for CYP2J2. The overall importance of this enzyme in drug metabolism has not been fully explored. In this study, 139 marketed therapeutic agents and compounds were screened as potential CYP2J2 substrates. Eight novel substrates were identified that vary in size and overall topology from relatively rigid structures (amiodarone) to larger complex structures (cyclosporine). The substrates displayed in vitro intrinsic clearance values ranging from 0.06 to 3.98 μl/min/pmol CYP2J2. Substrates identified for CYP2J2 are also metabolized by CYP3A4. Extracted ion chromatograms of metabolites observed for albendazole, amiodarone, astemizole, thioridazine, mesoridazine, and danazol showed marked differences in the regioselectivity of CYP2J2 and CYP3A4. CYP3A4 commonly metabolized compounds at multiple sites, whereas CYP2J2 metabolism was more restrictive and limited, in general, to a single site for large compounds. Although the CYP2J2 active site can accommodate large substrates, it may be more narrow than CYP3A4, limiting metabolism to moieties that can extend closer toward the active heme iron. For albendazole, CYP2J2 forms a unique metabolite compared with CYP3A4. Albendazole and amiodarone were evaluated in various in vitro systems including recombinant CYP2J2 and CYP3A4, pooled human liver microsomes (HLM), and human intestinal microsomes (HIM). The Michaelis-Menten-derived intrinsic clearance of N-desethyl amiodarone was 4.6 greater in HLM than in HIM and 17-fold greater in recombinant CYP3A4 than in recombinant CYP2J2. The resulting data suggest that CYP2J2 may be an unrecognized participant in first-pass metabolism, but its contribution is minor relative to that of CYP3A4.
CYP2J2 is the only member of the human CYP2J subfamily known for its role in metabolizing arachidonic acid to physiologically important epoxides. Among the CYP2 family, CYP2J2 and CYP2C9 mRNA levels were found to be highly variable in human hearts, whereas CYP2C8 mRNA was measured in lower abundance (Delozier et al., 2007). Moreover, Delozier et al. (2007) found that CYP2J2 mRNA levels in the heart were approximately 10 times higher than those of CYP2C9 or CYP2C8. Besides high expression in heart tissue, CYP2J2 is present in other tissues as well (Wu et al., 1996). Based on mRNA levels, the abundance of this enzyme is greatest in the small intestine > heart > skeletal muscles > kidney > salivary glands > lungs > liver. CYP2J2 in the liver constitutes 1 to 2% of total cytochrome P450 (P450) content, which is similar to that in the small intestine (1.4% of total P450 content) (Paine et al., 2006).
CYP2J2 is known mostly for its role as the major human arachidonic acid epoxygenase in the heart and various other tissues. In addition to its endogenous role, CYP2J2 also plays a role in drug metabolism. A number of antihistamine drugs were identified as substrates of CYP2J2 including terfenadine, ebastine, and astemizole (Matsumoto and Yamazoe, 2001; Hashizume et al., 2002; Matsumoto et al., 2002; Liu et al., 2006; Lafite et al., 2007). In fact, CYP2J2 was shown to be the enzyme responsible for the first-pass metabolism of ebastine. However, the overall importance of CYP2J2 in drug metabolism and toxicity has not been established and a broad evaluation of potential substrates for CYP2J2 has not yet been conducted to understand the role, if any, this isoform plays in overall drug metabolism. Because CYP2J2 is predominantly expressed (based on mRNA) in the small intestine and heart, the importance of this isoform in drug metabolism may be appreciably underestimated because liver is the predominate tissue typically used in drug research to profile P450s and to estimate their contribution to the metabolism of new drug candidates.
In this study, the substrate diversity of CYP2J2 was investigated by evaluating 139 marketed drugs from different therapeutic classes. Mass spectral analysis was used to determine the loss of parent compound with time when compounds were incubated with recombinant CYP2J2. The substrates metabolized by CYP2J2 were then confirmed by metabolite identification using mass spectral analysis. Moreover, albendazole and amiodarone Michaelis-Menten-derived intrinsic clearances (ClINT) were determined in different in vitro expression systems, human liver microsomes and human intestinal microsomes, to further characterize CYP2J2 activity.
Materials and Methods
Chemicals.
Compounds (Table 1) used for CYP2J2 substrate assessment, furafylline, sulfaphenazole, quinidine, ketoconazole, methanol, buspirone, potassium phosphate (monobasic and dibasic), NADPH, glucose 6-phosphate, NADP+, glucose-6-phosphate dehydrogenase, and magnesium chloride were purchased from Sigma-Aldrich (St. Louis, MO). Montelukast was purchased from Cayman Chemical (Ann Arbor, MI). Benzylnirvanol, N-desethyl amiodarone, and albendazole sulfoxide were synthesized at Pfizer Global Research and Development (La Jolla, CA). CYP2J2 and CYP3A4 recombinant enzyme (Supersomes) and pooled human liver microsomes and pooled human intestinal microsomes were purchased from BD Gentest (Woburn, MA).
Compounds evaluated in recombinant CYP2J2
CYP2J2 Supersomes Incubations.
Assays were performed on a Biomek FX system (Beckman Coulter, Fullerton, CA). Recombinant CYP2J2 incubations contained substrate (1 μM, final organic 0.01% DMSO, and 0.6% acetonitrile), 100 pmol/ml recombinant CYP2J2, and 2 mM NADPH in a final volume of 200 μl of 100 mM potassium phosphate buffer, pH 7.4. After a 10-min preincubation period at 37°C, reactions were initiated with the addition of NADPH. Samples (25-μl aliquots) were removed at 0, 5, 10, 20, 30, and 45 min and quenched with 75 μl of cold methanol containing 0.1 μM buspirone (internal standard). Samples were then centrifuged at 3000 rpm (GH3.8A rotor; Beckman-Coulter) for 15 min. A 50-μl aliquot of supernatant was transferred to a clean 96-shallow well plate and combined with 50 μl of Milli-Q water, mixed, and analyzed with LC-MS/MS. All incubations were performed in triplicate, and compounds metabolized by CYP2J2 were confirmed by conducting triplicate experiments on three separate occasions.
Metabolite Identification of CYP2J2 Substrates.
All incubations (total volume 1.0 ml) were conducted at 37°C for 45 min in 100 mM potassium phosphate buffer (pH 7.4) containing magnesium chloride (10 mM), recombinant CYP2J2 Supersomes (0.17 mg/ml of protein), and NADPH (2 mM). Reactions were initiated by addition of substrate (15 μM) after preincubation of the reaction mixture for 3 min at 37°C. The final concentration of DMSO in the incubation mixture was <0.1%, and the final concentration of all organic solvents in the incubation mixture was <1%. Incubations that lacked NADPH or Supersomes served as negative controls. Reactions were terminated with 1 ml of acetonitrile and centrifuged at 3000g for 10 min.
Danazol and Nabumetone Reaction Phenotyping with Chemical Inhibitors.
Chemical inhibition experiments were performed using pooled human liver microsomes (HLM) and specific chemical inhibitors for CYP1A2, 2C8, 2C9, 2C19, 2D6, and 3A4. All inhibitors were considered competitive inhibitors. For danazol and nabumetone, 1 μM substrate (final organic concentration 0.01% DMSO and 0.6% acetonitrile) was mixed with 0.8 mg/ml HLM and 100 mM phosphate buffer (pH 7.4) were preincubated for 5 min at 37°C in an incubator on the Biomek FX system. The NADPH regeneration system was prepared fresh before the incubation at a concentration of 80 mM NADP+, 400 mM glucose 6-phosphate, and 80 units/ml glucose 6-phosphate dehydrogenase in phosphate buffer (pH 7.4). Reactions were initiated by the addition of the NADPH-regenerating system (one-eighth of the final volume) or an equal volume of buffer for negative controls. The final incubation volume was 200 μl. The concentrations of inhibitors in the final reaction were 30 μM furafylline (CYP1A2), 2 μM montelukast (CYP2C8), 5 μM sulfaphenazole (CYP2C9), 5 μM benzylnirvanol (CYP2C19), 1 μM quinidine (CYP2D6), and 1 μM ketoconazole (CYP3A4). At 0, 10, 20, and 45 min, 25-μl aliquots were removed and quenched with 75 μl of cold MeOH with 0.1 μM buspirone (internal standard). Samples were then centrifuged at 3000 rpm (GH3.8A rotor) for 15 min. A 50-μl aliquot of supernatant was transferred to a clean 96-shallow well plate and combined with 50 μl of Milli-Q water, mixed, and analyzed with LC-MS/MS.
Amiodarone and Albendazole Metabolism.
Amiodarone N-deethylation and albendazole S-oxidation kinetic assays were performed with a Genesis 150 automated system (Tecan Group Ltd., Männedorf, Switzerland). Reaction mixtures (500 μl/well) contained 470 μl of either 0.2 mg/ml HLM, human intestinal microsomes (HIM), 20 pmol/ml recombinant CYP3A4, or 40 pmol/ml recombinant CYP2J2 and amiodarone or albendazole (5 μl were added to incubation plate) to make the final concentrations ranging from 0 to 50 μM in each experiment. The reactions were initiated with 25 μl of 20 mM NADPH (1 mM final). For each amiodarone concentration, samples were collected at times of 0, 1.1, 2.6, 7.1, 11.7, 17.2, 22.7, 33.2, and 48.7 min at 37°C. Each reaction was terminated using 500 μl of ice-cold acetonitrile containing 0.01 μM buspirone. For albendazole, a time course linearity study was conducted as a pilot study, and a 20-min incubation time was optimal for linear kinetics and <15% substrate depletion. After a 20-min incubation, samples were terminated with 500 μl of ice-cold acetonitrile containing 0.01 μM buspiron. After mixing of the samples, the plates were centrifuged at 3000 rpm (GH3.8A rotor) for 15 min, and 200 μl/well was transferred to a separate 96-well polypropylene plate for LC-MS/MS analysis for metabolite formation.
LC-MS/MS Methods.
CYP2J2 metabolism study. The compounds of interest were introduced onto a Synergi Polar-RP (2 × 30 mm, 4 μ; Phenomenex, Torrance, CA) HPLC column with a CTC PAL autosampler (Leap Technologies, Carrboro, NC) and an integrated HPLC pumping system (Shimadzu Scientific Instruments, Columbia, MD). These compounds were then eluted and detected by an API 4000 triple quadrupole mass spectrometer (Applied Biosystems/MDS Sciex, Foster City, CA) fitted with a TurboIonSpray interface. Mobile phase A was 0.1% formic acid, mobile phase B was acetonitrile with 0.1% formic acid, and the flow rate was 0.8 ml/min. The initial condition for the HPLC gradient was 99:1 (A:B). This was held for 0.75 min. From 0.75 to 2.5 min, the mobile phase composition changed linearly to 5:95 (A:B). This condition was held until 2.6 min. The gradient was returned in a linear fashion to 99:1 (A:B) from 2.6 to 2.8 min and reequilibrated until 3.5 min. The injection volume was 10 μl. Multiple reaction monitoring was used to monitor the compounds as depicted in Table 2. The peak area ratio of the analyte to the internal standard was determined for each injection and used to measure substrate depletion.
Mass spectral m/z values and retention times
Cytochrome P450 reaction phenotyping.
An LC-MS/MS method similar to that in the CYP2J2 metabolism study was used for the P450 reaction phenotyping with specific chemical inhibitors. The initial condition for the gradient was 95:5 (A:B). From 0 to 0.3 min, the mobile phase composition changed linearly to 85:15 (A:B). From 0.3 to 1.5 min, the mobile phase composition changed linearly to 10:90 (A:B) and was held there until 1.7 min. The gradient was returned in a linear fashion to 95:5 (A:B) from 1.7 to 1.71 min and reequilibrated until 2 min.
Metabolite profiling.
Metabolite profiling and identification of metabolites in the microsomal incubations was achieved by separating the metabolites on a Kromasil C4 column (3.5 μm, 150 × 2.0 mm, Phenomenex) by reverse-phase chromatography at ambient temperature. The mobile phase consisted of 0.1% formic acid (solvent A) and acetonitrile (solvent B) and was delivered at 0.200 ml/min. The initial composition of solvent B was maintained at 1% for 5 min and then increased in a linear manner as follows: 20% at 8 min; 40% at 35 min, and 90% at 42 min. It was maintained at 90% for up to 45 min and then decreased to 1% in the next 5 min. The column was allowed to equilibrate at 1% solvent B for 5 min before the next injection. The HPLC effluent going to the mass spectrometer was directed to waste through a divert valve for the initial 5 min after sample injection.
Mass spectrometric analyses were performed on a ThermoFinnigan Deca XP ion trap mass spectrometer, which was interfaced to an Agilent HP-1100 HPLC system (Agilent Technologies, Palo Alto, CA) and equipped with an electrospray ionization source. The values for electrospray ionization were as follows: capillary temperature 270°C; spray voltage 4.0 kV; capillary voltage 4.0 V; sheath gas flow rate 90; and auxiliary gas flow rate 30. The mass spectrometer was operated in a positive ion mode with data-dependent scanning. The ions were monitored over a full mass range of m/z 125 to 1000. For a full scan, the automatic gain control was set at 5.0 × 10⁸, the maximum ion time was 100 ms, and the number of microscans was set at 3. For MSn scanning, the automatic gain control was 1.0 × 10⁸, maximum ion time was 400 ms, and the number of microscans was set at 2. For data-dependent scanning, the default charge state was 1, default isolation width was 3.0, and the normalized collision energy was 40 V.
Michaelis-Menten studies.
Samples were injected onto a Synergi Polar-RP (2 × 30 mm, 4 μ) HPLC column with a CTC PAL autosampler and an integrated HPLC pumping system. The metabolites of amiodarone and albendazole were detected by an API 4000 triple quadrupole mass spectrometer fitted with a TurboIonSpray interface. Mobile phase A was 0.1% formic acid, mobile phase B was acetonitrile with 0.1% formic acid, and the flow rate was 0.8 ml/min. The starting condition for the HPLC gradient was 99:1 (A:B). This was held for 0.3 min. From 0.3 to 1.2 min, the mobile phase composition changed linearly to 1:99 (A:B). This condition was held until 1.9 min. The gradient was returned in a linear fashion to 99:1 (A:B) from 1.9 to 1.95 min and reequilibrated until 2 min. The injection volume was 20 μl. Multiple reaction monitoring was used to monitor the compounds. Table 3lists the ionization mode, m/z transitions, and retention times for albendazole, amiodarone, and their metabolites. The peak area ratio of the analyte to the internal standard (buspirone) was determined for each injection and was used to measure substrate depletion.
Mass spectral conditions for albendazole, amiodarone, and metabolites
CYP2J2 Homology Model.
The three-dimensional model of the CYP2J2 structure was generated based on the crystal structures of CYP2B4 (Protein Data Bank code 1po5), CYP2C8 (Protein Data Bank code 1pq2), and CYP2A6 (Protein Data Bank code 1z10). These enzymes were chosen to model the CYP2J2 structure because they belong to the same CYP2 subfamily and were mostly free of internal mutations or bound ligands. The sequence of CYP2J2 was obtained from SwissProt (accession number NP_000766). A multiple sequence alignment between CYP2B4, 2C8, 2A6, and 2J2 was obtained after the first 36 amino acid hydrophobic region of CYP2J2 was removed. This alignment was used as input for the program Modeler 8.1 (Sali and Blundell, 1993) and a homology model was generated using a combination of molecular dynamics, simulated annealing, and restraints based on the known structures and the alignment. A more detailed description is available at http://salilab.org/modeller/tutorial. The homology model was evaluated for unfavorable bond angles and bond lengths and determined to be structurally reasonable based on Ramachandran plots.
Data Analysis.
In the determination of the in vitro t1/2, the analyte/internal standard peak area ratios were converted to percentage of drug remaining, using the T = 0 peak area ratio value as 100%. The slope (−k) of the linear regression from log percentage remaining versus incubation time was used in the in vitro t1/2 determination of t1/2 = −0.693/k. The t1/2 is then used to generate the intrinsic clearance (Clint) as in eq. 1:

Reaction phenotyping.
The half-life value was determined from the loss of parent plotted on a logarithmic scale of the natural log of the peak area ratio versus time as described above. The half-life value is incorporated in the organ scaled intrinsic clearance (Clint′) eq. 2:

Percent contribution for each isozyme was calculated using eq. 3:

Michaelis-Menten analysis of amiodarone and albendazole.
For kinetic parameters estimation for N-desethyl amiodarone (Vmax and Km) and hydroxyl amiodarone (Km), values were determined by a nonlinear least-squares algorithm. Data were fitted to the Michaelis-Menten equation (eq. 4), where Vmax is the maximum enzyme velocity, [S] is the substrate concentration, and Km is the Michaelis-Menten constant.

Kinetic parameters estimated for albendazole S-oxidation were determined by nonlinear least-squares regression. Data were fitted to the Michaelis-Menten equation as described in eq. 4 and to a substrate inhibition model (eq. 5). The best model to fit the data was determined using the Akaike information criterion (AIC). Ks defines the dissociation constant for the productive enzyme substrate complex, and Ki defines the dissociation constant for the inhibitory enzyme substrate complex whereby two substrates can bind to the enzyme active site:

Data modeling was performed using GraphPad Prism (version 5.01; GraphPad Software, Inc., La Jolla, CA).
Results
Recombinant CYP2J2 Metabolism of Various Compounds.
A total of 139 drugs from different therapeutic classes (Table 1) were evaluated for their potential to undergo metabolism by CYP2J2. Astemizole and terfenadine served as positive controls because both have been characterized previously as substrates for CYP2J2 (Hashizume et al., 2002; Matsumoto et al., 2002, 2003; Lafite et al., 2006). The metabolism of terfenadine by recombinant CYP2J2 is three times faster than that of astemizole, with Clint values of 3.98 and 1.14 μl/min/pmol CYP2J2, respectively (corresponding half-life values were 1.74 and 6.06 min for terfenadine and astemizole, respectively). For the newly identified CYP2J2 substrates, Clint values ranged from 0.06 to 0.49 μl/min/pmol of CYP2J2 (Table 4). Moreover, metabolism by CYP2J2 was confirmed by metabolite identification via mass spectral analysis.
Clint values for CYP2J2 substrates
Identification of Metabolites Generated from CYP3A4 and CYP2J2.
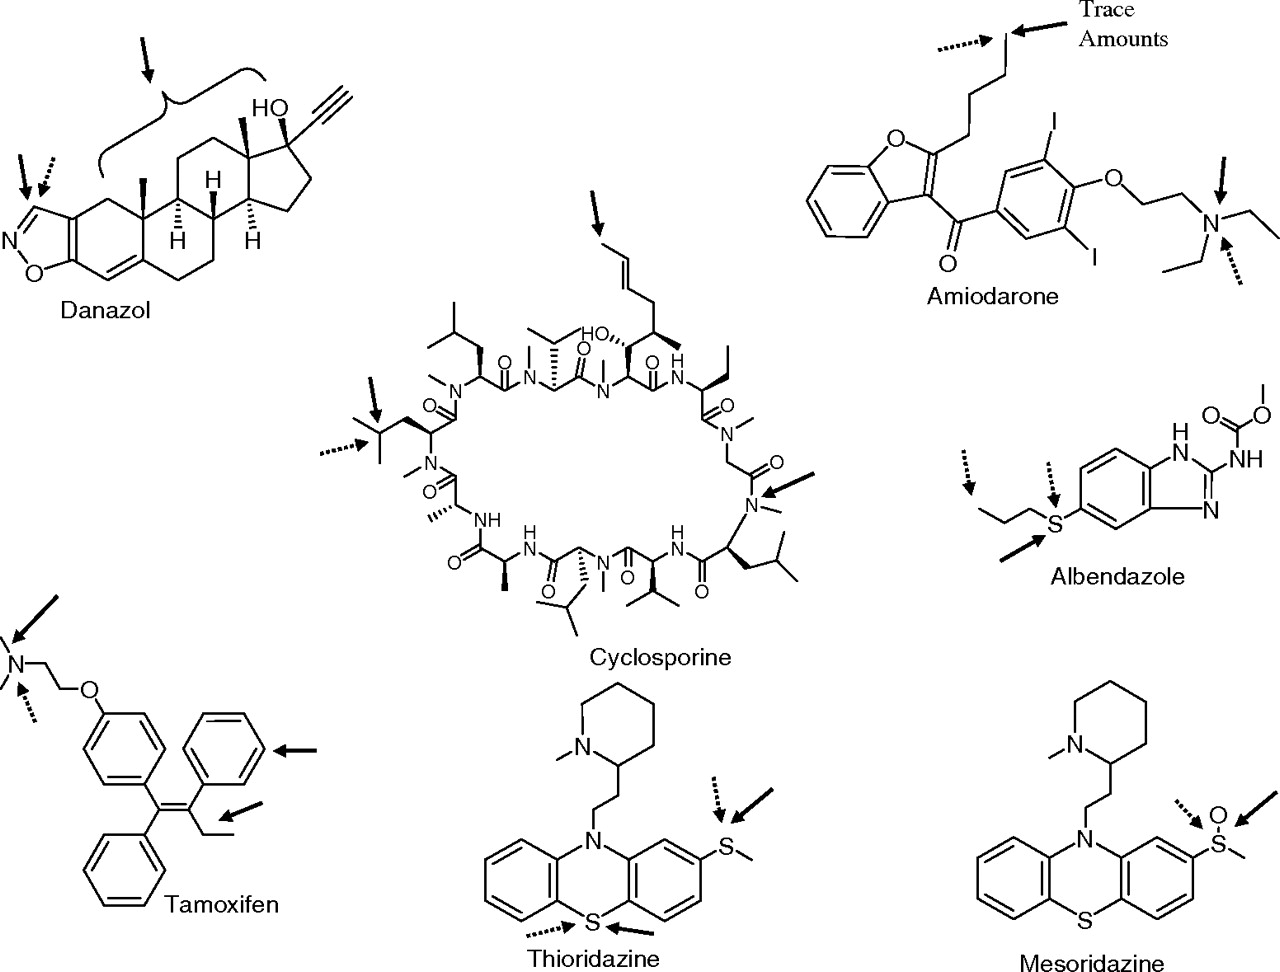
Of the 139 compounds examined, six compounds (albendazole, amiodarone, astemizole, thioridazine, mesoridazine, and danazol) showed relatively rapid turnover in incubations with expressed CYP2J2. Because all compounds were also metabolized by CYP3A4, a study to assess similarities and differences in the metabolites formed by CYP3A4 and CYP2J2 was conducted. Figure 1 depicts the site of metabolism by CYP2J2 and CYP3A4. Figure 2A shows the extracted ion chromatograms of metabolites observed in incubations of albendazole, amiodarone, astemizole, thioridazine, mesoridazine, and danazol with CYP3A4. Albendazole (Fig. 2Aa) was metabolized primarily to one oxidative metabolite, which was characterized as albendazole sulfoxide (M1) based on its mass spectrum, fragmentation pattern, and comparison to a synthetic standard. Likewise, metabolism of amiodarone by recombinant CYP3A4 resulted in only one metabolite, the N-deethylated product (M1) (Fig. 2Ab). The structure of the metabolite was confirmed from its mass spectrum, fragmentation pattern, and comparison to a synthetic standard. Trace amounts of hydroxylated amiodarone (M2) were also detected in CYP3A4 incubations when molecular ion was extracted from the total ion chromatogram. However, a proper structural elucidation of this metabolite was not possible given the weak mass spectrum of the metabolite in the MS/MS scan.

Substrate structures with arrows indicating sites of metabolism by CYP2J2 (dashed arrows) and CYP3A4 (solid arrows).

Chromatographic profiles of substrates after incubations with recombinant CYP3A4 (A) and CYP2J2 (B).
Incubation of astemizole with recombinant CYP3A4 resulted in several metabolites (Fig. 2Ac). Metabolites (M1–M3) eluting between 25 and 26 min showed an addition of 16 amu, suggesting hydroxylation of the parent compound; the exact site of hydroxylation was not determined. The peak at 25 min (M4) gave a molecular ion at m/z 325, suggesting N-dealkylation of the compound. A trace amount of the O-dealkylated metabolite (M5, m/z 445) was also observed in the incubation mixture, which coeluted with M1. Incubation of thioridazine with recombinant CYP3A4 resulted in two major metabolites (M1 and M2) (Fig. 2Ad) with molecular ions that were 16 Da greater than the parent. The mass spectral fragmentation of both metabolites showed a major loss of 16 amu, suggesting that both compounds were isomeric sulfoxide metabolites or a sulfoxide and possibly an N-oxide metabolite. Comparison of the retention time of M1 (27 min) with that of mesoridazine indicated that M1 resulted from sulfoxidation of the methyl sulfide moiety in thioridazine. Based on the previously published metabolism studies of thioridazine by CYP3A4 (Berecz et al., 2003), metabolite M2 was proposed as thioridazine 5-sulfoxide. Incubation of mesoridazine with recombinant CYP3A4 showed one peak in the extracted ion chromatogram with a molecular ion that was 16 amu greater than that of the parent (Fig. 2Ae). Addition of 16 amu in M1 suggested hydroxylation of the compound. The exact site of oxidation could not be ascertained from mass spectral fragmentation. However, metabolite M1 was tentatively proposed as a sulfone metabolite of mesoridazine. Incubation of danazol with CYP2A4 resulted in several hydroxylated metabolites (M1–M4) (Fig. 2Af). The mass spectra of all metabolites were similar. However, the loss of a water molecule in the mass spectra of all metabolites suggested that the steroid skeleton was the site of metabolism. Hence, the exact positions of hydroxylation could not be determined. In addition to the hydroxylated metabolites, two small peaks M5 and M6 with molecular ions of m/z 341 and 327 were also detected at retention times of 33 and 34.5 min in the total ion chromatogram of danazol incubation with CYP3A4 (which coeluted with M1–M4). The molecular ion of M5 suggested an addition of 3 amu to the molecular ion of the parent compound (m/z 341 versus m/z 338). Furthermore, an odd molecular ion of the metabolite indicated a possible loss of the nitrogen atom from the molecule. Based on the molecular ion, however, the metabolite was assumed to be a β-ketoaldehyde derivative of danazol, formed via the cleavage of the isoxazole ring. Likewise, metabolite M6 showed a molecular ion that is 11 amu less than the parent, and the odd molecular ion of M6 also indicated the possible loss of a nitrogen atom. The complex fragmentation pattern and small intensity of the metabolite made it difficult to elucidate a proper structure of the metabolites. The isoxazole cleavage products of danazol were detected previously in human urine (Rosi et al., 1977). The mechanism of the oxidative cleavage of the isoxazole ring in danazol is unknown.
Figure 2B shows the metabolic profiles of albendazole, amiodarone, astemizole, thioridazine, mesoridazine, and danazol after incubation with recombinantly expressed CYP2J2 enzyme. All compounds produced metabolites that were observed in CYP3A4-mediated incubation mixtures of these compounds. As seen from the chromatograms, however, the selectivity toward formation of these metabolites was quite different from that observed in CYP3A4 incubations. For albendazole, an additional metabolite was observed in the CYP2J2-containing incubation mixtures (Fig. 2Ba). Metabolite M2 observed in the CYP2J2 incubation of albendazole also showed a molecular ion of m/z 282 (addition of 16 amu like the sulfoxide, M1) suggesting hydroxylation of the molecule. The site of hydroxylation in M2 was the propyl group of albendazole as assessed by the mass spectral fragmentation of the metabolite (Fig. 2). Although the exact site of hydroxylation could not be determined from the mass spectrum, the terminal methyl group was proposed as the site of oxidation. Additional work is needed to ascertain the exact position of the hydroxyl group in the molecule.
Incubation of amiodarone with recombinant CYP2J2 gave two peaks (M1 and M2) (Fig. 2Bb). The molecular ions and retention times of M1 and M2 were similar to those observed in CYP3A4 incubations. Mass spectral analysis of M2 indicated that the butyl side chain was the possible site of metabolism (data not shown). The exact position of hydroxylation could not be determined from the fragment ions; hence, the metabolite cluster was assigned as M2. Incubation of astemizole with recombinant CYP2J2 mainly resulted in the O-dealkylated metabolite, M5 (Fig. 2Bc) and trace amounts of the N-dealkylated metabolite (M4). This was in contrast to the CYP3A4 metabolism of the compound, which also produced hydroxylated metabolites (Fig. 2Ac) in addition to the above metabolites. Incubation of thioridazine with CYP2J2 produced the same products as observed in CYP3A4 incubations; comparison of the two chromatograms indicated that mesoridazine was also the primary product in CYP2J2 incubations of thioridazine and metabolite M2 was produced in very small amounts by CYP2J2 relative to CYP3A4 (Fig. 2Bd). Similar to thioridazine, mesoridazine formed the same metabolite in CYP2J2 incubations (M2) as the one observed with CYP3A4. As discussed previously, the exact position of oxygen incorporation could not be ascertained from the mass spectral data.
Incubation of danazol with recombinant CYP2J2 resulted in fewer metabolites than with recombinant CYP3A4. In contrast with the several hydroxylated metabolites that were observed after incubation of danazol with CYP3A4, incubation with CYP2J2 resulted in only two metabolites (M5 and M6) (Fig. 2Bf) in small amounts. Studies to determine the structure of CYP2J2-mediated danazol metabolites are currently underway.
For both tamoxifen and cyclosporine, recombinant CYP2J2 and CYP3A4 formed one common metabolite, whereas CYP3A4 formed two additional hydroxyl metabolites (Fig. 1). The metabolism of nabumetone was also assessed by incubating the compound with recombinant CYP2J2 and CYP3A4. However, interpreting the mass spectral data for this compound was difficult because of poor ionization, but the metabolites were also observed by UV (data not shown).
Comparative Metabolism of Several Substrates in HLM and HIM.
Thioridazine, mesoridazine, albendazole, and amiodarone were incubated in HLM and HIM. The metabolic profiles were similar in the two biological matrices, and the major metabolites mediated by CYP3A4 were observed (data not shown). Moreover, the predominant CYP2J2-mediated hydroxyl amiodarone metabolite was observed in both HLM and HIM, but the unique CYP2J2-formed oxidative metabolite of albendazole was not detected probably because it is a minor metabolite.
P450 Reaction Phenotyping of Danazol and Nabumetone.
Many of the newly identified CYP2J2 compounds are also substrates for CYP3A4; however, information regarding the P450-mediated disposition of danazol and nabumetone in the literature is sparse. In this regard, P450 contributions to the metabolism of danazol and nabumetone were investigated in HLM as a greater number of active P450s are represented in this system than in HIM. The reaction phenotyping results in HLM showed that danazol is primarily a substrate for CYP3A4 (∼86% contribution) and to a lesser extent for CYP2D6 (∼11% contribution) and nabumetone is a substrate for CYP1A2 (∼50% contribution) and to a lesser extent for CYP3A (Table 5). In addition to the danazol and nabumetone results, the results in Table 5 contain reaction phenotyping results for the other CYP2J2 substrates collected from the literature.
Overlap with CYP3A4 metabolism
CYP2J2 and CYP3A4 Active Site Comparison.
The CYP2J2 homology model was built from multiple CYP2 crystal structures with no internal mutations and were mostly ligand-free. The active site cavities for CYP2J2 and CYP3A4 are depicted individually in Fig. 3, A and B, respectively, and Fig. 3C depicts an overlay of the two active sites with the I helix included for orientation. The cavity surfaces are rendered with mesh to highlight the differences in the active site, with the caveat that CYP2J2 is an approximation, given the lack of an authentic crystal structure. The homology model suggests that the active site volume for CYP2J2 is similar to that of CYP3A4 (1420 Å3 versus 1585 Å3); however, the geometry is quite different [solvent-occupied active site volumes calculated using the software package Voidoo (Uppsala University, Biomedical Centre, Uppsala, Sweden)]. It is anticipated that CYP2J2 is more constrained near the heme prosthetic group than CYP3A4. The constraint arises because of truncation of β-4, and the loop preceding the truncated sheet protrudes into the active site. The distance across the active site above the heme from the I helix to either the loop preceding the truncated β-4 (from Ala277 to Val346) in CYP2J2 is 9.4 Å, whereas the distance in from the I helix to β-4 in CYP3A4 (from Ala305 to Glu374) is 15.1 Å. For many of the newly identified substrates, there is broad overlap in metabolism by CYP3A4 and CYP2J2. A single site of metabolism by CYP2J2 was observed for several of the compounds such as cyclosporine, tamoxifen, thioridazine, and mesoridazine, whereas CYP3A4 appeared to metabolize these substrates at multiple sites.

Comparison between the active site cavity volumes for human CYP2J2 (green, based on homology model) (A), CYP3A4 (red, Protein Data Bank 1tqn) active sites (B), and overlay of CYP2J2 and CYP3A4 (C).
N-Desethyl Amiodarone Kinetics.
The apparent kinetic parameters of N-desethyl amiodarone were determined in pooled HLM, pooled HIM, recombinant CYP2J2, and recombinant CYP3A4. For each system, the kinetic parameters were determined by monitoring metabolite formation over time in the presence of various substrate concentrations. The plots showing the initial formation rates of N-desethyl amiodarone as a function of amiodarone concentration in the various systems are shown in Fig. 4, A to D. The Michaelis-Menten-derived intrinsic clearance (ClINT = Vmax/Km) of N-desethyl amiodarone was 4.6-fold greater in HLM than that observed in HIM (Table 6). The kinetic parameters for recombinant enzymes CYP3A4 and CYP2J2 are also shown in Table 6. Recombinant CYP3A4 ClINT was 17-fold greater than that observed in recombinant CYP2J2. An authentic standard of the hydroxyl amiodarone metabolite was not available; however, a Km of 3.89 μM was obtained for rCYP2J2 and is within the range observed in HLM and HIM (Table 6).

Concentration-dependent metabolism of amiodarone by pooled human liver microsomes (A), human intestinal microsomes (B), recombinant CYP2J2 (C), and recombinant CYP3A4 (D). The formation of N-desethyl amiodarone was monitored over time in the presence of increasing substrate concentrations. At each substrate concentration, incubation samples were collected over nine time points, and the initial velocities for N-desethyl amiodarone formation were determined and used to calculate the Michaelis-Menten kinetic parameters.
Michaelis-Menten kinetic parameters for amiodarone metabolism by HLM, HIM, recombinant CYP2J2, and recombinant CYP3A4 to N-desethyl amiodarone and hydroxy amiodarone by CYP3A4 and CYP2J2
Albendazole S-Oxidation Kinetics.
The Michaelis-Menten kinetic parameters of the S-oxide metabolite of albendazole were determined at a fixed reaction time (derived from a preliminary study evaluating initial velocity as a function of increasing substrate concentrations experiment) in the presence of various substrate concentrations. Unlike amiodarone, albendazole exhibited atypical or non-Michaelis-Menten kinetics, as P450 activity decreased at higher substrate concentrations (concentrations greater than Ks), consistent with substrate inhibition kinetics (Lin et al., 2001) in all reaction systems. The data were fitted to the Michaelis-Menten and substrate inhibition models. Selection of the best model was based on the AIC, in which the substrate inhibition model exhibited the lowest AIC value and provided the best fit. Representative profiles of product inhibition for albendazole S-oxidation in HLM, rCYP2J2, and rCYP3A4 systems are depicted in Fig. 5, A to C. The apparent kinetic parameters of albendazole S-oxidation in HLM, rCYP2J2, and rCYP3A4 are shown in Table 7. The Ki value was 3- to 11-fold greater than the Km value in the three enzyme systems.

Concentration-dependent metabolism of albendazole by pooled human liver microsomes (A), recombinant CYP2J2 (B), and recombinant CYP3A4 (C). The formation of albendazole S-oxide with increasing substrate concentration was determined at a single time point (20 min).
Michaelis-Menten kinetic parameters for albendazole S-oxidation by recombinant rCYP2J2 and rCYP3A4 and HLM
Discussion
The overall role of CYP2J2 in drug metabolism has not been determined to date. Several antihistamine drugs, including terfenadine, ebastine, and astemizole, have been identified as good substrates for CYP2J2, a P450 isoform predominantly expressed in the intestine and heart tissues, with low levels in the liver (Delozier et al., 2007). The extrahepatic contribution of CYP2J2 may result in higher than expected in vivo clearances from in vitro liver microsome evaluations. To investigate the substrate diversity and overall role in drug metabolism of CYP2J2, 139 marketed drugs from different therapeutic classes were screened as potential substrates for CYP2J2. From the compounds screened (Table 1), eight novel structures were identified as substrates for CYP2J2. Moreover, these substrates were confirmed by mass spectral metabolite identification.
The CYP2J2 substrates showed in vitro Clint values ranging from 0.06 to 0.49 μl/min/pmol of CYP2J2 (or in vitro t1/2 ranging from 14 to 120 min). These substrates, as shown in Fig. 1, belong to different therapeutic classes and vary in topology from relatively rigid structures such as amiodarone to large, more complex structures such as cyclosporine. However, compared with the antihistamine substrates, terfenadine and astemizole, the new substrates have appreciably lower Clint values, indicating a lower rate of metabolism. The limitations in using the substrate depletion method to identify potential CYP2J2 substrates lie in the inability to detect slowly metabolized compounds because of loss of protein activity and difficulty to ascertain true metabolism from experimental noise. As an example, diclofenac was evaluated in our study, in which the loss of parent compound was not appreciable, and it was not flagged as a substrate for CYP2J2; however, Lee et al. (2005) identified it to be a substrate when they examined metabolite formation. In the studies presented herein, metabolite identification served mainly to confirm metabolism by CYP2J2. Despite the challenges of the screening methodology, several structurally diverse compounds were identified. The intent of this work was not to identify all potential CYP2J2 substrates from our list of 139 compounds, as we recognize some low clearance compounds may have been missed.
The broad structural diversity of newly identified substrates, which include cyclosporine, suggests that the active site volume of CYP2J2 may be large, similar to that of CYP3A4 and CYP2C8 (Johnson and Stout, 2005). In fact, strong overlap in substrate recognition by CYP2J2 and CYP3A4 was observed among all the newly identified CYP2J2 substrates. Although the CYP2J2 model shown herein is a homology model built from the crystal structures of several CYP2 family members, it is still insightful to postulate how CYP2J2 is restrictive in its metabolism of large, bulkier substrates such as tamoxifen, thioridazine, mesoridazine, and cyclosporine. Unlike the homology model of Li et al. (2008), which was built using the crystal structure of CYP2C9 containing internal mutations and a ligand bound to the active site, the homology model presented herein was based on a number of CYP2 family members, with no internal mutations and free of bound substrate. Examining the structure of the active site of CYP2J2, β-4 is truncated and the loop preceding the truncated sheet protrudes into the active site, which limits access to the heme iron for oxidation. This finding is similar to the 3D homology CYP2J2 model constructed by Lafite et al. (2007). CYP2J2 has a more cylinder shape and is narrower than CYP3A4 near the heme iron, which probably limits CYP2J2 to metabolizing moieties that can extend closer toward the active heme iron. This restricted access and mobility around the heme iron may explain the greater selectivity of single site-mediated CYP2J2 metabolism observed for cyclosporine, tamoxifen, thioridazine, and mesoridazine, whereas CYP3A4 appears to metabolize these substrates at multiple sites because of the ability of these compounds to rotate more freely in the active site. Likewise, Lafite et al. (2007) found that CYP2J2 was more selective than CYP3A4 in the oxidation of terfenadone and its derivatives.
CYP2J2 forms a unique metabolite with albendazole, and the hydroxylated metabolite of amiodarone is formed predominantly by CYP2J2 as only trace amounts were produced by CYP3A4. In the case of danazol, incubations with CYP2J2 formed only a single metabolite in contrast with several metabolites formed by CYP3A4. Danazol may enter the active site through the substrate access channel bound by helices A and F′ and β-sheet 1 and is metabolized only when the isoxazole ring approaches the heme iron forming a metabolite that is 3 amu greater than the molecular ion of the parent compound. The odd molecular ion suggests a possible loss of nitrogen atom. If the nitrile portion of the structure approaches the heme, inhibition will probably occur as observed by Jones et al. (2008).
Two substrates were chosen for extensive kinetic analysis to determine differences between CYP2J2 and CYP3A4 in HLM and HIM because the mRNA levels of CYP2J2 are fairly high in the intestine (Bièche et al., 2007). The Michaelis-Menten-derived intrinsic clearance (ClINT) values observed for N-desethyl amiodarone in HLM and HIM reflect differences in Vmax values. The Vmax disparity is probably attributed to the contribution of CYP2C8 in HLM, which is present at lower levels in the intestine (Ohyama et al., 2000; Paine et al., 2006; Bièche et al., 2007). A comparison of recombinant CYP3A4 and CYP2J2 N-desethyl amiodarone activities showed a 17-fold difference due to a significantly greater Vmax contribution. Although the authentic standard for the unique hydroxyl metabolite of amiodarone was not available, the Km values of the hydroxylated metabolite were similar in the three systems (HLM, HIM, and recombinant CYP2J2), ranging from 3.89 to 14.9 μM. Plasma concentrations of amiodarone range from 0.65 to 5.7 μM in patients (Stäubli et al., 1983), and intestinal levels are likely to be higher than plasma levels. Although, the contribution of CYP2J2 relative to that of CYP3A4 and CYP2C8 in HIM and HLM is minor, it may become more important in amiodarone metabolism if these two P450s are inhibited.
In the systems evaluated, HLM, recombinant CYP3A4, and recombinant CYP2J2, the metabolism of albendazole exhibits either substrate or product inhibition kinetics. The rate of albendazole S-oxidation decreased when substrate concentrations exceeded 10 μM in HLM and recombinant CYP2J2. For recombinant CYP3A4, the metabolism decreased when concentrations exceeded 20 μM; however, the decrease in velocity was not as pronounced as that observed in HLM and recombinant CYP2J2. Inhibition of enzyme activity at high concentration is one of the most common deviations from typical Michaelis-Menten kinetics (Lin et al., 2001). In the analysis of albendazole S-oxidation kinetic data, a two-site inhibition model containing sites for metabolism and inhibition (Lin et al., 2001) best modeled the kinetic data. In all systems, the Ks was similar, but the inhibition constant, Ki, was found to be 3 to 10 times greater than the Ks, indicating that the inhibitory site has a weaker affinity for the substrate than the catalytic site. The decrease in albendazole S-oxidation occurs around the Ki value as shown in Fig. 5, A to C. Previous evaluation of albendazole in HLM did not show substrate inhibition largely because the substrate concentrations used did not exceed the Ki concentration (Rawden et al., 2000). However, it should be noted that the binding of the metabolite to a second site, which may act as a noncompetitive inhibitor, cannot be ruled out because the albendazole S-oxidation profile will look similar to a substrate inhibition profile.
In drug discovery research, the susceptibility of a compound to metabolism is commonly evaluated using human liver microsomes. Low turnover compounds from HLM evaluations then progress to in vitro and in vivo evaluation in rodents, mainly to gain insight into the absorption, distribution, metabolism, and excretion properties of the new drug candidate or insight for a chemical series. Despite low metabolism observed with human and animal liver microsomes, the compound dosed in vivo may have a systemic clearance value greater than hepatic blood flow, indicating extrahepatic metabolism and/or involvement of a nonhepatic route of clearance. With the knowledge that CYP2J2 metabolizes structurally diverse substrates, this isoform may contribute to total systemic clearance previously unaccounted for, particularly in the intestine and heart. Hashizume et al. (2002) showed that although CYP3A4 may be responsible for hepatic metabolism of ebastine, intestinal metabolism and first-pass metabolism seem to be CYP2J2-mediated. Moreover, CYP2J2 has been identified as the major contributor to the first-pass metabolism of astemizole (Hashizume et al., 2002; Matsumoto et al., 2002). It is possible that for many of the drugs metabolized by both CYP2J2 and CYP3A4, when CYP3A4 is implicated in both intestinal and hepatic metabolism, the contribution of CYP2J2 in the intestine may have been overlooked and the contribution by heart is unclear at this time. In addition, the clinical significance of CYP2J2 in the liver is minor given the abundance of CYP3A4, whereas the CYP2J2 is more abundant in nonhepatic tissues such as heart and intestine, warranting further assessment to determine its clinical significance.
In summary, eight new structurally diverse substrates for CYP2J2 metabolism were discovered among the 139 substrates evaluated. The substrates belong to different therapeutic classes and vary in shape from relatively small rigid structures such as amiodarone to larger more complex structures such as cyclosporine. There is a strong overlap in substrate recognition by CYP2J2 and CYP3A4, and the active site of CYP2J2, although similar in size to that of CYP3A4, is more restrictive in that many of the substrates are metabolized at a single site. Among the newly identified substrates, albendazole forms unique CYP2J2-mediated metabolites. Although our findings demonstrate the ability of CYP2J2 to metabolize structurally diverse compounds, the clinical significance is probably overshadowed by that of CYP3A4, suggesting a minor role in overall intestine and liver metabolism.
Acknowledgments.
We thank Drs. Ruth Hyland, Alfin Vaz, and R. Scott Obach for their thoughtful review and suggestions for our work.
Footnotes
-
Salary support for J.P.J. was provided by the University of Washington, School of Pharmacy Drug Metabolism, Transporter and Pharmacogenomics Research Program funded by gifts from Abbott, Allergan, Amgen, Bend Research, Bristol-Myers Squibb, Eli Lilly, Hoffman-La Roche, Johnson & Johnson, Merck, and Pfizer.
-
Article, publication date, and citation information can be found at http://dmd.aspetjournals.org.
doi:10.1124/dmd.109.030270.
-
- P450
- cytochrome P450
- ClINT
- Michaelis-Menten-derived intrinsic clearance
- DMSO
- dimethyl sulfoxide
- LC
- liquid chromatography
- MS/MS
- tandem mass spectrometry
- HPLC
- high-performance liquid chromatography
- HLM
- human liver microsomes
- HIM
- human intestinal microsomes
- Clint
- intrinsic clearance
- AIC
- Akaike information criterion
- amu
- atomic mass unit
- r
- recombinant.
- Received September 17, 2009.
- Accepted November 17, 2009.
- Copyright © 2010 by The American Society for Pharmacology and Experimental Therapeutics


