


Abstract
Muraglitazar and peliglitazar, two structural analogs differing by a methyl group, are dual peroxisome proliferator-activated receptor-α/γ activators. Both compounds were extensively metabolized in humans through acyl glucuronidation to form 1-O-β-acyl glucuronide (AG) metabolites as the major drug-related components in bile, representing at least 15 to 16% of the dose after oral administration. Peliglitazar AG was the major circulating metabolite, whereas muraglitazar AG was a very minor circulating metabolite in humans. Peliglitazar AG circulated at lower concentrations in animal species than in humans. Both compounds had a similar glucuronidation rate in UDP-glucuronic acid-fortified human liver microsomal incubations and a similar metabolism rate in human hepatocytes. Muraglitazar AG and peliglitazar AG were chemically synthesized and found to be similarly oxidized through hydroxylation and O-demethylation in NADPH-fortified human liver microsomal incubations. Peliglitazar AG had a greater stability than muraglitazar AG in incubations in buffer, rat, or human plasma (pH 7.4). Incubations of muraglitazar AG or peliglitazar AG in plasma produced more aglycon than acyl migration products compared with incubations in the buffer. These data suggested that the difference in plasma stability, not differences in intrinsic formation, direct excretion, or further oxidation of muraglitazar AG or peliglitazar AG, contributed to the observed difference in the circulation of these AG metabolites in humans. The study demonstrated the difficulty in doing risk assessment based on metabolite exposure in plasma because the more reactive muraglitazar AG would not have triggered a threshold of concern based on the recent U.S. Food and Drug Administration guidance on Metabolites in Safety Testing, whereas the more stable peliglitazar AG would have.
Introduction
Acyl glucuronidation is one of the major metabolic clearance pathways for many carboxylic acid-containing drugs. 1-O-β-Acyl glucuronides, which are formed by UDP-glucuronosyltransferase (UGT) enzymes as the original isomer, can undergo a number of reactions including hydrolysis, rearrangement via acyl migration (Stachulski et al., 2006; Zhang et al., 2006; Xue et al., 2008), further metabolism (Kumar et al., 2002; Kochansky et al., 2005; Ogilvie et al., 2006), and reaction with nucleophiles (Sallustio and Foster, 1995; Akira et al., 2002; Bailey and Dickinson, 2003). The chemical reactivity of acyl glucuronides proceeds via two distinct pathways (Bailey and Dickinson, 2003; Stachulski et al., 2006; Corcoran et al., 2001): 1) direct displacement of the acyl residue with a nucleophile to produce an aglycon (hydrolysis product) and an acylated nucleophile; and 2) alternatively, migration of the acyl group around the sugar ring to yield 2-, 3-, and 4-acyl isomers. These isomers may undergo transient ring opening with concurrent formation of a reactive aldehyde group. Either of these pathways could lead to covalent binding to cellular proteins (Sallustio and Foster, 1995; Akira et al., 2002; Bailey and Dickinson, 2003). These pathways are effectively catalyzed at physiological pH (pH 7.4) and occur more rapidly under basic pH conditions (Xue et al., 2008). Acyl glucuronides are relatively stable under acidic conditions (pH 4–5). Careful acidification and cooling are required to stabilize acyl glucuronides in biofluids such as plasma, urine, and bile (Wang et al., 2006).
Muraglitazar and peliglitazar, oxybenzylglycine analogs (nonthiazolidinedione), are novel dual peroxisome proliferator-activated receptor-α/γ activators. The two compounds are structurally very similar with the difference being the addition of a methyl group (Fig. 1). After oral administration to humans, both [14C]muraglitazar and [14C]peliglitazar underwent extensive conjugation, and the major portion of each radioactive dose was excreted in bile as acyl glucuronide metabolites in humans (Wang et al., 2006, 2010; Zhang et al., 2007b). The acyl glucuronide metabolites of muraglitazar and peliglitazar seemed to be stable in ex vivo plasma, urine, and bile under acidic and low temperature conditions because no significant amounts of acyl migration isomers were formed in plasma, urine, and bile of animals and humans that were acidified and stored at low temperature. In addition, the parent concentrations were not increased over time (Wang et al., 2006, 2010). The major circulating drug-related component (>90%) after oral administration in humans was muraglitazar; however, both peliglitazar and peliglitazar AG were major drug-related components (approximately equal concentrations) in humans after oral administration of peliglitazar. There was no protein covalently bound radioactivity found in the protein pellet after extraction with organic solvents from plasma samples of humans with oral administration of either 14C-labeled compound.

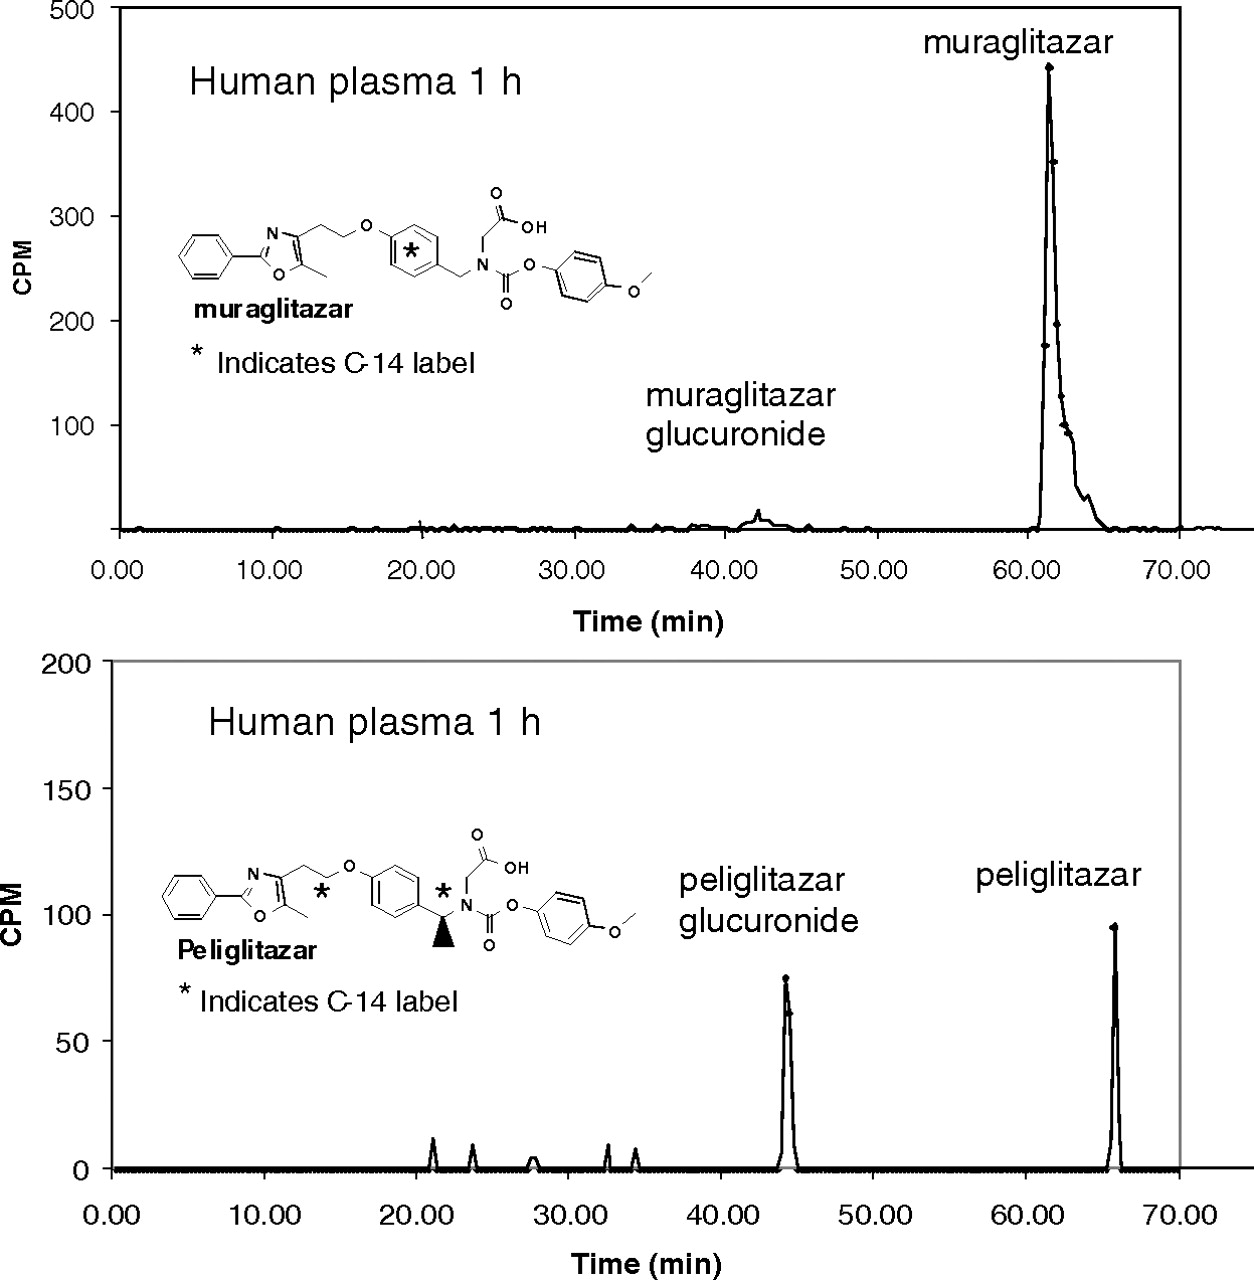
Metabolite profiles in 1 h human plasma samples after single oral administration of 14C-labeled muraglitazar or peliglitazar. The samples were analyzed by HPLC system II as described under Materials and Methods.
The circulation of a metabolite, in general, would mainly depend on its formation, further metabolism, and direct clearance into urine and bile. For reactive metabolites such as acyl glucuronides, there could also be reactions to form various small metabolites or large molecular adducts. In this study we investigated the mechanism responsible for the distributional difference between muraglitazar and peliglitazar, two structurally similar analogs, by studying formation, stability, excretion, and further metabolism of their glucuronide metabolites.
Materials and Methods
Materials.
Muraglitazar, peliglitazar, and their 14C-labeled materials were synthesized at Bristol-Myers Squibb (Princeton, NJ). Their structures are shown in Fig. 1. The 14C-labeled materials had a radiochemical purity of >99%. Acetonitrile and trifluoroacetic acid were purchased from EM Scientific (Gibbstown, NJ). Pooled human liver microsomes (n = 22) were purchased from BD Biosciences (San Jose, CA). The human hepatocytes were acquired as freshly prepared cell suspensions from Lonza (Walkersville, MD). All other chemicals used were of reagent grade or better.
Synthesis of Peliglitazar AG and Muraglitazar AG.
Muraglitazar AG and peliglitazar AG were synthesized basically following the procedure described previously (Kenny et al., 2004; Perrie et al., 2005).
Allyl glucuronate.
To a solution of d-glucuronic acid (5.0 g, 25.7 mmol) in dimethyl formamide (50 ml) at 20°C was added 1,8-diazabicyclo[5.4.0]undec-7-ene (4.3 ml, 28.2 mmol). The mixture was stirred for 15 min, after which allyl bromide (2.8 ml, 30.8 mmol) was added. The reaction was stirred overnight, after which volatile compounds were removed in vacuo at 60°C. The crude residue was then purified by flash chromatography twice on a 120-g silica gel column with a continuous gradient from 0 to 20% methanol (MeOH) in CH2Cl2. The isolated material was then dissolved in MeOH (5 ml) and concentrated in vacuo. CH2Cl2 (40 ml) was added, and the solution was cooled to 0°C for 0.5 h. The precipitated solid was filtered off and washed with ice-cold CH2Cl2 and then dried in vacuo to give the allyl glucuronate (3.4 g, 57% yield, α/β-anomer ratio at 2:1).
Peliglitazar β-anomer allyl ester.
To a −5°C solution of peliglitazar (5.5 g, 10.4 mmol) and PPh3 (2.72 g, 10.4 mmol) in tetrahydrofuran (THF) (40 ml) and dimethyl formamide (5 ml) was added diisopropyl azodicarboxylate (2.0 ml, 10.4 mmol). After 10 min, a solution of the allyl glucuronate (1.44 g, 6.15 mmol) in THF (10 ml) and dimethyl formamide (2.5 ml) was added slowly over 10 min using a syringe pump. After the addition was complete, the reaction solution had turned dark brown. The reaction was stirred at −5°C for 2 h, and the reaction was monitored by thin-layer chromatography until completion. The formation of product(s) was monitored by HPLC-MS analysis on a Luna C18 50 × 4.6 mm column with a 0 to 100% B linear gradient in 4 min with solvent A (10% MeOH in 10 mM ammonium acetate solution) and solvent B (90% MeOH in 10 mM ammonium acetate solution at a flow rate of 4 ml/min). Volatile compounds were removed in vacuo, and the crude residue was purified by flash chromatography twice on a 120-g silica gel column with a continuous gradient of 0 to 10% ethanol in CH2Cl2. The resulting material contained the desired α- and β-anomers as major products. The α- and β-anomers with a 2 to 3:1 ratio had been partially separated by the flash chromatography procedure described above, and the mixture was further purified by preparative HPLC. The preparative HPLC conditions used a Synergi Hydro-RP 80A column (250 × 21 mm 4 μm; Phenomenex, Torrance, CA) at room temperature with a flow rate of 25 ml/min and a mobile phase of 0.05% acetic acid (pH 3.3)-acetonitrile (50:50, v/v) of a run time of 48 min at 278 nm. A portion of 35 mg was injected on the column each time. After careful removal of acetonitrile in vacuo at room temperature, the remaining aqueous solution was extracted with ethyl acetate (300 ml), and the organic phase was concentrated and dried in vacuo to provide the α- and β-anomer esters as white powders. The β-anomer was recovered in a 10% yield.
Peliglitazar AG.
To a 0°C solution of the β-anomer allyl ester (370 mg, 0.44 mmol) in THF (2.0 ml) was added (PPh3)4Pd (59.2 mg, 0.051 mmol) followed by pyrrolidine (35.2 μl, 0.44 mmol). The mixture was stirred at 0°C for 30 min, after which volatile compounds were immediately removed in vacuo to give the crude carboxylic acid. LC-MS using the previously described Luna C18 column method indicated the formation of desired product. The crude product was purified by previously described preparative HPLC on a Synergi Hydro-RP column. After removal of acetonitrile, the remaining solution was lyophilized to give the desired acyl glucuronide β-anomer as a white powder (98% pure by HPLC, 300 mg, at 75% yield). 1H NMR (500 MHz, DMSO-d6) δ ppm: 1.50 (d, J = 7.15 Hz, 3H), 1.57 (d, J = 6.60 Hz, 2H), 2.36 (s, 3H) 2.93 (t, J = 6.60 Hz, 2H), 3.07–3.12 (m, 1H), 3.15 (s, 1H), 3.23 (s, 1H), 3.35 (d, J = 9.90 Hz, 1H), 3.38 (d, J = 9.90 Hz, 1H), 3.73 (s, 3H), 3.84 (d, J = 18.70 Hz, 1H), 3.90 (d, J = 18.15 Hz, 1H), 4.07 (d, J = 18.50 Hz, 1H), 4.11 (d, J = 18.15 Hz, 1H), 4.22 (t, J = 6.60 Hz, 2H), 5.30 (q, J = 7.70 Hz, 1H), 5.35 (q, J = 7.70 Hz, 1H), 5.39 (d, J = 8.25 Hz, 1H), 6.89 (d, J = 8.80 Hz, 2H), 6.94 (d, J = 8.80 Hz, 2H), 6.98 (d, J = 8.80 Hz, 1H), 7.29 (d, J = 8.25 Hz, 2H), 7.34 (d, J = 8.25 Hz, 2H), 7.49 (t, J = 7.88 Hz, 2H), 7.49 (s, 1H), 7.92 (dd, J = 7.70, 1.10 Hz, 2H). The anomeric proton of the β-anomer was at δ5.39, with J = 8.25 Hz, which is typical for the β configuration. The following resonance signals corresponded to the minor rotational conformer: δ1.57 (proton 18); δ3.90 (15); δ5.30 (17); δ5.35 (2); δ6.98 (24, 26); δ7.34 (23, 27). 13C NMR (126 MHz, DMSO-d6) δ ppm: 10.44 (s, 1C), 17.42 (s, 1C), 26.16 (s, 1C), 39.61 (s, 1C), 45.31 (s, 1C), 54.11 (s, 1C), 55.90 (s, 1C), 66.74 (s, 1C), 72.47 (s, 1C), 73.03 (s, 1C), 75.08 (s, 1C), 77.00 (s, 1C), 95.58 (s, 1C), 114.69 (s, 2C), 115.02 (s, 2C), 123.00 (s, 1C), 123.55 (s, 2C), 126.00 (s, 2C), 127.69 (s, 1C), 128.91 (s, 1C), 129.62 (s, 2C), 130.61 (s, 3C), 133.11 (s, 1C), 133.26 (s, 1C), 145.01 (s, 1C), 145.67 (s, 1C), 154.69 (s, 1C), 157.04 (s, 1C), 158.21 (s, 1C), 158.94 (s, 1C).
1-O-Acyl-α-glucuronide of peliglitazar.
The isolated acyl glucuronide α-anomer allyl ester obtained by preparative HPLC was deprotected by a procedure identical to that described for the synthesis of the β-anomer acid as a white powder (98% purity by HPLC) after lyophilization. 1H NMR (500 MHz, DMSO-d6) δ ppm: 1.47 (d, J = 6.60 Hz, 3H), 1.55 (d, J = 6.60 Hz, 3H), 2.37 (s, 3H), 2.94 (t, J = 6.32 Hz, 2H), 3.15 (d, J = 8.80 Hz, 1H), 3.73 (s, 3H), 4.22 (t, J = 6.32 Hz, 2H), 4.94 (d, J = 3.85 Hz, 1H), 5.06 (d, J = 6.60 Hz, 1H), 5.34 (d, J = 7.15 Hz, 2H), 5.39 (d, J = 6.60 Hz, 2H), 5.97 (d, J = 2.61 Hz, 1H), 6.02 (d, J = 3.30 Hz, 1H), 6.89 (d, J = 6.86 Hz, 2H), 6.91 (d, J = 6.89 Hz, 2H), 6.95 (d, J = 8.25 Hz, 2H), 7.02 (d, J = 8.80 Hz, 2H), 7.28 (d, J = 8.25 Hz, 2H), 7.33 (d, J = 8.80 Hz, 2H), 7.49 (s, 1H), 7.50 (t, J = 7.15 Hz, 2H), 7.92 (d, J = 7.70 Hz, 2H). Some of the signals corresponded to the minor rotational conformer, including the δ1.55 doublet (for proton 18) and δ5.97 doublet (for the anomeric proton 2). Because the amount of material was limited for carbon-proton NMR heterocorrelations, the chemical shift (at 6 ppm) and coupling (<4 Hz) of the anomeric proton were used to determine the molecule to be in an α conformation.
Muraglitazar AG.
This compound was synthesized with procedures similar to those for peliglitazar AG at an overall 3.3% yield and the purity of 98%. 1H NMR (500 MHz, DMSO-d6) δ ppm: 2.36 (s, 3H), 2.93 (t, J = 6.60 Hz, 2H), 3.07–3.16 (m, 2H), 3.20–3.27 (m, 1H), 3.35 (t, J = 9.62 Hz, 1H), 3.73 (s, 3H), 4.09–4.25 (m, 4H), 4.45 (dd, 2H), 4.58 (dd, 1H), 5.38 (d, J = 8.25 Hz, 0H), 5.42 (d, J = 7.70 Hz, 1H), 6.94 (dd, 4H), 7.01 (d, J = 8.80 Hz, 1H), 7.08 (d, J = 8.80 Hz, 1H), 7.26 (d, J = 8.25 Hz, 1H), 7.31 (d, J = 8.25 Hz, 1H), 7.43–7.55 (m, 3H), 7.91 (d, J = 7.15 Hz, 2H). The anomeric proton of the β-anomer was at 5.38 ppm (J = 8.25 Hz) for the minor rotational conformer and at 5.42 ppm (J = 7.70 Hz) for the major conformer. The downfield chemical shift and large coupling observed are typical for the β configuration. The following resonance signals corresponded to the minor rotational conformer: 4.58 ppm (dd, 1 H), 5.38 (J = 8.25 Hz), 7.31 (d, J = 8.25 Hz, 2H), 7.01 (d, J = 8.80 Hz, 1H). 13C NMR (126 MHz, DMSO-d6) δ ppm: 10.95 (s, 1C), 26.69 (s, 2C), 49.50 (s, 1C), 51.88 (br s, 1C), 56.47 (s, 1C), 67.29 (s, 1C), 72.98 (s, 1C), 73.52 (br s, 1C), 75.69 (s, 1C), 77.36 (s, 1C), 96.15 (br s, 1C), 115.10–115.47 (m, 2C), 115.65 (br s, 2C), 123.30–124.14 (m, 2C), 126.53 (s, 2C), 128.22 (s, 1C), 130.03 (s, 1C), 130.14 (s, 1C), 130.39 (s, 1C), 131.14 (s, 2C), 133.78 (s, 1C), 145.51 (s, 1C), 146.20 (s, 1C), 155.71 (s, 1C), 157.65 (br s, 1C), 158.86 (s, 1C), 159.47 (s, 1C), 169.30 (s), 169.62 (s, 1C), 172.61 (br s, 1C). The carbonyl signal at 169.30 corresponded to the minor rotational conformer.
Liver Microsomal and Hepatocyte Incubations.
Incubations (250 μl) contained muraglitazar or peliglitazar (10 μM, 2.5 mM stock solution in 50:50, v/v, acetonitrile-Tris buffer), human liver microsomes (1 mg/ml protein), UDPGA (2 mM), magnesium chloride (10 mM), and Tris buffer (100 mM, pH 7.4). Incubations were initiated by addition of a substrate at 37°C and quenched after 15 min by addition of 1 volume of acetonitrile to the incubation mixture. After centrifugation to remove the precipitated microsomal proteins, the clear supernatant (100 μl) was analyzed by LC-MS. HPLC system I consisted of a Waters 600 pump, a 717 autosampler, and a 996 photodiode array detector. The column used was a C18 YMC ODS-AQ reverse-phase column (4.6 × 150 mm, 3 μm) maintained at room temperature with a flow rate of 0.7 ml/min. The mobile phase A consisted of 5% acetonitrile in water containing 0.1% TFA and the mobile phase B consisted of 95% acetonitrile containing 0.1% TFA. A linear gradient was 10 to 100% B in 20 min and then held at 100% B for 10 min. The retention times were 12.1, 7.3, 15.4, and 8.6 min for muraglitazar, muraglitazar AG, peliglitazar, and peliglitazar AG, respectively. The HPLC was interfaced to a LCQ mass spectrometer (Thermo Fisher Scientific, Waltham, MA) operated in the positive ionization mode to acquire full-scan LC-MS data with a mass scan range of 200 to 1000 Da. The percent metabolism was calculated on the basis of the ratio of peak areas of the metabolite versus metabolite plus the parent (metabolite/metabolite + parent) from the UV chromatogram (at 278 nm).
Hepatocyte incubations were performed with cells in suspension in 24-well tissue culture plates shaken at 90 rpm on an orbital shaker. The incubations were in Krebs-Henseleit buffer in a 5% CO2/95% air atmosphere at 37°C with muraglitazar or peliglitazar (5 μM, 0.5 mM stock in 50:50 acetonitrile-potassium phosphate, v/v) and 1 × 10⁶ hepatocytes/ml. Incubation time was 1 h. The samples were quenched by addition of an equal volume of acetonitrile. The quenched samples were treated and analyzed by LC-MS with HPLC system I as described for the microsomal incubations.
Muraglitazar AG or peliglitazar AG at 20 μM was separately incubated for 15 min with human liver microsomes (2 mg/ml protein) in 1 ml of 50 mM sodium phosphate buffer with and without 1 mM NADPH. The samples were separated by HPLC system II using a Shimadzu LC-10AT system with the analytical column used for the microsomal incubation samples. The mobile phase consisted of two solvents: solvent A (0.06% TFA in water) and solvent B (0.06% TFA in acetonitrile). The gradient consisted of the following steps: solvent B started at 5%, then increased linearly to 25% at 5 min, to 40% at 20 min, to 53% at 60 min, to 60% at 63 min, and to 90% at 65 min, held at 90% for 7 min, and then decreased to 5% at 75 min. The HPLC effluent was 1 ml/min. The quantities of muraglitazar and peliglitazar AGs were estimated by HPLC separation with UV detection at 278 nm. The metabolites were identified by LC-MS as described in the supplemental data.
Study Subjects, Dosing, and Sample Collection.
All animal housing and care conformed to the standards recommended by the Guide for the Care and Use of Laboratory Animals (Institute of Laboratory Animal Resources, 1996). Animal rooms were maintained on a 12-h light/dark cycle. The human study was performed in accordance with the principles of the Declaration of Helsinki and its amendments, and the study protocol was approved by the Institutional Review Board and Radiation Safety Committee at the investigational site. All subjects were in good health and gave written, informed consent to participate in the study.
Male CD-1 mice (n = 5, 25–35 g), male Sprague-Dawley rats (n = 3, 250–280 g), and male cynomolgus monkeys (n = 3, 3–5 kg) were fasted for approximately 8 h before dosing. Each animal received an oral gavage dose of 30 mg/kg (300 μCi/kg, 5 ml/kg) for mouse, 15 mg/kg (150 μCi/kg, 5 ml/kg) for rat, and 3 mg/kg (30 μCi/kg, 1 ml/kg) for monkey of [14C]peliglitazar dissolved in PEG-400. Human studies were conducted as described previously (Wang et al., 2006). Four healthy male subjects, aged 18 to 45 years, each received a single dose of [14C]muraglitazar (20 mg) or [14C]peliglitazar (10 mg) containing approximately 100 μCi of radioactivity as an oral solution in PEG-400 after at least an 8-h overnight fast.
Blood samples (terminal for mouse and rat and via the cephalic vein for monkey and direct venipuncture using Vacutainers for human) were collected at 1, 4, 12, and 24 h using K2EDTA as the anticoagulant. Plasma was prepared by centrifugation at approximately 1000g for 15 min at 4°C. Acetic acid was added to plasma to a final concentration of 5% (v/v, 0.83 M) immediately after processing. All plasma samples were frozen and stored at −20°C.
Sample preparation and analysis.
Pooled plasma samples were prepared separately by mixing an equal volume (0.2–0.5 ml) of plasma sample from each subject. Portions (0.5–1 ml) of the pooled plasma samples were extracted by addition of a mixture of 1 volume of methanol and 3 volumes of acetonitrile and mixed on a Vortex mixer. The mixtures were centrifuged at 2000g at 10°C for 30 min, and then the supernatants were transferred into a polypropylene centrifuge tube. The extraction was repeated two more times, and all supernatants were combined. The recovery of radioactivity in the supernatant after extraction was quantitative. The plasma protein pellets were digested in 1 M NaOH for 12 h before being neutralized with 1 M HCl and counted for radioactivity in 15 ml of Ecolite scintillation fluid. The combined supernatants were concentrated under a stream of nitrogen, the residues were then reconstituted in 0.2 to 0.5 ml of a solution of 70% of HPLC mobile phase A (0.06% TFA in water) and 30% mobile phase B (0.06% TFA in acetonitrile), vortexed, and centrifuged at 2000g for 10 min, and 100 μl of the supernatant was used for the HPLC analysis. Metabolites in plasma were analyzed by HPLC system II using a Shimadzu LC-10AT system as described in the preceding section. HPLC effluent (1 ml/min) was collected in a Deepwell LumaPlate-96 (PerkinElmer Life and Analytical Sciences, Waltham, MA) at 0.26 min. The plates were dried with a SpeedVac (Thermo Fisher Scientific) and counted for 10 min/well with a TopCount analyzer (PerkinElmer Life and Analytical Sciences) to quantify radioactivity. Biotransformation profiles were prepared by plotting the resulting net counts per minute values versus time after injection. Radiochromatograms were reconstructed from the TopCount data using Microsoft Excel software.
Stability studies in incubations in buffer and plasma.
A portion of 0.75 ml of 1 M phosphate buffer at pH 7.4 and 14.1 ml of human or rat plasma were mixed, and 0.15 ml of 5 mg/ml 1-O-β-acyl glucuronide stock solution in acetonitrile and water (50:50, v/v) was spiked to that solution to give a final concentration of 50 μg/ml 1-O-β-acyl glucuronide. Each spiked plasma solution was aliquoted into a 0.5-ml portion of 27 tubes. Twenty-four of them were placed in the water bath at 37°C, and three of them were quenched with 3 volumes of 1.35% acetic acid in acetonitrile/methanol (1:1, v/v). The remaining samples were quenched at 0.25, 0.5, 1, 2, 4, 6, 24, and 48 h (three tubes per time point) after the same quenching procedure. The samples were mixed well and immediately frozen at −80°C until analysis. The entire experiment was done on ice-water bath. Before analysis, samples were taken out and thawed in an ice-water bath. Likewise, for incubations in phosphate buffer, 0.75 ml of 1 M phosphate buffer at pH 7.4 and 14.1 ml of water were mixed with 0.15 ml of 5 mg/ml 1-O-β-acyl glucuronide stock solution. The remaining steps were the same as those for the incubations for buffered plasma.
1-O-β-Acyl glucuronides and their isomers as well as aglycons were separated isocratically by HPLC system III using a mobile phase composed of 65:35 (v/v) acetonitrile-water containing 0.05% formic acid at a flow rate of 0.3 ml/min. The separation was performed using a Luna C18(2) analytical column (3 × 150 mm, 3 μm; Phenomenex, Torrance, CA) operated at 25°C. The injection volume was 5 μl, and the run time was 12.0 min. Under these conditions, the retention time was 6.17, 7.04, 7.55, 8.13, 8.35, 8.82, and 15.08 min, respectively, for isomer 1, isomer 2, muraglitazar AG, isomer 3, isomer 4, isomer 5, and muraglitazar. The retention time was 7.51, 8.62, 9.55, 10.25, 11.05, and 14.80 min, respectively, for isomer 1, isomer 2, peliglitazar AG, isomer 3, isomer 4, and peliglitazar. The HPLC effluent was monitored at 278 nm and analyzed by a LTQ mass spectrometer (Thermo Fisher Scientific).
Results
Table 1 and Fig. 2 show the exposures of peliglitazar and peliglitazar AG in the plasma of mouse, rat, monkey, and human. The exposure multiples of the maximum concentration (Cmax) and AUC values for the parent compound in mouse, rat, and monkey were >21. The exposure multiples of Cmax and AUC values for the major glucuronide metabolite, peliglitazar AG, were 3.8 to 6.4 in the mouse, 1 to 2 in monkey, and <0.5 in rat from the ADME studies. The projected exposure multiples of Cmax and AUC values for the metabolite were higher (all were >1) in mouse, rat, and even monkey with linearly scaled doses for the term toxicological studies. However, the exposure multiples of Cmax and AUC values for the metabolite were still <1 with the projected carcinogenicity testing doses. Overall, peliglitazar AG exposure multiples of Cmax and AUC in toxicological species were marginal even at the projected high toxicological doses.
Estimated exposures of peliglitazar and its acyl glucuronide in mice, rats, monkeys, and humans after a single oral dose of peliglitazar

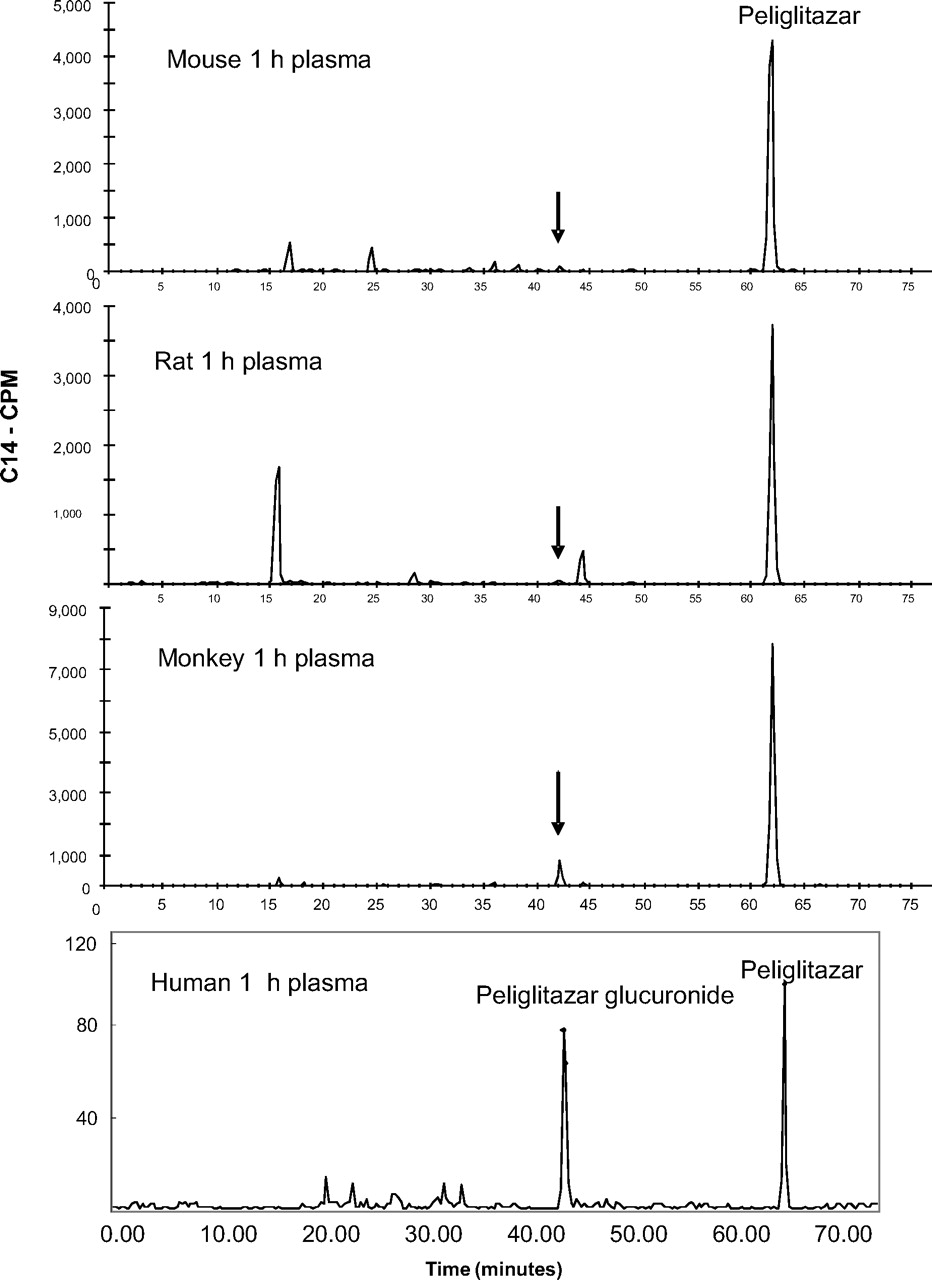
Radioactivity profiles in 1 h plasma of mice (30 mg/kg), rats (15 mg/kg), monkeys (3 mg/kg), and humans (10 mg/subject) following single oral doses of [14C]peliglitazar. Arrows point to the position of peliglitazar AG elution.
Figure 1 shows that peliglitazar AG circulated in humans as a major metabolite, whereas muraglitazar AG had little circulation in humans in the 1-h plasma samples. Radioactivity profiles of human plasma at 4, 12, and 24 h also showed that peliglitazar AG but not muraglitazar AG was a significant circulating metabolite in humans. There were minimal to no acyl isomers detected in the plasma samples from subjects after administration of [14C]peliglitazar or [14C]muraglitazar. In addition, the plasma protein pellets after extraction with the organic solvent contained no detectable levels of radioactivity. Together, the low levels of isomerization and protein covalent binding suggest ex vivo stabilization of the plasma samples by addition of acetic acid and low levels of total plasma radioactivity. Overall, muraglitazar AG represented approximately 4% of the muraglitazar AUC0–24 h, whereas peliglitazar AG represented 240% of the peliglitazar AUC0–24 h. With concentrations of peliglitazar AG of 102, 48.8, and 21.3 ng/ml at 1, 4, and 12 h postdose, the estimated half-life of the peliglitazar AG was approximately 3 h based on the limited data points (Wang et al., 2010). Estimation of half-life for muraglitazar AG was not possible. Although both muraglitazar and peliglitazar underwent extensive conjugation metabolism to form AGs as the major metabolite, only peliglitazar AG was the major circulating component after oral administration of the 14C-labeled drug. A similar distributional difference was observed in monkeys as well as in rats after oral administration of 14C-labeled muraglitazar or peliglitazar (data not shown).
Table 2 shows the glucuronidation rates of muraglitazar and peliglitazar in human liver microsomes and hepatocytes and biliary/urinary excretion of acylglucuronide metabolites in humans after oral administration of 14C-labeled compounds. At clinically relevant concentrations, 5 μM in hepatocytes and 10 μM in human liver microsomes (Zhang et al., 2006; Wang et al., 2010), muraglitazar and peliglitazar showed similar glucuronidation rates in incubations with both UDPGA-fortified human liver microsomes and human hepatocytes. In humans, muraglitazar and peliglitazar AGs showed similar elimination profiles with at least 15 to 16% of dose excreted in the bile over the 3- to 8-h postdose collections and 0.2 to 0.8% of the dose in the urine over 0- to 168-h collections after oral administration of 14C-labeled compounds. These data suggest that muraglitazar AG was formed in the liver and excreted into the urine and bile in a manner similar to that of peliglitazar AG.
Glucuronidation of muraglitazar and peliglitazar in human liver microsomes and hepatocytes and excretion of acyl glucuronide metabolites in humans after oral administration of 14C-labeled compounds
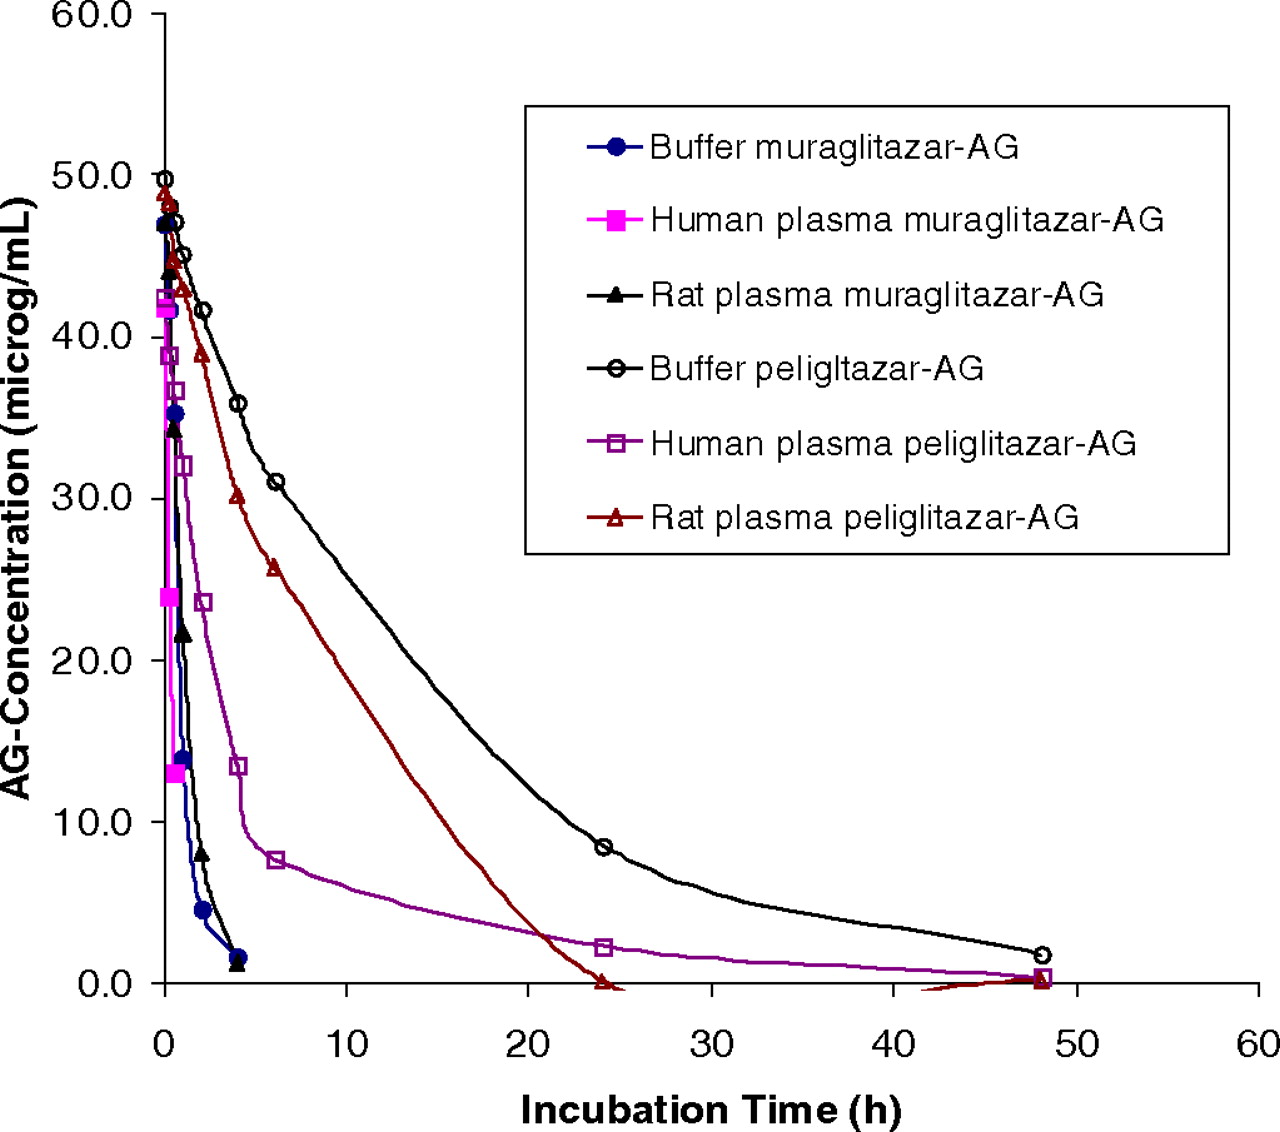
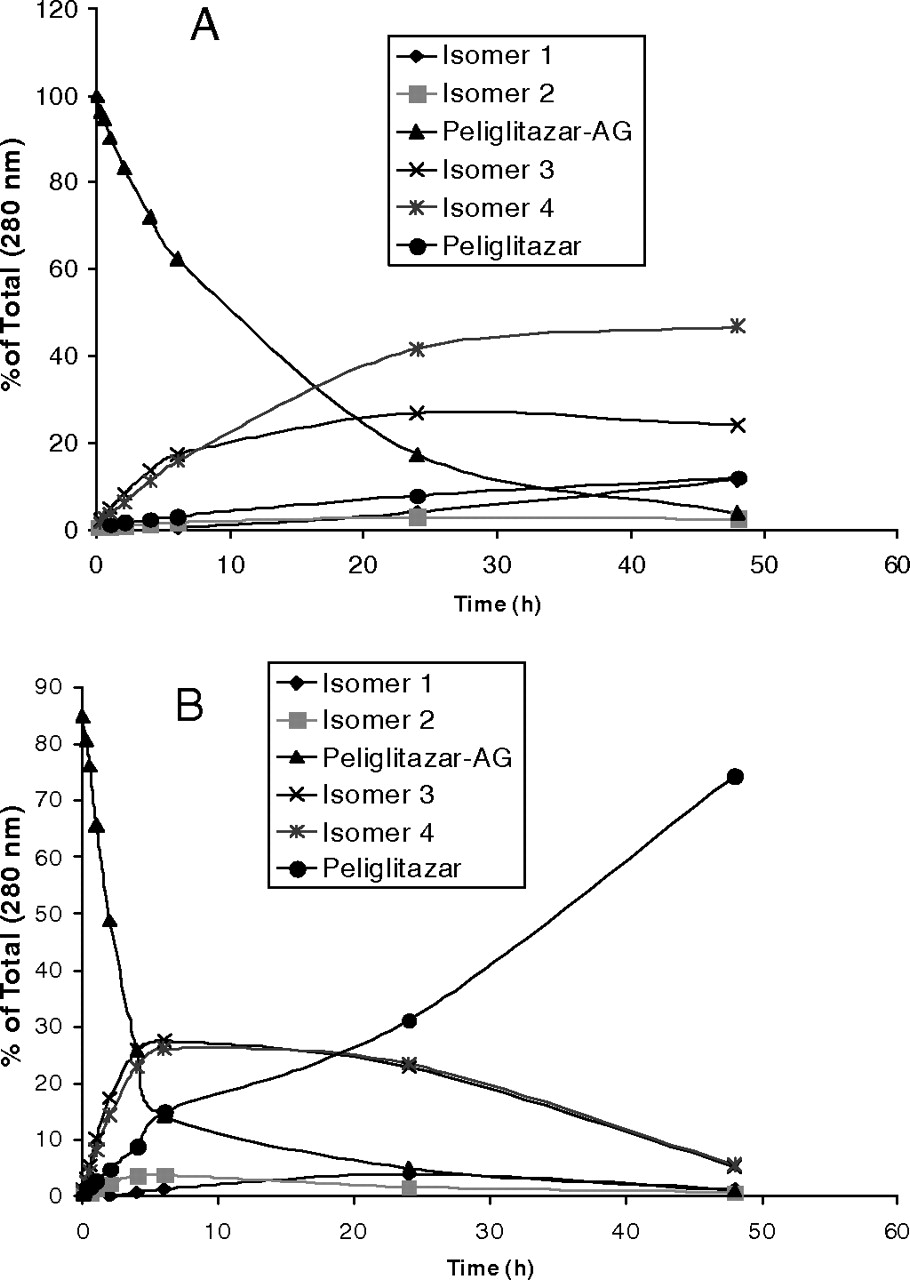
Table 3 shows the stability of muraglitazar AG and peliglitazar AG in incubation in buffer or human plasma. Figure 3 shows distinct concentration-time profiles of muraglitazar AG and peliglitazar AG degradation in the buffer and rat or human plasma samples. Muraglitazar AG degraded in a phosphate buffer or human plasma at approximately 7 to 8 times faster than peliglitazar AG by hydrolysis to aglycons and to a lesser extent by acyl migration to positional isomers. Muraglitazar and peliglitazar AGs degraded approximately 3 to 5 times faster in human plasma than in the buffer (Table 3). Both glucuronides had degradation that was faster in rat plasma than in buffer but was different from that in human plasma (Fig. 3). Good separation of the positional isomers of muraglitazar AG and peliglitazar AG and their degradation products was achieved by simple reverse-phase HPLC using an isocratic elution as described by Xue et al. (2008). The hydrolysis rates for formation of muraglitazar and peliglitazar were 5 to 10 times faster in plasma than in buffer (Figs. 4 and 5). In the incubation with muraglitazar AG in human plasma, the acyl migration isomers 3 and 4 were formed and then quickly hydrolyzed to form the aglycon (Fig. 4B); however, both the isomers and the aglycon were formed slowly in the buffer. In addition, the acyl isomers degraded to aglycon at a slower rate than that in plasma (Fig. 4A). Similar degradation profiles were observed with peliglitazar AG but at a much slower rate than with muraglitazar AG (Fig. 5).
Stability of acyl glucuronides of muraglitazar and peliglitazar in buffer and human plasma incubations at 50 μg/ml and 37°C
The buffer was 50 mM sodium phosphate, pH 7.4. Plasma samples were buffered with 50 mM phosphate, pH 7.4.

Concentration-time degradation profiles of muraglitazar AG and peliglitazar AG at 50 μg/ml in incubations at 37°C in the buffer, rat and human plasma at pH 7.4. The samples were analyzed by HPLC system III as described under Materials and Methods.

Hydrolysis and isomerization profiles of muraglitazar AG (50 μg/ml) in incubations in a buffer or buffered human plasma (pH 7.4) at 37°C. A, buffer; B, human plasma. The samples were analyzed by HPLC system III as described under Materials and Methods.

Hydrolysis and isomerization profiles of peliglitazar AG (50 μg/ml) in incubations in a buffer or buffered human plasma (pH 7.4) at 37°C. A, buffer; B, human plasma. The samples were analyzed by HPLC system III as described under Materials and Methods.
The oxidative metabolism of muraglitazar AG and peliglitazar AG was investigated in human liver microsomes in the presence of NADPH. Multiple hydroxylated metabolites and the O-demethylated metabolite of muraglitazar AG were observed in the incubation starting with muraglitazar and peliglitazar AGs, and metabolite identification is shown in the supplemental data. The glucuronide oxidation rates were estimated to be 22 and 24 pmol/(min · mg), respectively, for muraglitazar AG and peliglitazar AG.
Discussion
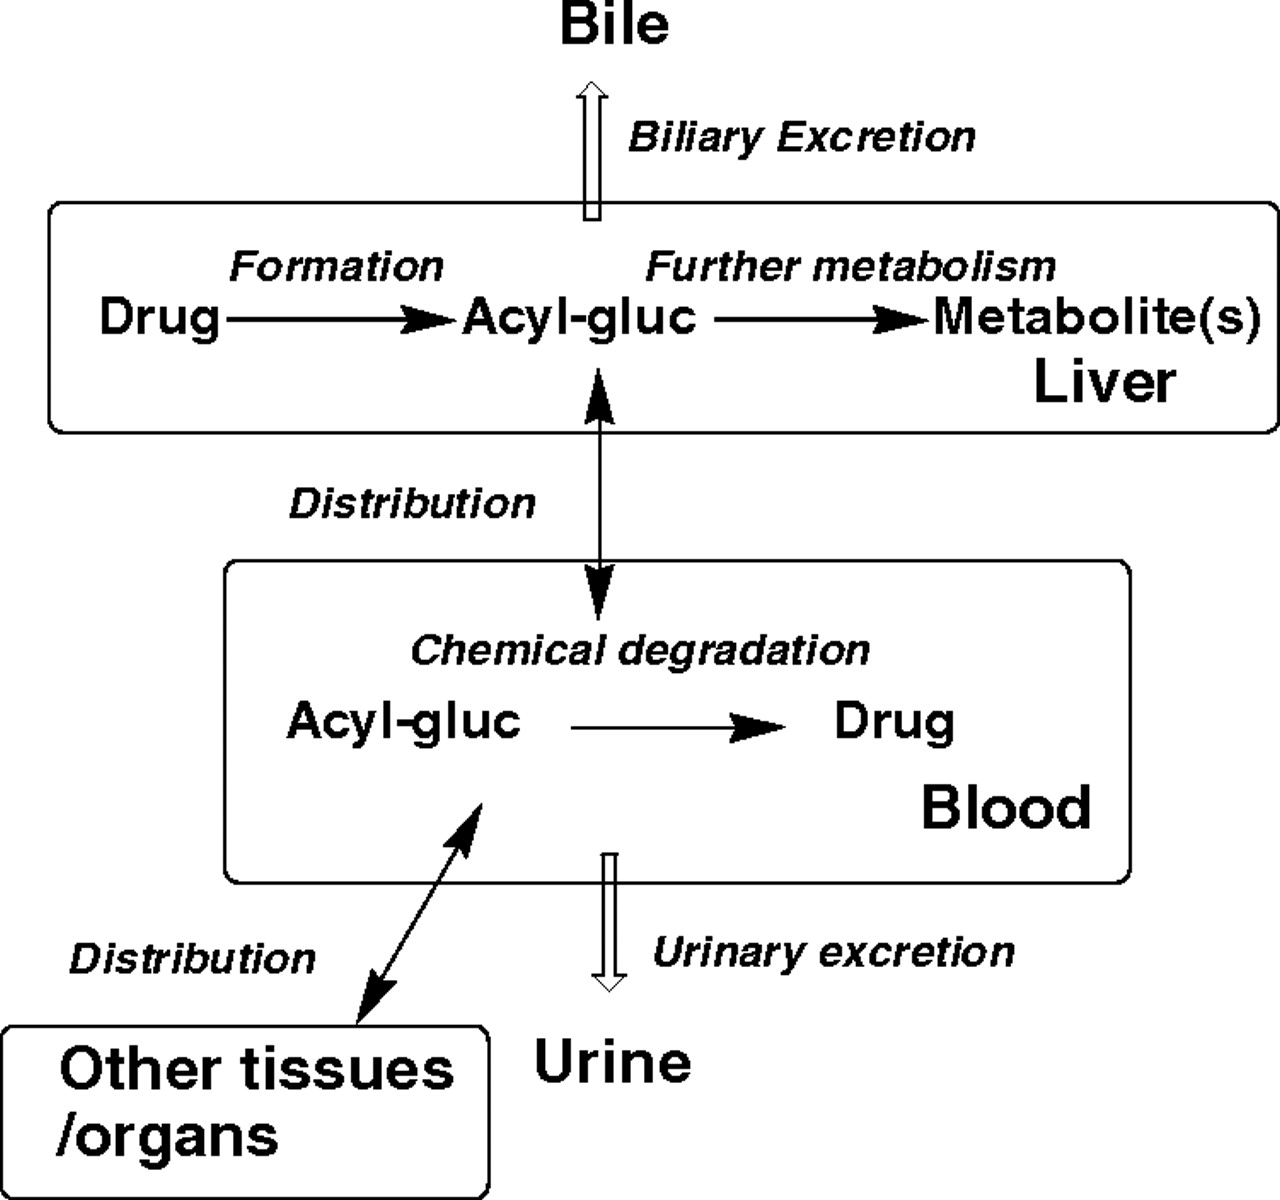
Fig. 6 illustrates the potential factors that would be expected to affect the circulating levels of an acyl glucuronide metabolite include formation rate, biliary and renal excretion, further metabolism, tissue distribution, and reactions with small and large molecules. The disproportional exposures to peliglitazar AG across species and the striking differences in exposures to AGs of peliglitazar and muraglitazar in humans lead us to evaluate factors that may influence AG exposures for these two compounds. Intrinsic formation in vitro and direct excretion for acyl glucuronide metabolites in vivo were found to be similar for muraglitazar and peliglitazar. Incubations of muraglitazar and peliglitazar in UDPGA-fortified human liver microsomes or in hepatocytes generated the acyl glucuronides as the major metabolites at similar formation rates. Examination of the acyl glucuronide excretion profile revealed that the acyl glucuronide was excreted as the major metabolite in the bile of humans and to the same extent. Urinary excretion was a minor clearance pathway for both compounds. There was no tissue accumulation or other major differences in tissue distribution patterns in rats after oral administration of [14C]muraglitazar or [14C]peliglitazar (data not shown). These observations do not explain the in vivo data, which showed that muraglitazar AG had a much lower exposure than peliglitazar AG. Thus, the difference in chemical stability or further metabolism of their glucuronide metabolites may have contributed to their very different circulation profiles in humans. Further metabolism of glucuronide metabolites was demonstrated in the in vitro incubations using NADPH-fortified human liver microsomes. The human liver microsome incubations of muraglitazar AG or peliglitazar AG in the presence of NADPH produced hydroxylated and O-demethylated glucuronide metabolites. However, the oxidation of both muraglitazar AG and peliglitazar AG was similarly slow and cannot be used to explain their differences in the circulation.

Factors affecting circulation of an acyl glucuronide metabolite.
In incubations in pH 7.4 buffer at 37°C, muraglitazar AG degraded >7 to 8 times faster than peliglitazar AG (Fig. 3; Table 3). In incubations of muraglitazar and peliglitazar AGs in human plasma, migration isomers were formed to lesser amounts, and these incubations generated aglycons as the dominant products (Figs. 4B and 5B). In addition, the acyl migration isomers quickly degraded to the aglycon in the plasma incubations. For comparison with incubations in buffer (Figs. 4A and 5A), the aglycon was formed 3 to 5 times more slowly than in human plasma. In addition, more acyl isomers were formed and then slowly degraded to the aglycon in the buffer. The greater formation of aglycon in plasma may be due to hydrolysis catalyzed by β-glucuronidases and esterases or an unknown hydrolase. The differences in the plasma stability of muraglitazar and peliglitazar AGs could be governed by the steric hindrance of nearby groups to the sugar aglycon C–O–C=O bond for hydrolysis or migration. The additional methyl group that is near the sugar aglycon bond in peliglitazar compared with muraglitazar might provide the steric hindrance to prevent hydrolysis of peliglitazar AG. This hypothesis of a steric effect on hydrolysis may be tested with model compounds in the future. Differences in the chemical stability of structurally related acyl glucuronides have been well documented (Spahn-Langguth and Benet, 1992; Bailey and Dickinson, 2003). Even stereo isomers (R- versus S-) of acyl glucuronides have been shown to have a 2-fold difference in reactivity (Fenselau, 1994; Akira et al., 2000; Hasegawa et al., 2001; Mortensen et al., 2001). Compared with literature first-order degradation half-lives in a pH 7.4 aqueous buffer of AGs of tolmetin (0.26 h), probenecid (0.4 h), diclofenac acid (0.51 h), R-naproxen (0.92 h), salicylic acid (1.3 h), S-naproxen (1.8 h), ibuprofen (3.3 h), bilirubin (4.4 h), mefenamic acid (16.5 h), gemfibrozil (44 h), and valproic acid (79 h) (Ebner et al., 1999; Shipkova et al., 2003), and dabigatran (1 h) (Ebner et al., 2010), muraglitazar AG (1.23 h) and peliglitazar AG (10.1 h) showed moderate aqueous buffer stability. However, reactivity evaluation in buffer was not sufficient because both muraglitazar and peliglitazar AGs showed approximately 4-fold additional instability in plasma compared with buffer. This additional degradation of muraglitazar AG and peliglitazar AG is consistent with a catalytic hydrolysis by an unknown hydrolase for acyl glucuronides in plasma samples, which could be the reason for the inconsistent correlation between buffer degradation stability and plasma exposures of various acyl glucuronides (Ebner et al., 2010). Although the reactivity in plasma may not completely correlate with chemical stability either, as demonstrated in this study, the real exposure to an acyl glucuronide metabolite in animals or humans is a dynamic process and difficult to assess, especially when one is dealing with a metabolite that had a different degradation rate in plasma samples of different species. This study provides an excellent example to show that muraglitazar glucuronidation as a major metabolic pathway resulted in a minor circulating metabolite due to chemical degradation in humans.
Another potential difference in disposition of AGs that could lead to different circulating levels is further metabolism. Multiple oxidation metabolites of muraglitazar and peliglitazar AGs were identified (as described in the supplemental data). The extent of oxidative metabolism was similar for both muraglitazar AG and peliglitazar AG. Therefore, the elimination of muraglitazar and peliglitazar AGs may partially depend on oxidation of the AGs themselves, but that does not appear to explain the differential exposure seen in humans. Therefore, although other factors such as differential transport of AGs out of the hepatocytes into blood may also play a role, the chemical stability differences certainly would be expected to contribute to the observed exposure differences between muraglitazar AG and peliglitazar AG.
The recent U.S. Food and Drug Administration guidance for the pharmaceutical industry on metabolites in safety testing (Guidance for Industry: Metabolites in Safety Testing, 2008, http://www.fda.gov/cder/guidance) defines a rigorous set of experiments to ensure that disproportionally exposed human metabolites are adequately evaluated in toxicology animal species (Baillie et al., 2002; Humphreys and Unger, 2006; Zhu et al., 2009). The exposure multiples found for peliglitazar AG (AUC) were marginal with the doses used in long-term toxicology studies compared with those seen in humans after a dose thought to be in the appropriate range. The marginal multiples did not precipitate any toxicology studies with peliglitazar AG as the administered agent, but they did prompt significant analysis for plasma AG levels (Xue et al., 2008). It is possible that the company (Bristol-Myers Squibb) could have been asked to consider such a toxicology study by a regulatory agency. In either case, further examination of the situation with these two compounds leads to the conclusion that plasma monitoring of reactive metabolites may provide misleading information. Peliglitazar AG is obviously less reactive, which leads in part to greater circulating concentrations in humans and could have triggered additional toxicology studies. On the other hand, muraglitazar AG is more reactive, which leads to lower plasma concentrations and thus no further consideration of follow-up toxicology studies. This type of scenario could lead to a sponsor de-risking a relatively stable AG with a set of studies and not following up on the more reactive AG product. Overall, this does not seem to provide the best development path for either compound.
LC-MS-based quantitation methods generally apply to chemically stable metabolites and the exposure to a reactive metabolite could only be assessed when the reactive species reacts with an endogenous component to produce a stable form such as an albumin adduct (Zhang et al., 2005, 2007a). Chemical instability adds complications for quantification of those unstable metabolites such as acyl glucuronides (Xue et al., 2008). Although the ex vivo chemical stability of an acyl glucuronide can be improved through sample acidification and storage at low temperature, the chemical instability in vivo is, in general, difficult to measure directly. In this study, the chemical stability of muraglitazar AG or peliglitazar AG was assessed by in vitro incubations under a neutral condition followed by HPLC separation and quantification of degradation components in plasma or buffer fortified with a synthetic glucuronide. In vivo, the hydrolysis of muraglitazar AG or peliglitazar AG catalyzed by an unknown hydrolase formed the parent compounds, which also complicated risk assessment of parents, especially when these acyl glucuronides showed species-dependent degradations (Fig. 3). In addition, conversion of glucuronide metabolites to parent compounds should lead to a higher apparent bioavailability for muraglitazar than for peliglitazar, assuming that all other dispositional properties are similar between two compounds. Unfortunately, bioavailability was not determined for either compound to make that comparison. Furthermore, there were limited data points for peliglitazar AG and no data points for muraglitazar AG to perform any detailed pharmacokinetic analysis for these metabolites.
In summary, different circulating levels of AGs of muraglitazar and peliglitazar were shown to result from the difference in their chemical stability in human plasma, not their production, direct excretion, or further metabolism. The focus on the disproportionate amount of peliglitazar AG in human plasma would meet the requirement set out in the Metabolites in Safety Testing guidance; however, it is questionable whether studies of this AG would add anything for the risk assessment of the compound. The more meaningful risk assessment in this case should not be studies with the more stable peliglitazar AG observed in plasma, but rather studies with the more reactive muraglitazar AG not observed in plasma because of inherent reactivity.
Authorship Contributions
Participated in research design: D. Zhang, Raghavan, Wang, Xue, Li, Humphreys, and Cheng.
Conducted experiments: D. Zhang, Raghavan, Wang, and Obermeier.
Contributed new reagents or analytic tools: D. Zhang, Xue, Cheng, Chen, H. Zhang, and Tao.
Performed data analysis: D. Zhang, Raghavan, Wang, Obermeier, Ramanathan, Li, Yang, and Humphreys.
Wrote or contributed to the writing of the manuscript: D. Zhang, Ramanathan, Yang, and Humphreys.
Acknowledgments
We thank Dr. Wen-Chyi Shyu for critical review of the article.
Footnotes
- Received June 19, 2010.
- Accepted September 28, 2010.
Article, publication date, and citation information can be found at http://dmd.aspetjournals.org.
doi:10.1124/dmd.110.035048.
↵
 The online version of this article (available at http://dmd.aspetjournals.org) contains supplemental material.
ABBREVIATIONS:
- UGT
- UDP-glucuronosyltransferase
- MeOH
- methanol
- AG
- 1-O-β-acyl-glucuronide
- THF
- tetrahydrofuran
- HPLC
- high-performance liquid chromatography
- MS
- mass spectrometry
- LC
- liquid chromatography
- DMSO
- dimethyl sulfoxide
- UDPGA
- UDP-glucuronic acid
- TFA
- trifluoroacetic acid
- AUC
- area under the time-concentration curve.

- Copyright © 2011 by The American Society for Pharmacology and Experimental Therapeutics


