


Abstract
Efflux transporters expressed in the apical membrane of intestinal enterocytes have been implicated in drug oral absorption. The current study presents a strategy and tools to quantitatively predict the impact of efflux on oral absorption for new chemical entities (NCEs) in early drug discovery. Sixty-three marketed drugs with human absorption data were evaluated in the Caco-2 bidirectional permeability assay and subjected to specific transporter inhibition. A four-zone graphical model was developed from apparent permeability and efflux ratios to quickly identify compounds whose efflux activity may distinctly influence human absorption. NCEs in “zone 4” will probably have efflux as a barrier for oral absorption and further mechanistic studies are required. To interpret mechanistic results, we introduced a new quantitative substrate classification parameter, transporter substrate index (TSI). TSI allowed more flexibility and considered both in vitro and in vivo outcomes. Its application ranged from addressing the challenge of overlapping substrate specificity to projecting the role of transporter(s) on exposure or potential drug-drug interaction risk. The potential impact of efflux transporters associated with physicochemical properties on drug absorption is discussed in the context of TSI and also the previously reported absorption quotient. In this way, the chemistry strategy may be differentially focused on passive permeability or efflux activity or both.
Introduction
Adequate oral absorption is a prerequisite for the majority of drug candidates. Although many factors including dissolution, formulation, and food effects are all relevant, oral absorption in humans is predominantly governed by solubility and permeability through the gastrointestinal tract (GI). In general, solubility and permeability are determined by physicochemical properties such as lipophilicity, molecular size, hydrogen bonding strength, and ionization (van de Waterbeemd et al., 1998). However, the prediction of human oral absorption is relatively complicated, particularly at an early drug discovery stage. Therefore, several in vitro tools have been widely used to understand the rate-limiting steps and develop correlations with absorption. For permeability assessment, the parallel artificial membrane permeability assay and cell-based assays (e.g., Caco-2) are among the frequently used tools. The Caco-2 assay has the advantage of addressing not only passive permeability but also active transport and, in particular, efflux transporters that may limit absorption by extruding compound back to the GI lumen.
P-Glycoprotein (P-gp), multidrug resistance protein 2 (MRP2), and breast cancer resistance protein (BCRP) are the three best studied efflux transporters in the ATP-binding cassette family of membrane transporters. Because of their characteristic location at either the entrance or exit side of membrane barriers, it has been widely recognized that these transporters influence drug absorption and disposition as well as efficacy and safety (Giacomini and Sugiyama, 2006). For example, P-gp plays a role in restricting the oral absorption of substrates such as digoxin in the GI tract (Igel et al., 2007). The brain accumulation of prazosin and imatinib is attenuated by P-gp and BCRP synergistically at the blood-brain barrier (Zhou et al., 2009). In addition, P-gp, MRP2, and BCRP are implicated in efflux transporter-related multidrug resistance (MDR) in many studies in tumor cells (Mimeault et al., 2008). Furthermore, toxicity concerns due to transporter-mediated drug-drug interactions (DDIs) have emerged, especially for drugs with a narrow therapeutic index or variable bioavailability (Eberl et al., 2007).
Given the impact of efflux transporters on the absorption, disposition, and safety of a wide range of drugs, the identification of substrates and understanding of the rate-limiting factors in vivo are beneficial to drug candidate selection and optimization. However, it remains challenging to estimate how efflux limits in vivo exposure quantitatively from in vitro data, especially with a paucity of human in vivo data and interindividual variability. Cell-based bidirectional assays such as the Caco-2 assay described here have been widely used to identify efflux substrates via the efflux ratio (ER) (Polli et al., 2001). With ER, all active transport via one or multiple transporters is considered alongside passive permeation. Multiple reports indicate that ER alone cannot project the impact of efflux (Troutman and Thakker 2003b; Kalvass and Pollack 2007). Further mechanistic studies are required to understand kinetics and a dosing strategy for absorption or raise awareness of potential transporter-mediated DDIs.
We have previously described a 96-well Caco-2 bidirectional assay that has been used successfully to measure thousands of NCEs (Skolnik et al., 2010). Overall, 30 to 40% of Novartis NCEs were identified as potential substrates for transporters using the ER. In the present study, we propose a practical strategy to use limited in vitro tools for quickly identifying compounds whose efflux activity may influence human absorption. In particular, a four-zone graphical model based on Caco-2 data and human absorption of marketed drugs has been developed to focus on efflux substrates with low absorption concerns. We further investigated the activity of three efflux transporters in the GI system: P-gp, MRP2, and BCRP. A new substrate classification standard was introduced, in which both in vitro and in vivo behaviors of a substrate were considered. This term, transporter substrate index (TSI), achieved both substrate identification and assessment of transporter activity for each compound. In addition, we integrated the absorption quotient (AQ) into our data analysis to underscore the influence of physicochemical properties on drug absorption. Overall, we intend to create a strategy for lead candidate selection and optimization by presenting the quantitative assessment of potential efflux attenuation on human oral absorption.
Materials and Methods
Materials.
Caco-2 cells were obtained from the American Type Cell Culture repository (Manassas, VA). Heat-inactivated fetal bovine serum, Dulbecco's modified Eagle's medium containing GlutaMAX-I and high glucose, HEPES, and trypsin-2.5% EDTA were purchased from Invitrogen (Carlsbad, CA). Nonessential amino acid solution (100×), sodium pyruvate solution (100×) were obtained from HyClone (Logan, UT). Hanks' balanced salt solution was obtained from Mediatech (Herndon, VA). Multiwell Insert System 96-well (1.0-μm pore size) plates were purchased from BD Biosciences (San Jose, CA). Six-well Transwell polycarbonate membrane inserts were ordered from Corning Life Sciences (Lowell, MA). All solvents were analytical grade, and standard test compounds were obtained from Sigma-Aldrich (St. Louis, MO). (R)-4-((1aR,6R,10bS)-1,2-difluoro-1,1a,6,10b-tetrahydrodibenzo(a,e)cyclopropa(c)cycloheptan-6yl)-α-((5-quinoloyloxy)methyl)-1-piperazine ethanol (LY335979), 3-[[3-[2-(7-chloroquinolin-2-yl)vinyl]phenyl]-(2-dimethylcarbamoylethylsulfanyl)methylsulfanyl] propionic acid (MK571), and [3-(6-isobutyl-9-methoxy-1,4-dioxo-1,2,3,4,6,7,12,12a-octahydropyrazino[1′,2′:1,6]pyrido[3,4-b]indol-3-yl)-propionic acid tert-butyl ester] (Ko143) were obtained in-house or ordered from Alexis Laboratories (San Diego, CA) and Pharmabridge Inc. (Doylestown, PA) and used without further purification.
Bidirectional Transport Assay and Bioanalysis.
Caco-2 plates (96-well) with transepithelial electrical resistance values >200 ohm·cm2 were used for the assay. Test compounds in transport buffer were added to the donor compartments of either apical (A-B) or basolateral wells (B-A) of the Insert System followed by incubation at 37°C for 120 min. The selection of the Caco-2 loading concentration (10 μM) was validated earlier (Skolnik et al., 2010). It was a compromise of allowed solubility, proper identification of efflux substrates in the context of their in vivo impact, and exceeding the liquid chromatography-mass spectrometry detection limit for most discovery NCEs. In the inhibition study, cells were first incubated with transport buffer in the presence or absence of inhibitors for 30 min at 37°C. The transport buffer was then removed and replaced with new buffer containing test compounds with or without inhibitors. LY335979, MK571, and Ko143 were used to inhibit P-gp, MRP2, and BCRP at 1, 10, and 1 μM, respectively (Gekeler et al., 1995; Dantzig et al., 1996; Allen et al., 2002). Samples were collected at 0- and 2-h time points. Lucifer yellow was added to confirm the membrane integrity after sample collection. Acetonitrile was applied to precipitate proteins and a final analytical plate was created after centrifugation by collecting the supernatant. The analysis of samples was performed on a high-performance liquid chromatography-tandem mass spectrometry system (Skolnik et al., 2010).
Quantitative Assessment of Efflux Influence.
Three quantitative terms were used to evaluate the impact of efflux on absorptive transport, including ER, AQ, and a new term, TSI. To apply each term, apparent drug permeability (Papp) across Caco-2 cell monolayers was first determined according to eq. 1:
 where dQ/dt is the total amount of test compound transported to the acceptor chamber per unit time, A is the surface area of the transport membrane (0.0804 cm2), and C0 is the initial compound concentration in the donor chamber.
The ER was determined from the ratio of Papp in secretory (B-A) and absorptive (A-B) directions and was used to flag efflux activity when ER ≥2 in our laboratory (Skolnik et al., 2010). Papp in both directions, along with ER, is a function of passive diffusion (PPD) and active transport. For simplicity, the apparent permeability mediated by influx is not considered in the scope of this article, rendering eqs. 2 and 3:

 PPD (A-B) and PPD (B-A) are the passive diffusion-mediated apparent permeabilities, which equate to Papp (A-B) and Papp (B-A) when the ER decreased to ≤2 in the presence of inhibitor in the current study. Pefflux, app (A-B) and Pefflux, app (B-A) are the differences between PPD and Papp in each direction that can be attributed to active transport, in this case, apparent permeability mediated by efflux. Although theoretically PPD is the same in both A-B and B-A directions with a purely passive mechanism, it often appears to be different under experimental conditions, with A-B generally higher than B-A (Tables 2⇓–4).
However, PPD is often difficult to obtain, particularly when multiple transporters are involved. Therefore, transporter substrate index (e.g., TSIA-B, TSIB-A, and TSIER) is introduced here to capture the changes in Papp and ER for individual transporters in the presence (i) and absence of specific inhibitors in eqs. 4 to 6:


 where Pappi (A-B), Pappi (B-A), and ERi are Papp (A-B), Papp (B-A), and ER measured in the presence of a specific transporter inhibitor. The foundation of using TSIs to capture efflux activity is further supported by the three-compartment kinetic model (Kalvass and Pollack, 2007). For instance, when efflux is completely inhibited, TSIA-B bears conceptual similarity to kinetic efflux ratio term of Kalvass and Pollack (2007), which is proportional to efflux activity.
Of importance, TSIs allow more flexibility when efflux is not completely inhibited. First, they can be applied to NCEs involving multiple efflux transporters, for which it is difficult to determine the true PPD values by inhibiting all efflux processes.
Second, individual TSI can be quantified for each transporter affecting an NCE based on the extent of transporter-substrate interaction. The normalization of the TSI change in response to inhibition of each transporter allows for assessment of the transporter specificity of an NCE and also flagging the potential for transporter-related DDI risk. In this report, TSIs were used for substrate classification and estimated efflux impact on in vivo absorption. TSIER, which characterizes the permeability change in both absorptive and secretory directions, was further proposed to rank individual transporters for their in vivo influence on exposure and DDI risk (see Results and Discussion).
Finally, in the cases in which PPD (A-B) could be obtained, the modified AQ was used in eq. 7 (Troutman and Thakker 2003a):
 AQ provides a quantitative tool, especially for comparing a series of NCEs, in which a single transporter may dominate the transport mechanism (e.g., P-gp). Because our focus is on absorptive permeability, from this point forward Pefflux, app and PPD refer to apparent permeability mediated by efflux and passive diffusion in the A-B direction, unless specified otherwise.
Results
Four-Zone Graphical Model Estimates Efflux Impact on Absorption.
The absorptive transport [Papp (A-B)] in bidirectional cell-based assays is often used to predict human intestinal absorption [fraction absorbed (FA)]. To elucidate the relationship between efflux and Papp (A-B) as well as the impact of efflux on human intestinal absorption, Papp (A-B) was plotted against ER (log-log scale) for 63 structurally diverse marketed drugs that are reported transporter substrates (Fig. 1). In Fig. 1, drugs were shaded by human FA. Overall, with increasing ER, Papp (A-B) and FA tended to decline, indicating that efflux could pose a barrier to absorptive permeability and consequently to intestinal absorption. The same trend was observed in a larger data set of 700 Novartis drug discovery NCEs (data not shown). Compounds were then quantitatively grouped into four zones based on the interplay among Papp, ER, and FA, giving rise to the “four-zone graphical model.” Drugs in zone 1 [Papp (A-B) ≥5 × 10⁻⁶ cm/s and ER <2] generally showed superior absorption (human FA 75–100%) and in vitro-in vivo correlation. Zone 2 [Papp (A-B) < 5 × 10⁻⁶ cm/s and ER <2] was populated by a few drugs with distinctive FA, for which in vitro permeability and in vivo absorption seemed to be largely governed by passive permeability. In zone 3 [Papp (A-B) ≥1.8 × 10⁻⁶ cm/s and ER ≥2], the magnitude (ER up to 10) and impact of efflux transport appeared to be limited as the in vitro permeability and intestinal absorption (FA 50–100%) remained adequate. The majority of drugs in zone 4 exhibited FA less than 50% as a result of low to moderate permeability [Papp (A-B) < 1.8 × 10⁻⁶ cm/s] and significant efflux (ER 2–30; for NCEs, ER was as high as 55). By dissecting the passive and active transport of the drugs (eqs. 2 and 3), we visualize an average PPD of 12.8, 3.9, 11.2, and 2.6 × 10⁻⁶ cm/s from zone 1 to 4, whereas efflux transporters countertransported 29, 41, 54, and 63% of total passive permeability (Pefflux, app/PPD) accordingly. The binning of PPD follows Papp with 1 and 5 × 10⁻⁶ cm/s as the low and high permeability boundary. The four-zone graphical model proposed in the current work seemed to be useful in quickly screening out the potential poorly absorbed NCEs. Of importance, it highlighted mainly zone 4 NCEs for further mechanistic studies to determine the role of PPD and efflux activity when dealing with transporter-related optimization.

Four-zone graphical model to estimate the efflux impact on intestinal absorption. Sixty-three reported or current assay-identified substrates with human FA were plotted using Papp (A-B) against ER in log-log scale. Substrates were ranked by FA (□, ≥75%;  , 35–75%; ■, ≤35%). Four zones were defined as follows: zone 1 [Papp (A-B) ≥5 × 10⁻⁶ cm/s and ER <2] where compounds have superior intestinal absorption and efflux will not be the limiting factor because of high passive permeability; zone 2 [(Papp (A-B) <5 × 10⁻⁶ cm/s and ER <2] where compounds can have various FA and passive permeability but not efflux is the major determinant; zone 3 [(Papp (A-B) ≥1.8 × 10⁻⁶ cm/s and ER ≥2] where the FA of compounds remains adequate because passive permeability is sufficiently high to overcome efflux; and zone 4 [(Papp (A-B) <1.8 × 10⁻⁶ cm/s and ER ≥2] where passive permeability and efflux become comparable and mechanistic studies are required to understand the net outcome of the two competing processes. The data with ER <1 may result from potential involvement of uptake transporter(s) and/or asymmetrical passive permeability intrinsic to the current assay configuration (e.g., distinct surface area and/or drug accessibility in the apical and basolateral sides).
TSI Substrate Classification.
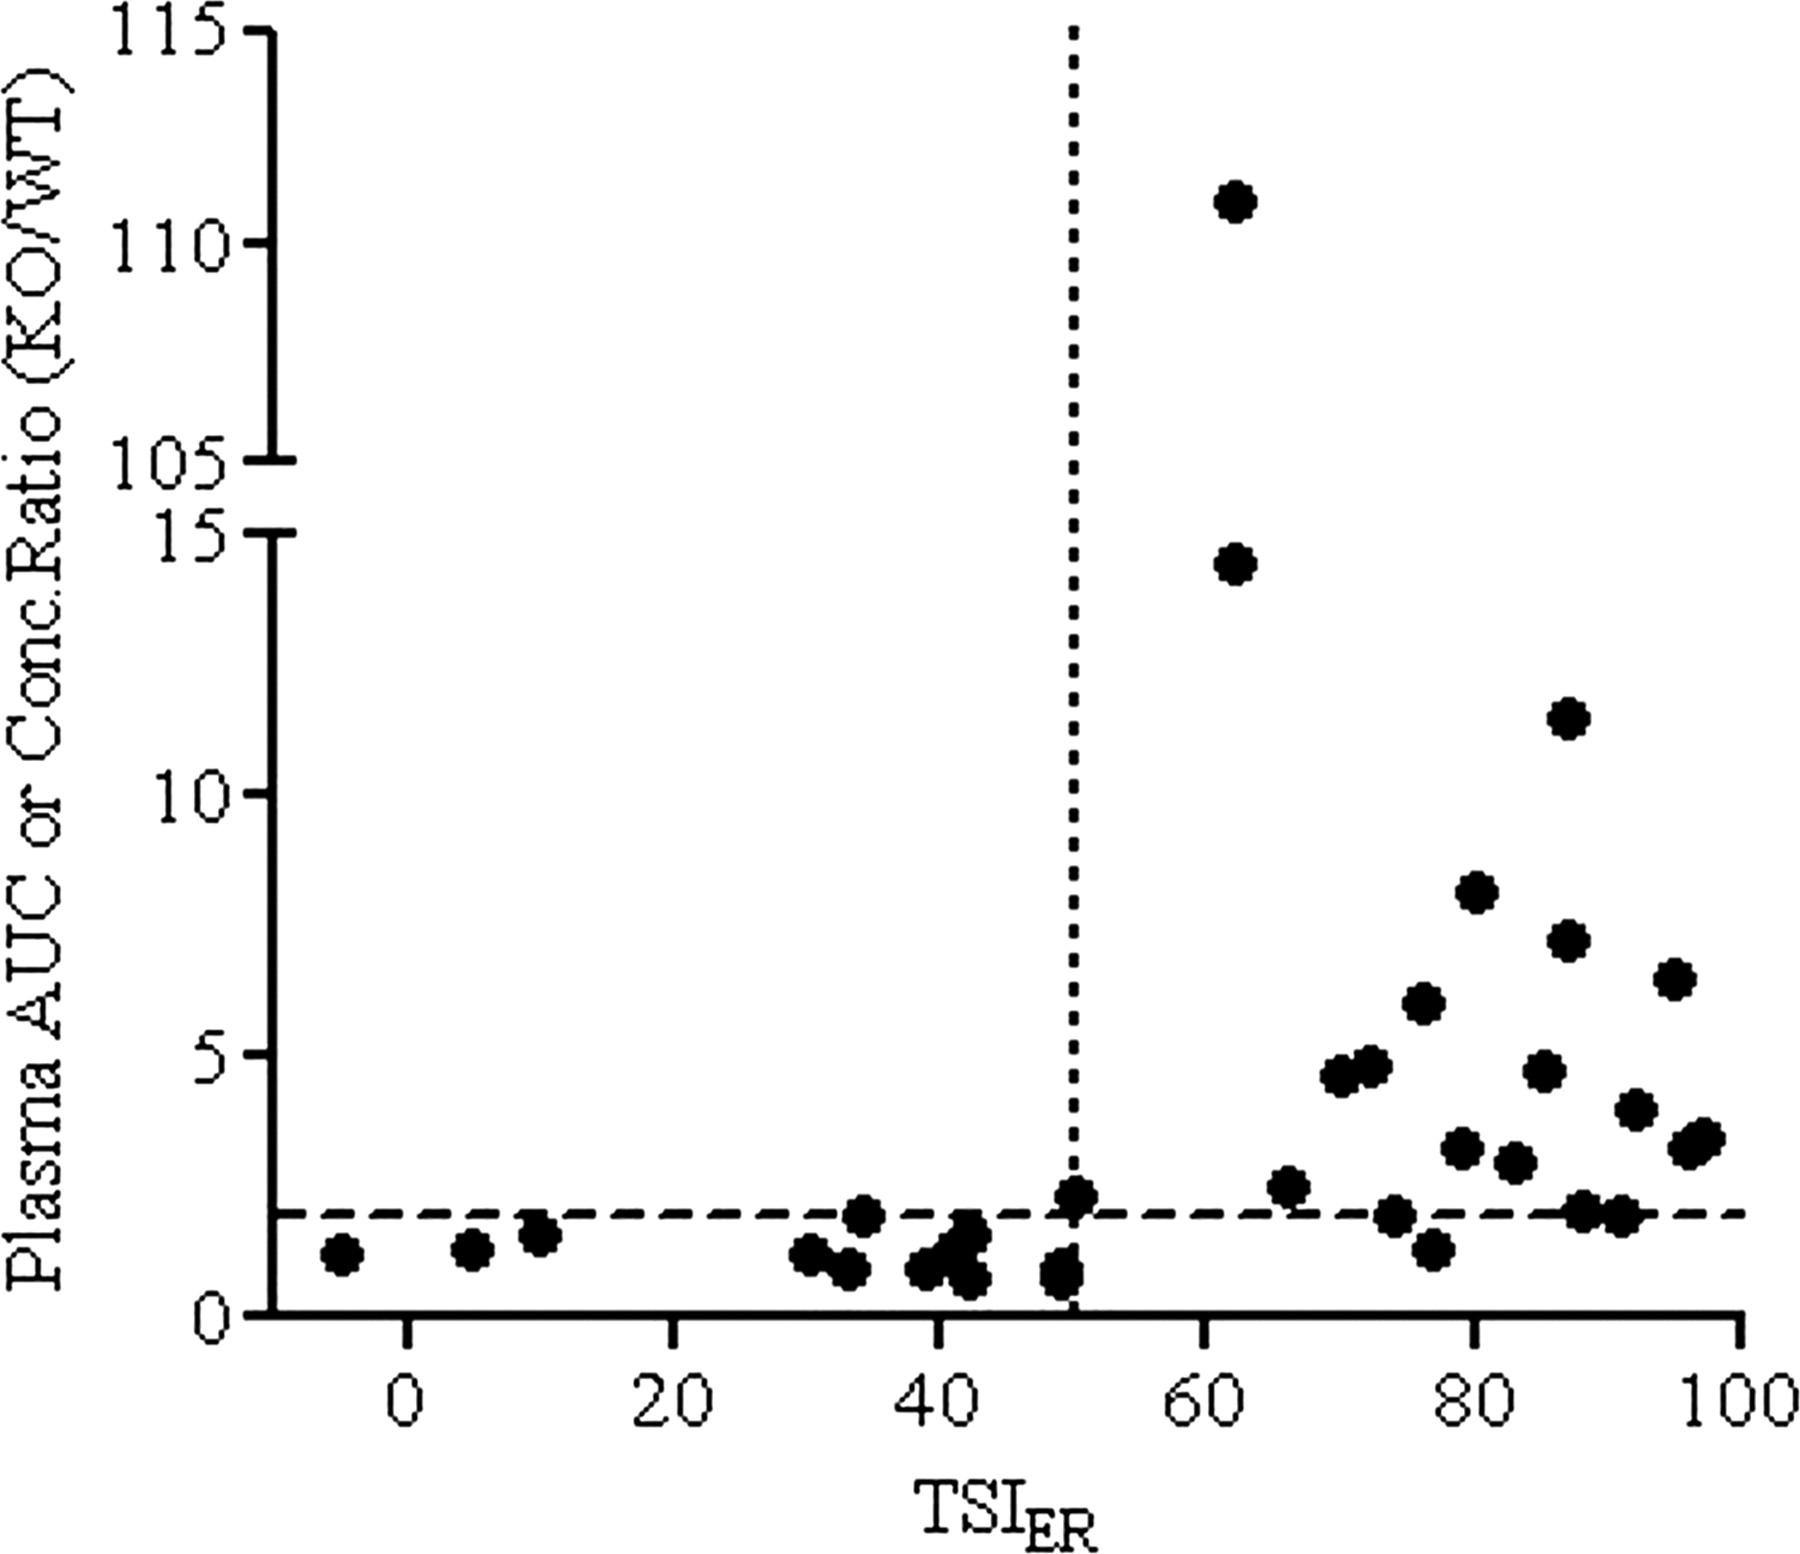
As shown in Fig. 1, efflux transporters distinctively attenuated in vitro absorptive permeability and in turn intestinal absorption. Therefore, it is imperative to quantitatively assess the contribution of efflux transport (Pefflux, app) to the overall drug permeation process (PPD) (eqs. 2 and 3). This may be accomplished by saturating the efflux transporters (i.e., using escalated drug doses) or by inhibiting them to reduce the ER toward unity. The latter can also help identify the responsible transporter(s). Here, considering the critical role each plays in intestinal absorption, P-gp-, MRP2-, and BCRP-mediated transport was studied in a Caco-2 inhibition assay. For some, efflux transporter activities might be further confirmed by secondary transporter-transfected MDCK cell models or transporter-ATPase assays. The quantitative terms, TSIA-B, TSIB-A, and TSIER, were introduced to capture transporter activity change after inhibition and to determine substrate classification (eqs. 4–6). A combination of TSIER ≥25% and TSIA-B or TSIB-A ≥25% distinguished between substrates and nonsubstrates (Table 1). Because of the asymmetric kinetic effects of efflux transporters in absorptive and secretory transport (Troutman et al., 2003b; Kalvass and Pollack 2007), a substrate may display either increased Papp (A-B), decreased Papp (B-A), or both after inhibition. Two underlying considerations for the criteria were as follows: 1) typically Papp (A-B) and Papp (B-A) fluctuated less than ±20% within a plate (data not shown); and 2) using the above criteria, all nonsubstrates and 91 to 100% of substrates were correctly identified for each transporter as reported in the literature or in agreement with secondary assay results. Furthermore, TSIER ≥50% differentiated a substrate as majorly versus partially transported by a specific transporter. This classification was based on the observation that compounds with significant in vivo oral absorption improvement upon blockage of a specific efflux transporter often had in vitro TSIER ≥50% (Fig. 2). In particular, published pharmacokinetic data from transporter knockout (KO) mice compared with wild-type (WT) mice after oral dosing or in situ intestinal perfusion were examined (literature references for in vivo KO/WT mice and in situ perfusion data are given in the footnotes of Tables 2 and 3). Available AUC exposure or plasma concentration KO/WT ratios for mdr1 or Bcrp1, the murine homologs of MDR1 and BCRP, are presented in Tables 2 and 3. As shown in Fig. 2, a 2-fold or greater ratio for either transporter was consistent with TSIER ≥50%. It should be noted that a substrate could have more than one partial or major transporter.
Classification criteria for transporter substrates
If either TSIER or TSIPapp is <25%, compounds are classified as nonsubstrate.

A comparison of TSIER with the in vivo or in situ plasma AUC or concentration ratio from KO versus WT mice. The majority of compounds with TSIER ≥50 had at least a 2-fold increase in previously published plasma AUC or concentration ratios (mdr1 or Bcrp1 KO versus WT), whereas this change was insignificant for those with TSIER <50. This finding suggests that TSIER may help define major versus partial substrate based on the potential in vivo impact of the responsible transporter. (Literature references for KO and WT mice data are given in the footnotes of Tables 2 and 3.)
P-gp substrate classification based on Caco-2 permeability in the presence and absence of 1 μM LY335979
Papp values are presented as mean with coefficient of variance percent ≤15 in triplicate. Drugs were classified based on the criteria in Table 1. i indicates the presence of 1 μM LY335979.
BCRP substrate classification based on Caco-2 permeability in the presence and absence of Ko143
Papp values are presented as mean with coefficient of variance percent ≤15 in triplicate. Drugs were classified based on the criteria in Table 1. i indicates the presence of 1 μM Ko143.
P-gp, MRP2, and BCRP Substrate Characterization.
P-gp.
Sixty marketed drugs containing both P-gp substrates and nonsubstrates were selected for the test set of 1 μM LY335979-mediated P-gp inhibition (Table 2). Among them, 91% of substrates and 100% of nonsubstrates were correctly identified. Of note, the 9% false-negative substrates, e.g., verapamil and nicardipine, resulted from high permeability or transporter saturation (Polli et al., 2001). Indeed, these would not be flagged as efflux in the standard bidirectional assay as their ERs were near unity before inhibition, nor do they have a low absorption concern. For compounds transported majorly by P-gp such as colchicine, the ER decreased to ≤1, indicating that the P-gp-mediated efflux was completely abolished by the inhibitor. For others such as vinblastine, ER remained >2 after inhibition, suggesting involvement of additional transporters such as MRP2. Partially transported substrates such as sulindac showed a moderate TSIER of 29 for P-gp, while also identified as being major substrates for MRP2 (TSIER = 60) (Table 4). In contrast, nonsubstrates did not show changes in TSIs, as observed for furosemide and fluvastatin, major substrates for both BCRP and MRP2.
MRP2 substrate classification based on Caco-2 permeability in the presence and absence of 10 μM MK571
Papp values are presented as mean with coefficient of variance percent ≤15 in triplicate. Drugs were classified based on the criteria in Table 1. i indicates the presence of 10 μM MK571.
BCRP.
Ninety-four percent of BCRP substrates and 100% of nonsubstrates were correctly identified after inhibition by 1 μM Ko143 (Table 3). Metolazone, the only false-negative BCRP substrate using TSIs, was confirmed as a substrate by an in-house MDCK Bcrp model (ER reduced from 5.1 to 1.4 after Ko143 inhibition).
MRP2.
MK571 was reported to modulate multiple transporters including MRPs, P-gp, and BCRP with distinctive potencies (IC50 values are 10, 26, and 50 μM, respectively) (Matsson et al., 2009). Therefore, MK571 was used at a low inhibitory concentration (10 μM) to distinguish MRP inhibition from that of other transporters. Indeed, the efflux transport of colchicine (a P-gp-specific substrate) (Table 2), nitrofurantoin (a BCRP-specific substrate) (Table 3), and erythromycin (a major substrate for both P-gp and BCRP) was not affected under the current condition (Table 4). Because MK571 is less specific toward MRP2 than LY335979 and Ko143 against P-gp and BCRP, respectively, it is the best practice to characterize MRP2 after P-gp and BCRP inhibition studies. The results of this study indicated that a variety of drugs can be transported by MRP2 (Table 4). Although some compounds were classified as substrates by an increase in Papp (A-B), the TSIER of others was mainly due to the decrease in Papp (B-A). This result suggested that by removing MRP2 activity, the absorption of compounds such as dipyridamole would probably be improved, whereas the intestinal excretion of valsartan might be reduced. The classification of MRP2 substrates and nonsubstrates fully agreed with values in the literature. The in-house MRP2 ATPase assay results also indicated that substrates can activate MRP2, whereas nonsubstrates failed to do so.
Although not all substrates were tested against the three transporters in the current study, many showed greatly overlapped transporter substrate specificity. Daunorubicin, etoposide, teniposide, and topotecan were transported by all three to different extents. Colchicine was solely transported by P-gp. BCRP was specifically responsible for norfloxacin. No compound in this test set was found to be transported only by MRP2. Of interest, substrates often displayed distinctive response in absorptive and secretory directions. This observation was illustrated not only by the response of different compounds to the same inhibitor as mentioned above but also by the response of same compound to different inhibitors. For instance, daunorubicin was the major substrate of both P-gp and MRP2. However, the underlying mechanism appeared different because the reduction in secretory transport (TSIB-A) was the main contributor of TSIER change for P-gp, whereas for MRP2 change was primarily attributed to the increase in TSIA-B. Whether the reason is the involvement of multiple transporters or different substrate binding sites and the inhibition mechanisms requires further investigation.
Quantification and Physiochemical Properties of Efflux Attenuating Absorptive Transport.
After the above substrate characterization, a subset of P-gp, MRP2, or BCRP substrates had ER ≤2 after inhibition, allowing for determination of PPD. These 47 compounds were selected to further investigate the interplay of Papp (A-B), PPD, and Pefflux, app using AQ (eq. 7). For a few compounds, more than one specific inhibitor reduced the ER sufficiently, resulting in multiple AQ values. In these cases the highest AQ value was used. In Fig. 3, compounds were grouped in three bands based on PPD, where the boundaries aligned with Papp (A-B) ranking values. A distinctive trendline (H, M, or L) within each band was subsequently extrapolated, for which higher AQ indicated greater attenuation of absorptive transport by efflux. Compounds with high PPD and good oral absorption despite efflux activity (mostly zone 1 and 3) demonstrate a flatter regression line (H) with a slope of −0.08. Compounds with medium PPD and low to moderate oral absorption were less scattered along a steeper trendline (M) with a slope of −0.38. The line (L) with a slope of −0.5 was extrapolated from a smaller compound set with low PPD. The majority of compounds along the trendlines M and L were from zone 4. Because the x-intercept reflected when Papp (A-B) equaled PPD of each trendline according to eq. 7, the compounds clustered around the H, M, and L trendlines have average PPD of approximately 12.3, 2.6, and 1 × 10⁻⁶ cm/s, respectively.

Quantification of efflux attenuating absorptive transport using AQ and Papp (A-B) and subsequently applying the AQ chart to evaluate efflux impact on oral absorption for NCEs. A subset of 47 marketed drugs with ER <2 after inhibition was chosen for the plot. Compounds were color-coded by PPD (□, high ≥5 × 10⁻⁶ cm/s;  , medium 1–5 × 10⁻⁶ cm/s; ■, low ≤1 × 10⁻⁶ cm/s). Compounds appeared to group into three bands based on their PPD (high, white; medium, gray; low, black). Distinct trendlines (H, M, and L) were extrapolated from each band with R2 of 0.45, 0.62, and 0.99 from H to L, respectively. Compounds in zones 1 to 3 tended to cluster along trendline H, whereas zone 4 compounds were more distributed along trendlines M and L. The slopes were calculated using Excel linear fit with the y-intercept forced through AQ = 1 for lines H and M. The intercepts at the x-axis were 12.3, 2.6, and 1.0 × 10⁻⁶ cm/s for trendlines H, M, and L, respectively. The average molecular weight (MW) and polar surface area (PSA) for compounds along each line are shown in parentheses. Subsequently, a series of zone 4 Novartis compounds from a single project were projected onto the AQ chart after the P-gp inhibition study. Compounds in the band with trendline H (+) had good passive permeability and low apparent Km, which favored adequate exposure. For compounds in bands with trendlines M (×) and L(*), complete inhibition of efflux activity or dose escalation did not greatly improve their absorptive transport.
In theory, the y-intercept of each line should equal an AQ of 1, at which absorptive PPD was counteracted by dominant efflux and Papp (A-B) reaches detection limits. Whereas the intercepts for trendlines H and M were close to 1, the trendline L intercepted the y-axis at 0.5. It is likely that the low passive permeability effectively limited access of the substrates to the transmembrane transporters, resulting in a low Pefflux, app that restricted Pefflux, app/PPD from approaching 1. A similar observation was noted for P-gp substrates that were outliers from a linear relationship between AQ and logPapp (A-B) (Varma et al., 2005). Indeed, Troutman et al. (2003a) originally reported a parabolic relationship between AQ and PPD, suggesting that moderately permeable P-gp substrates were most susceptible to P-gp-mediated efflux. Here, no distinction was observed between P-gp-, BCRP-, or MRP2-related transport activities.
Discussion
Four-Zone Model to Quickly Filter Problematic Efflux Transporter Substrates.
Although GI drug transport involves multiple mechanisms, passive diffusion is often the first target for optimization. The Caco-2 four-zone graphical model captures the contribution of both PPD and Pefflux, app and determines a compound's possible range of intestinal absorption. It is clear that zone 1 compounds are preferred over others. For zone 2 NCEs, optimization may focus on PPD because the percentage of Pefflux, app remained comparatively low. Zone 3 compounds, despite a higher percentage of Pefflux, app, would be less of a concern in permeability-limited oral absorption because of the high PPD and possible transporter saturation at the intestinal level (Stenberg et al., 2002). However, together with zone 4, they are more susceptible to transporter-mediated DDIs because of the substantial involvement of efflux in the overall permeability. Attention should be focused on zone 4 compounds for which PPD and Pefflux, app became comparable. Mechanistic studies (inhibition or dose escalation) were necessary to determine whether efflux, PPD, or both limit absorption in zone 4. The dominant contribution of passive mechanism in overall drug transport observed in the zone separation is consistent with the fact that the partitioning into lipid membrane is considered the rate-limiting step for substrate interaction with transporters (Seelig and Landwojtowicz, 2000).
Indeed, more Novartis NCEs than marketed drugs were observed in zone 4. Therefore, challenges should be anticipated for NCEs with poor physicochemical properties. Moreover, the boundary for zone 3 and 4 may change for different chemical series because of various solubility, dose, and therapeutic drug levels. The transporter expression in cells used to generate this model also influences zone boundaries. Ours agreed with human jejunal biopsy rank on efflux transporters with BCRP > MRP2 > P-gp at day 21 (Hilgendorf et al., 2007).
Of note, Wu and Benet (2005) considered the role of active transport (efflux and uptake) for drug disposition within the Biopharmaceutics Drug Disposition Classification System (BDDCS). Whereas BDDCS is recommended when transporters should be evaluated in drug absorption/elimination based on solubility, permeability, and metabolism, the four-zone model is based on permeability, with a focus on efflux transporter impact on intestinal absorption. Given the different classification criteria, it is not surprising that a comparison of the two systems showed no obvious overlap between drugs assigned to zones 1 to 4 and BDDCS class (data not shown).
TSI Applications.
TSIs are particularly useful in projecting individual transporter impact on oral absorption when multiple transporters are involved. For instance, TSIER measures the change in substrate transport in response to specific transporter inhibitors. Compared with available in vivo or in situ studies, substrates with TSIER ≥50 often had a greater than 2-fold increase in AUC or plasma concentration in gene KO over WT mice after oral dosing (Fig. 2). In contrast, when TSIER <50, this increase often was mild or negligible. This observation provided the fundamental reason to separate major versus partial substrates (Table 1). Indeed, the degree of efflux inhibition needed to reverse efflux effect is related to the ER (Kalvass and Pollack 2007). Therefore, it is not surprising to see such a correlation between TSIER and in vivo transporter activity. Although few, there were exceptions, including vinblastine (TSIER = 88, mdr1 AUCKO/AUCWT = 1.5). It was possible that a great portion of drug was absorbed through duodenum where P-gp expression was minimal (Ogihara et al., 2006). Of note, AUC or the plasma concentration ratio between KO and WT does not distinguish the transport across GI tract from other clearance processes. The in vivo dose and formulation are also different from those in vitro. Therefore, a linear relationship between TSIER and exposure was not expected. Rather, TSIER flagged when a meaningful reduction in oral exposure was likely for a substrate mitigated by a specific transporter.
TSIER may also be used to address the overlapped substrate specificity by ranking the relative contribution of each transporter. For example, topotecan was found to be transported by BCRP (TSIER = 76) and P-gp (TSIER = 51). Correspondingly, the bcrp1(−/−) mice showed a 6-fold AUC increase over that in WT mice (Jonker et al., 2002), whereas the ratio was 2 in mdr1a(−/−) mice with oral dosing (Jonker et al., 2000). Likewise, sulfasalazine, a major substrate of BCRP (TSIER = 62) but a nonsubstrate of P-gp (TSIER = 5), was reported to show a 111- and 1.3-fold increase of AUC in bcrp1(−/−) and mdr1a(−/−) mice, respectively (Zaher et al., 2006). It followed that TSIER could potentially be applied to absorption window design. The three transporters studied express differentially along the human intestine: P-gp level increases from proximal to distal, MRP2 does the opposite, and BCRP has the highest expression in jejunum (Murakami and Takano, 2008). One may target or avoid drug delivery to intestinal regions based on the contribution of individual transporters as reflected by TSIER.
In addition, TSIER has potential application for assessing DDIs. Considering the strategic distribution and broad substrate/inhibitor spectrum of transporters, safety concerns have been raised on transporter-mediated DDIs. Like CYP450 substrates, the risk depends largely on the transporter specificity and degree of interaction. The exposure of a substrate may be less susceptible to a single transporter modulator if there is compensation by other pathways. For instance, the systemic exposure of digoxin (TSIER = 87) is predominantly influenced by specific P-gp inhibitors (Fenner et al., 2009). In contrast, the AUC increase of topotecan was greater with N-(4-[2-(1,2,3,4-tetrahydro-6,7-dimethoxy-2-isoquinolinyl)ethyl]-phenyl)-9,10-dihydro-5-methoxy-9-oxo-4-acridine carboxamide (GF120918), an inhibitor of both Bcrp1 and mdr1 (9- versus 6- and 2-fold for individual transporters) (Jonker et al., 2000). The clinical relevance of transporter-mediated DDIs for a wide range of drugs is still under investigation. However, TSIER ranking across the transporters may serve as a potential tool to assess DDI risk.
The AQ-Papp (A-B) Chart.
In the AQ-Papp (A-B) chart (Fig. 3), structurally unrelated substrates grouped by their individual PPD along three trendlines, which illustrated the fundamental influence of physicochemical properties on absorptive transport. For instance, molecular weight and polar surface area, partially accounting for membrane permeation, increased on average from the trendlines H to L. Additional work with a larger data set is ongoing to discriminate the compound trendlines further using pharmacophore and statistical modeling. Ultimately, without further mechanistic experiments, an AQ model may allow estimation of PPD and the highest AQ for NCEs using only Papp (A-B) by correctly projecting compounds onto each line based on their physicochemical properties.
Another important application of the AQ-Papp (A-B) chart is to distinguish efflux from low permeability issues and prioritize compounds based on the impact of the two on absorption. For instance, a series of mostly zone 4 Novartis compounds had low to moderate oral exposure. From mechanistic studies, they were identified as major substrates of P-gp and subsequently projected onto the AQ-Papp (A-B) chart (Fig. 3). The emerging three groups illustrated chemistry strategy. Compounds on the H band were limited by efflux; however, exposure can be improved if efflux activity was modulated by in vivo P-gp saturation (low Km app) or coadministration of P-gp inhibitors (high AQ) (Kuppens et al., 2005). For those compounds along the M band, oral absorption would be limited by suboptimal passive permeability and efflux. Because the majority of compounds projected along this line, line position could guide structure-activity relationships. Compounds along the L band were subject to poor passive permeability, with or without efflux activity. In this case, the AQ Papp (A-B) chart gave a quick alert that structural modification was needed for the project to improve physicochemical properties favoring passive permeability.
In conclusion, we have suggested a sequential strategy to assess potential efflux attenuation of permeability and absorption for NCEs in early discovery. By using the Caco-2 four-zone graphical model, compounds are filtered for further mechanistic studies, with which one can be alerted to compounds with efflux liability or opportunities for improved in vitro-in vivo correlation. The novel TSI parameters allow 1) classifying major roles of multiple transporter(s) on exposure and 2) identifying substrate specificity for targeted delivery or potential transporter-mediated DDI risk. Mapping Papp (A-B) versus AQ provided a quantitative tool, enabling optimization of physicochemical properties and establishment of transporter SAR. The rational understanding of PPD and Pefflux interplay enables quantitative prediction of efflux-attenuated GI absorption and offers valuable guidance for lead candidate selection and optimization.
Authorship Contributions
Participated in research design: Lin, Skolnik, Chen, and Wang.
Conducted experiments: Lin, Skolnik, and Chen.
Contributed new reagents or analytic tools: Lin, Skolnik, Chen, and Wang.
Performed data analysis: Lin, Skolnik, Chen, and Wang.
Wrote or contributed to the writing of the manuscript: Lin, Skolnik, and Wang.
Acknowledgments
We thank Drs. Keith Hoffmaster, Guoyu Pan, David Nettleton, and Guiqing Liang for valuable input. We thank Mark Ollmann and Xavier Briand for technical support.
Footnotes
Article, publication date, and citation information can be found at http://dmd.aspetjournals.org.
doi:10.1124/dmd.110.034629.
-
ABBREVIATIONS:
- GI
- gastrointestinal tract
- P-gp
- p-glycoprotein
- MRP2
- multidrug resistance protein 2
- BCRP/bcrp
- breast cancer resistance protein
- MDR/mdr
- multidrug resistance
- DDI
- drug-drug interaction
- ER
- efflux ratio
- NCE
- new chemical entity
- TSI
- transporter substrate index
- AQ
- absorption quotient
- LY335979
- (R)-4-((1aR,6R,10bS)-1,2-difluoro-1,1a,6,10b-tetrahydrodibenzo(a,e)cyclopropa(c)cycloheptan-6yl)-α-((5-quinoloyloxy)methyl)-1-piperazine ethanol
- MK571
- 3-[[3-[2-(7-chloroquinolin-2-yl)vinyl]phenyl]-(2-dimethylcarbamoylethylsulfanyl)methylsulfanyl] propionic acid
- Ko143
- [3-(6-isobutyl-9-methoxy-1,4-dioxo-1,2,3,4,6,7,12,12a-octahydropyrazino[1′,2′:1,6]pyrido[3,4-b]indol-3-yl)-propionic acid tert-butyl ester]
- A
- apical
- B
- basolateral
- FA
- fraction absorbed
- MDCK
- Madin-Darby canine kidney
- AUC
- area under the curve
- KO
- (gene) knockout
- WT
- wild type
- BDDCS
- Biopharmaceutics Drug Disposition Classification System
- GF120918
- N-(4-[2-(1,2,3,4-tetrahydro-6,7-dimethoxy-2-isoquinolinyl)ethyl]-phenyl)-9,10-dihydro-5-methoxy-9-oxo-4-acridine carboxamide.
- Received May 21, 2010.
- Accepted November 4, 2010.
- Copyright © 2011 by The American Society for Pharmacology and Experimental Therapeutics


