


Abstract
To support drug development and registration, Caco-2 cell monolayer assays have previously been set up and validated to determine whether candidate drugs are substrates or inhibitors of human P-glycoprotein (P-gp). In this study, the drug-drug interaction (DDI) potential of N-(1-{(3R)-3-(3,5-difluorophenyl)-3-[4-methanesulfonylphenyl]propyl}piperidin-4-yl)-N-ethyl-2-[4-methanesulfonylphenyl]acetamide (AZD5672) was assessed accordingly, and a subsequent clinical digoxin interaction study was performed. AZD5672 (1–500 μM) demonstrated concentration-dependent efflux across cell monolayers, which was abolished in the presence of ketoconazole and quinidine, identifying AZD5672 as a P-gp substrate. In addition, P-gp-mediated digoxin transport was inhibited in a concentration-dependent manner by AZD5672 (IC50 = 32 μM). Assessment of the calculated theoretical gastrointestinal inhibitor concentration ([I2]) and predicted steady-state maximum total plasma inhibitor concentration ([I1]) indicated the potential for a DDI at the intestinal but not the systemic level after the predicted therapeutic dose of AZD5672 (100 mg). A clinical study was performed and the plasma pharmacokinetics [observed maximum plasma drug concentration (Cmax) and area under the plasma concentration versus time curve from 0 to 72 h postdose (AUC0–72 h)] of orally dosed digoxin (0.5 mg) were found to be unaffected by coadministration of AZD5672 (50 mg) at steady state. In contrast, a 150-mg dose of AZD5672 significantly increased digoxin Cmax and AUC0–72 h by 1.82- and 1.33-fold, respectively. Concentration-time profile comparisons indicated that digoxin elimination was unchanged by AZD5672, and the interaction was most likely to have resulted from inhibition of intestinal P-gp leading to increased digoxin absorption. The observed dose-dependent clinically significant interaction was accurately predicted using calculated [I2] and in vitro P-gp inhibition data, confirming AZD5672 to be a P-gp inhibitor in vivo.
Introduction
P-glycoprotein (P-gp) is ubiquitously expressed in the gastrointestinal tract, liver, kidney, and brain and can affect the oral bioavailability, biliary and renal clearance, and/or brain penetration of drugs that are substrates of this efflux transporter (Thiebaut et al., 1987; Schinkel, 1999). If a drug is subject to significant P-gp efflux, its absorption, distribution, and elimination could be altered by potent P-gp inhibitors. Likewise, drugs that are potent inhibitors of P-gp may modulate the pharmacokinetic and pharmacodynamic parameters of other P-gp substrates, resulting in toxicity or altered efficacy. Such drug-drug interactions (DDIs) attributed to P-gp have been observed clinically after coadministration of digoxin and quinidine, digoxin and itraconazole, digoxin and valspodar, and loperamide and quinidine (Hedman et al., 1990; Alderman and Allcroft, 1997; Jalava et al., 1997; Fromm et al., 1999; Kovarik et al., 1999; Sadeque et al., 2000; Mizuno et al., 2003).
To date, the most described P-gp-mediated DDIs involve the cardiac glycoside digoxin owing to its narrow therapeutic window and ensuing toxicity if plasma levels are elevated above the normal therapeutic range (Tuncok et al., 1997). Because digoxin is a P-gp substrate that is devoid of cytochrome P450 metabolic clearance (Lacarelle et al., 1991), P-gp efflux plays a major role in both the absorption and renal elimination of the compound (Hedman et al., 1990; Cavet et al., 1996; Jalava et al., 1997; Westphal et al., 2000; Igel et al., 2007). Consequently, this makes digoxin susceptible to pharmacokinetic perturbations arising from inhibition of P-gp in the intestinal tract and kidney upon concomitant administration of P-gp inhibitors (Jalava et al., 1997; Westphal et al., 2000; Igel et al., 2007). For these reasons, digoxin is considered by both the U.S. Food and Drug Administration (FDA) and the European Medicines Agency (EMA) in their respective draft DDI guidance and by the International Transporter Consortium (ITC) in their commentary article to be the recommended gold standard probe for studying P-gp inhibition both in the clinic and in vitro to assess the P-gp-mediated DDI potential of new molecular entities.
Such information is required to support drug development and registration and comprises initial in vitro studies for the identification of the new molecular entity as a substrate or inhibitor of human P-gp, followed, if warranted, by a clinical interaction study (Zhang et al., 2006, 2008; FDA Draft Guidance for Industry: Drug Interaction Studies—Study Design, Data Analysis, and Implications for Dosing and Labeling, http://www.fda.gov/cder/guidance.com, 2006; International Transporter Consortium, 2010; EMA Guideline on the Investigation of Drug Interactions, http://www.ema.europa.eu/docs/en_GB/document_library/Scientific_guideline/2010/05/WC500090112.pdf, 2010). For P-gp inhibitors, evaluation of the ratios of steady-state maximum total (bound plus unbound) plasma inhibitor concentration ([I1]) and theoretical gastrointestinal inhibitor concentration ([I2]) to in vitro inhibitory potential (IC50) are recommended to predict the potential for a systemic (ratio >0.1) or intestinal (ratio >10) P-gp-mediated DDI in the clinic, respectively (FDA, http://www.fda.gov/cder/guidance.com, 2006; Zhang et al., 2008). Calculation of [I1] and [I2] give “worst-case” concentrations that reflect a conservative approach adopted by the FDA for DDI prediction. Used together, the two methods give an accurate prediction rate of approximately 78% (Zhang et al., 2008). Such predictions facilitate a decision on the need to conduct a clinical interaction study to appropriately label a drug for safe and effective use.
AZD5672 is a CCR5 receptor antagonist that was being developed for the oral treatment of rheumatoid arthritis (Gerlag et al., 2010) (Fig. 1). Patients in this disease population are at risk of DDIs because of the multiple comedications that might be taken as a consequence of the comorbid conditions that could be present owing to their advanced age (van Roon et al., 2009). Because of a regulatory requirement and the fact that digoxin might be a likely comedicant, the first aim of this study was to investigate AZD5672 as a substrate and inhibitor of human P-gp using validated in vitro Caco-2 assays (Elsby et al., 2008). On the basis of inhibition predictions, the final aim of this study was to conduct a clinical oral pharmacokinetic interaction study in healthy volunteers to establish whether AZD5672 could perpetrate a P-gp-mediated DDI with digoxin in the clinic. Two doses (50 and 150 mg) of AZD5672 that were close to the predicted therapeutic dose were studied to investigate the dose dependence of any interaction.

Chemical structure of AZD5672.
Materials and Methods
Materials.
Digoxin, ketoconazole, probenecid, propranolol hydrochloride, quinidine hydrochloride monohydrate, and verapamil hydrochloride were purchased from Sigma-Aldrich (St. Louis, MO). [3H]Digoxin (specific activity 870 GBq/mmol, radiochemical purity >97%) and Ultima Gold scintillation cocktail were purchased from PerkinElmer Life and Analytical Sciences (Buckinghamshire, UK). [14C]d-Mannitol (specific activity 2.15 GBq/mmol, radiochemical purity 97.6%) and [3H]propranolol hydrochloride (specific activity 740 GBq/mmol, radiochemical purity 99.7%) were purchased from GE Healthcare (Little Chalfont, Buckinghamshire, UK). [3H]AZD5672 (specific activity 415 GBq/mmol, radiochemical purity 99.3%), nonradiolabeled AZD5672 succinate, [13C6]AZD5672, and AZD5672 succinate 50-mg tablets were synthesized at AstraZeneca R&D Charnwood (Loughborough, UK). Digoxin (0.25 mg of Lanoxin) tablets were obtained from GlaxoSmithKline GmbH and Co. KG (Munich, Germany).
Hanks' balanced salt solution (containing CaCl2 and MgCl2), Dulbecco's modified Eagle's medium (containing pyruvate, 4500 mg/l glucose, and 4 mM l-glutamine), and nonessential amino acids were purchased from Invitrogen (Paisley, UK). Monoflow 2 scintillant was obtained from National Diagnostic (UK) Ltd. (Yorkshire, UK). All other chemicals and reagents were purchased from Sigma-Aldrich or Thermo Fisher Scientific (Loughborough, UK). BD Falcon 24-multiwell insert systems with polyethylene terephthalate membranes (1-μm pore size, 0.3-cm2 surface area) and BD Falcon 24-multiwell companion plates were purchased from BD Biosciences (Oxford, UK). Caco-2 cells (HTB37) were purchased from American Type Culture Collection (Manassas, VA). A Luna C18 3-μm column (50 × 2.0 mm) was obtained from Phenomenex (Torrance, CA). BDS Hypersil C18 (5 μm; 50 × 3.0 mm) column was obtained from Thermo Fisher Scientific (Waltham, MA).
Preparation of Stock Solutions and Donor and Receiver Solutions for In Vitro Assays.
Stock solutions (in dimethyl sulfoxide) and donor and receiver solutions in transport buffer [Hanks' balanced salt solution containing 25 mM HEPES and 0.1% (w/v) bovine serum albumin, pH 7.4] were prepared according to the validated methodology described previously (Elsby et al., 2008).
Caco-2 Cell Culture.
Caco-2 cells were seeded in cell culture medium (consisting of Dulbecco's modified Eagle's medium supplemented with 20% (w/v) fetal bovine serum, 1% (v/v) nonessential amino acids, 98 U/ml penicillin, and 98 μg/ml streptomycin) onto polyethylene terephthalate filter membranes (surface area = 0.3 cm2) of 24-well plates and used for transport studies 15 to 21 days after seeding between passage numbers 25 and 40 as described previously (Elsby et al., 2008).
Chemical and Metabolic Stability of [3H]AZD5672 in the Caco-2 Test System.
To assess metabolic and chemical stability, the radiochemical purity of [3H]AZD5672 (100 μM) in both donor and receiver wells in the bidirectional transport assay and in the donor working solutions after a 2-h incubation at 37°C, respectively, was determined and compared with that determined in the donor working solution at t = 0 h. Samples (100-μl aliquots) were processed with methanol (200 μl) to precipitate protein and centrifuged at 13,000 rpm for 5 min, and the resulting supernatants were analyzed by radioflow high-performance liquid chromatography as described previously (Elsby et al., 2008).
Bidirectional Transport Assay (P-gp Substrate Assessment).
The bidirectional apparent permeability of [3H]AZD5672 (1, 100, and 500 μM) across polarized Caco-2 cell monolayers (n = 3) was determined using the previously described validated procedure (Elsby et al., 2008). The P-gp probe substrate [3H]digoxin (1, 10, and 100 μM) together with the high permeability marker [3H]propranolol (10 μM) were assessed to positively and negatively control the assay, respectively. In brief, radiolabeled test compounds were incubated in transport buffer (pH 7.4) at 37°C on either the apical (total volume of 250 μl) or basolateral (total volume of 600 μl) side of the monolayer for 2 h. Donor compartments also contained the cell monolayer integrity marker [14C]mannitol (50 μM). Corresponding receiver compartments contained transport buffer containing 1% (v/v) dimethyl sulfoxide. The amount of drug appearing in the receiver compartment over time was determined by sampling (50-μl aliquot) at 30-, 60-, 90-, and 120-min time points, quantified by liquid scintillation counting, and used to calculate apparent permeability, which was then used to calculate efflux ratio (ER). The sampled volume (50 μl) taken from the receiver compartment was replaced with an equal volume of warmed transport buffer [containing 1% (v/v) dimethyl sulfoxide] after each time point. If efflux of test compound was observed, determination of its bidirectional apparent permeability was repeated together with digoxin as a positive control at a single concentration in the presence of the P-gp inhibitors ketoconazole (100 μM) or quinidine (100 μM) to confirm the role of P-gp. Inhibitors were present in both donor and receiver compartments and added at the same time as test compound. Inhibitor was also present in the transport buffer used to replace sampled volumes from the receiver compartments. Permeability of [14C]mannitol and transepithelial electrical resistance (TEER) values was measured in all experiments to assess cell monolayer integrity.
Digoxin Interaction (IC50) Assay (In Vitro P-gp Inhibition Assessment).
The basolateral-to-apical apparent permeability of [3H]digoxin (5 μM) across Caco-2 cell monolayers (n = 3) was determined over a range of AZD5672 concentrations (0, 0.1, 0.3, 1, 3, 10, 30, and 100 μM), using the previously described validated procedure (Elsby et al., 2008). The P-gp inhibitor verapamil (0.1–100 μM) and probenecid (equivalent to vehicle control, 10 μM) were used to positively and negatively control the assay, respectively. Inhibitors were present on both sides of the monolayer and were added at the same time as digoxin. The degree of inhibition of P-gp-mediated digoxin transport was determined by calculation of an IC50 where appropriate. [14C]Mannitol permeability and TEER values were measured in all experiments to assess cell monolayer integrity.
Data Analysis.
For every well the concentration determined (nanomolar; corrected for the volume dilution that occurred during sampling) of substrate appearing in the receiver compartment was plotted against sampling time (minutes). Curve-fitting using standard linear regression parameters (correlation coefficient r2 ≥ 0.75) was used to give the rate of drug transport (nanomoles per minute). For bidirectional permeability experiments, drug transport rates were used to determine apparent permeability (Papp) values (Elsby et al., 2008). ERs were calculated from Papp basolateral-to-apical/Papp apical-to-basolateral.
For inhibition studies, calculated digoxin basolateral-to-apical Papp values, in the absence and presence of a range of inhibitor concentrations, were plotted directly against nominal inhibitor concentration, and curve-fitting was performed using XLfit 3.0 (four-parameter logistic model, equation 201) to determine the concentration that produces half-maximal inhibition of P-gp-mediated digoxin transport (IC50). The following equation was used by model 201:
 where A is the minimum y value, B is the maximum y value, C represents the IC50 value, and D is the slope factor.
When fitting, the bottom and top of the curve are locked at values that correspond to the calculated mean digoxin Papp in the presence of 100 μM verapamil (representing complete P-gp inhibition) and the calculated mean digoxin Papp in the presence of probenecid (representing the vehicle control in the absence of inhibitor), respectively. Our basolateral-to-apical inhibition and curve-fitting methodology is directly comparable to the recommended “calculation method no. 3 (inhibition of corrected basolateral-to-apical permeability of digoxin)” of Balimane et al. (2008), which ensures determination of an accurate IC50 value, a prerequisite for accurate prediction of clinical outcome. Rather than converting Papp to percent inhibition by correcting it for the (passive) permeability of digoxin observed when P-gp is completely inhibited (Balimane et al., 2008), we are plotting uncorrected Papp directly and are using the (passive) Papp observed when there is complete P-gp inhibition to define where the bottom of the curve should be when fitting.
Mass balance (percent recovery) was calculated for all experiments by expressing the sum of the amount of substrate (picomoles) found in both the donor and receiver compartments at the end of the incubation (2 h) as a percentage of the initial donor compartment amount (picomoles) at t = 0 h.
Inhibitor concentration [I1] represents either predicted (from pharmacokinetic modeling) maximum plasma drug concentration at steady state (Cmax, ss) or observed Cmax, ss. The theoretical gastrointestinal concentration [I2] was calculated by dividing the oral dose (converted from milligrams to moles) by a volume of 250 ml. Parameters [I1] or [I2] were divided by IC50 to give a ratio.
Clinical Interaction Study Participants.
The clinical study (D1710C00021; Clinical Trial Registration number NCT00723424) was approved by the Independent Ethics Committee, Landesamt für Gesundheit und Soziales, Berlin, Germany and complied with the ethical principles of the International Conference on Harmonization/Good Clinical Practice, in accordance with the Declaration of Helsinki. All subjects provided written informed consent.
Inclusion criteria included the following: male or female sex, aged 18 to 50 years; body mass index of 19 to 29 kg/m2; and clinically normal physical and laboratory findings, including negative results for drug tests and negative results of tests of hepatitis B surface antigen, antibodies to hepatitis C virus, and antibodies to human immunodeficiency virus. Exclusion criteria included the following: known allergy to digoxin; QTc interval >450 ms; clinical evidence of Wolff-Parkinson-White syndrome, intermittent complete heart block, second-degree heart block, or prolonged PR interval of greater than 210 ms on a 12-lead ECG; resting heart rate <45 bpm; potassium level outside the normal range; hypercalcemia or hypermagnesemia; abnormal liver function tests; the use of prescription medications within 2 weeks before study entry; the use of any nonprescription medications (including herbal medications, excluding occasional paracetamol use) within 7 days of first dose of the study medication, unless agreed on by the investigator; a history or presence of clinically significant gastrointestinal, hepatic, or renal disease or other condition known to interfere with the absorption, distribution, metabolism, or excretion of the study drugs; and intake of alcohol, grapefruit, or caffeine during the study.
Clinical Interaction Study Design.
This was a two-period, open-label, single-center study with two dosing groups to determine the pharmacokinetics of a single oral dose of digoxin when administered alone or in combination with AZD5672 at steady state. The study consisted of a screening period of up to 21 days before the first administration of digoxin. Thereafter, two study periods of 6 and 17 days, respectively, followed. The two study periods were separated by a washout phase of at least 7 days (from the digoxin dose of period I to first dose of AZD5672 in period II). In group A, healthy volunteers received a single dose of 0.5 mg of digoxin on day 1 of period I. In period II, 50 mg of AZD5672 was given once a day for 13 days. On day 12 of 13, a further single dose of 0.5 mg of digoxin was concomitantly administered with AZD5672. Group B was conducted with the same regimen, except that a dose level of 150 mg of AZD5672 was evaluated. Finally, there was a follow-up visit 4 to 7 days after the last pharmacokinetic blood sampling in period II.
Pharmacokinetic Assessments.
Digoxin plasma samples (2.7 ml of blood) were obtained in potassium EDTA tubes predose and at 10 min, 30 min, 45 min, 1 h, 1.5 h, 2 h, 3 h, 4 h, 6 h, 9 h, 12 h, 24 h, 36 h, 48 h, 72 h, and 96 h after each dose of digoxin. Plasma samples for the determination of digoxin were stored at −70°C and transported to Covance Bioanalytical Services (Indianapolis, IN), where concentrations of digoxin were determined using a commercially available validated and quality-controlled assay using liquid-liquid extraction; after evaporation under nitrogen, the residue was reconstituted, injected onto a BDS Hypersil C18 (5 μm; 50 × 3.0 mm) column, eluted with a gradient mobile phase containing acetonitrile and 5 mM ammonium formate in 0.1% formic acid, and analyzed using liquid chromatography-tandem mass spectrometry. The standard curve range was from 0.0500 to 10.0 ng/ml using a human plasma sample volume of 0.250 ml.
AZD5672 plasma samples (2.7 ml of blood) were obtained in potassium EDTA tubes predose and at 10 min, 20 min, 30 min, 45 min, 1 h, 1.5 h, 2 h, 2.5 h, 3 h, 3.5 h, 4 h, 6 h, 9 h, 12 h, and 24 h on days 10 and 12 of period II. Plasma samples for determination of AZD5672 were stored at −20°C and transported to Covance Bioanalytical Services. AZD5672 was quantified using a validated, quality-controlled bioanalytical method. In brief, AZD5672 was extracted from human plasma (0.100 ml) by protein precipitation (after addition of acetonitrile containing [13C6]AZD5672 internal standard) and centrifugation. The supernatant was diluted, injected onto a Luna C18 (3-μm; 50 × 2.0 mm) column (Phenomenex) and eluted using an isocratic mobile phase containing 0.1% (v/v) aqueous formic acid (77%) and 0.1% (v/v) formic acid in acetonitrile (23%). AZD5672 and internal standard were detected using liquid chromatography-tandem mass spectroscopy by multiple reaction monitoring of the transitions 640.5 to 399.2 and 646.4 to 399.2, respectively, and quantified with a standard curve of range 0.500 to 500 nM.
Pharmacokinetic Analysis.
The pharmacokinetic variables were determined by noncompartmental analysis using WinNonlin (version 5.01; Pharsight, Mountain View, CA). The pharmacokinetic parameters calculated for digoxin were the observed maximum plasma drug concentration (Cmax), area under the plasma concentration versus time curve from 0 to 72 h postdose (AUC0–72 h), and the time to reach maximum concentration after drug administration (tmax). The pharmacokinetic parameter determined for AZD5672 for the purpose of this analysis was the observed maximum plasma drug concentration at steady-state (Cmax, ss) on day 10.
Statistical Analysis.
To address the primary objective, a point estimate and 90% confidence intervals for the ratio of digoxin AUC0–72 h and Cmax (with AZD5672/without AZD5672) were presented for each dosing group of AZD5672. These were obtained by analyzing the log-transformed AUC0–72 h and Cmax for digoxin. No clinically significant drug-drug interaction was concluded if the 90% confidence interval fell within 0.67 and 1.5. A similar nonparametric analysis [the Hodges Lehmann 90% confidence interval for the pairwise treatment difference according to Tukey using the formula for small samples, as outlined in Hollander and Wolfe (1999)] was applied to tmax.
Safety Assessment.
All subjects underwent pre- and poststudy medical assessments consisting of a physical examination, routine laboratory tests, vital signs, and 12-lead ECG. Safety parameters monitored throughout the study periods included routine laboratory tests, vital signs, 12-lead ECG, and adverse events.
Results
Assessment of AZD5672 as a Substrate and Inhibitor of P-gp In Vitro.
Assessment of cell monolayer integrity and recoveries.
All cell monolayers passed acceptance criteria (as described in Elsby et al., 2008) with regard to their TEER (≥600 ohms or 180 ohms × cm2) and [14C]mannitol apparent permeability values (≤0.953 × 10⁻⁶ cm/s), indicating that the monolayers were acceptable for use. TEER values ranged from 820 to 1096 ohms (246–329 ohms × cm2). Apparent permeability values for mannitol ranged from 0.316 to 0.694 × 10⁻⁶ cm/s. In all experiments conducted, mass balance (% recovery) was acceptable (>70%). Recoveries ranged from 88 to113, 89 to 101, 75 to 91, and 90 to 115% for [3H]digoxin, [3H]AZD5672, [3H]propranolol, and [14C]mannitol, respectively. Occasionally, calculated mass balance values from an individual well exceeded 100% as the disintegrations per minute value (used to derive picomoles) for the volume sampled from the donor compartment at t = 2 h was slightly higher than the value achieved for the volume sampled at t = 0 h. Although these instances can be attributed to the normal minor variability associated with pipetting, which is noticeable because the donor compartment contains such high levels of radioactivity (typically tens to hundreds of thousands of disintegrations per minute), they confirm the absence of nonspecific binding for the compound(s) in question.
Chemical and metabolic stability of [3H]AZD5672 in the Caco-2 test system.
The radiochemical purity of [3H]AZD5672 determined in donor compartments at the end of the 2-h incubation ranged from 94.2 to 99.8% and for the donor working solution (t = 2 h) was 97.2%, qualitatively similar to that determined for the donor working solution at t = 0 h (98.3%). In addition, the radiochromatographic traces obtained at the end of a 2-h incubation were qualitatively similar to those obtained at the start of the incubation; i.e., there were no additional peaks (data not shown), demonstrating stability of this compound in the in vitro test system.
Bidirectional transport assay (P-gp substrate assessment).
No efflux was observed for the negative control [3H]propranolol (10 μM) (Fig. 2). The positive control substrate [3H]digoxin (1, 10, and 100 μM) exhibited vectorial efflux (ERs ranged from 7.1 to 9.2) (Fig. 2), which was abolished (ER was reduced to <2) in the presence of the P-gp inhibitors ketoconazole and quinidine (Fig. 3).
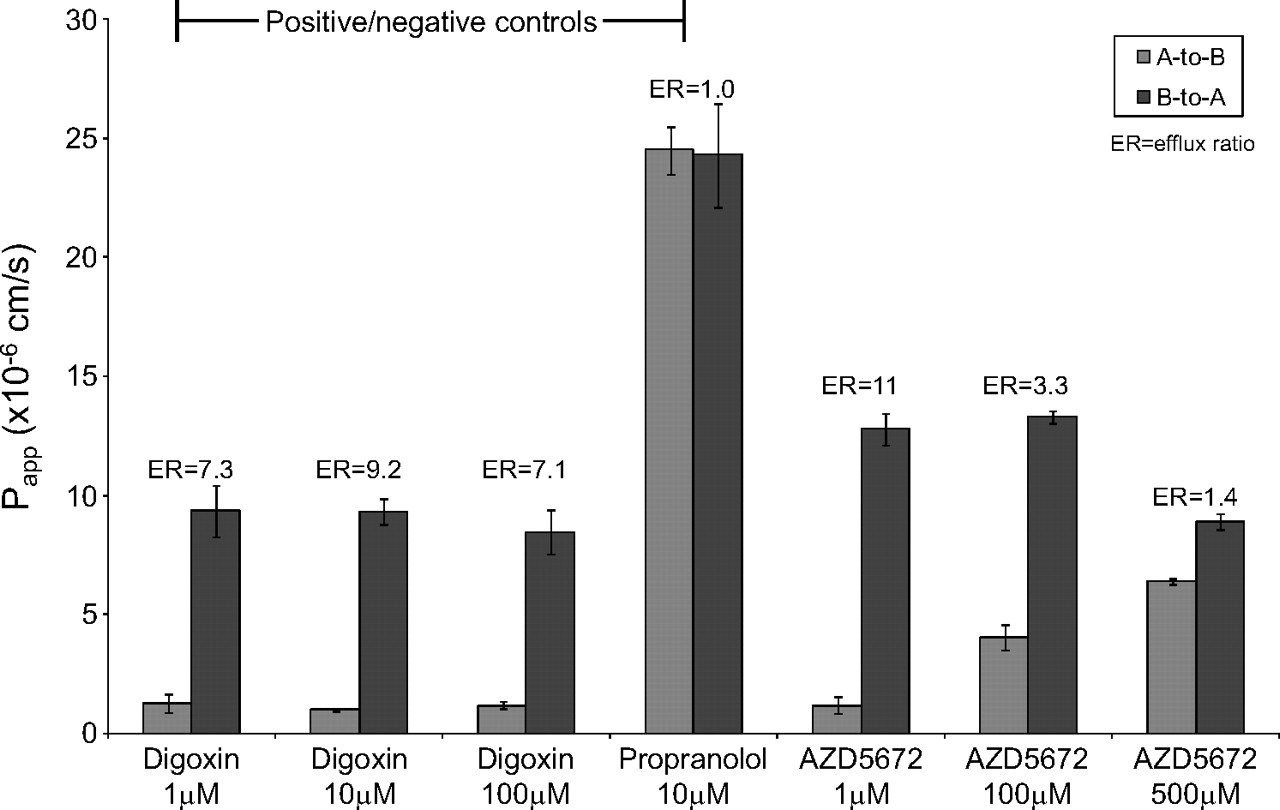
Bidirectional Papp values for the positive and negative control substrates [3H]digoxin and [3H]propranolol and the test compound [3H]AZD5672 across Caco-2 cell monolayers. Data are expressed as the mean ± S.D. (n = 3). A, apical; B, basolateral.

Bidirectional Papp values for a single concentration of the positive control substrate [3H]digoxin and for [3H]AZD5672 across Caco-2 cell monolayers in the presence and absence of the P-gp inhibitors ketoconazole (100 μM) and quinidine (100 μM). Data are expressed as the mean ± S.D. (n = 3). A, apical; B, basolateral.
The mean bidirectional apparent permeabilities of [3H]AZD5672 determined at 1, 100, and 500 μM are shown in Fig. 2; ERs ranged from 11 (at 1 μM) to 1.4 (at 500 μM). The efflux of a single concentration of [3H]AZD5672 (1 μM) was abolished (ER reduced from 11 to 0.8 or 1.2, respectively) in the presence of the P-gp inhibitors ketoconazole (100 μM) and quinidine (100 μM) (Fig. 3).
Digoxin interaction (IC50) assay (in vitro P-gp inhibition assessment).
The negative control inhibitor probenecid (10 μM) did not affect digoxin basolateral-to-apical directional apparent permeability (9.58 × 10⁻⁶ cm/s). The positive control inhibitor verapamil inhibited P-gp-mediated digoxin transport with a mean ± S.D. (n = 3) apparent IC50 of 3.1 ± 0.64 μM (Fig. 4). AZD5672 inhibited P-gp-mediated digoxin transport in vitro with a mean (±S.D.) (n = 3) apparent IC50 of 32 ± 4.2 μM (Fig. 4).
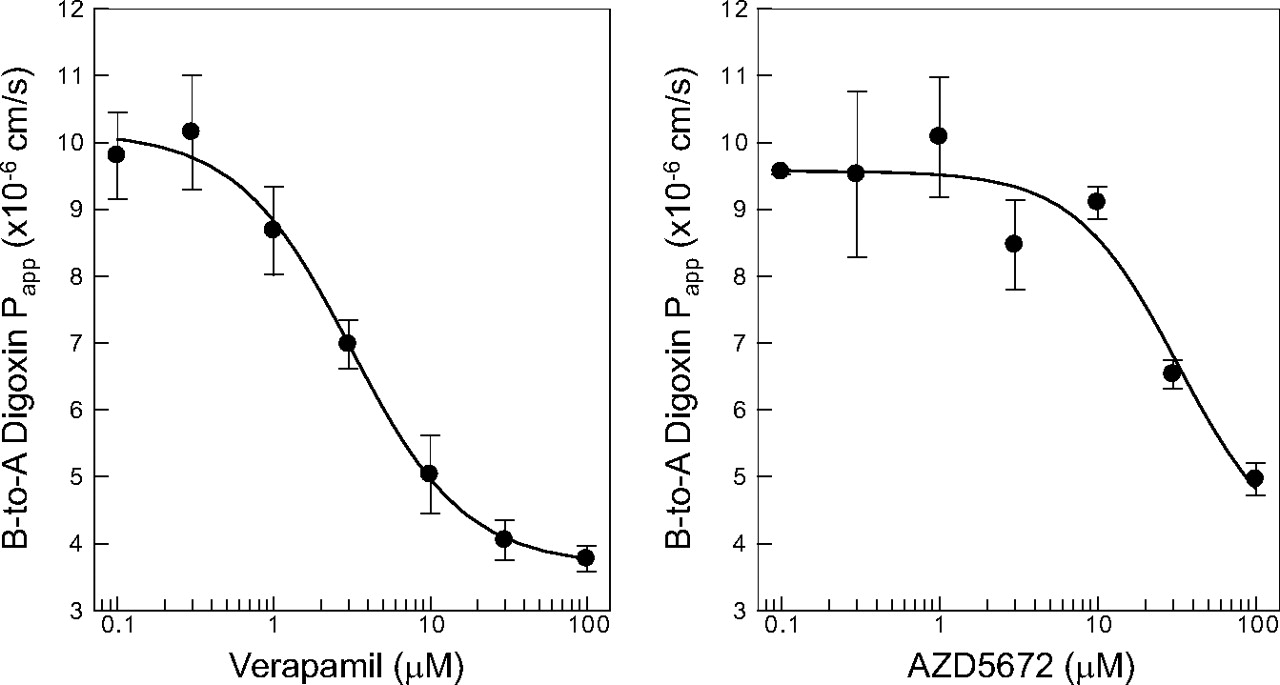
IC50 curves for the inhibition of P-gp-mediated [3H]digoxin transport across Caco-2 cell monolayers by the positive control inhibitor verapamil and AZD5672. Data are expressed as the mean ± S.D. (n = 3). A, apical; B, basolateral.
Calculation of [I]/IC50 Ratios for the Predicted Therapeutic Dose of AZD5672, and for the 50-mg and 150-mg Doses of AZD5672 Used in the Clinical Study.
The calculated [I1]/IC50 and [I2]/IC50 ratios for the predicted (from pharmacokinetic modeling) therapeutic dose of AZD5672 (100 mg) and the actual doses of AZD5672 used in the clinical interaction study are shown in Table 1. The [I1] value given for the 50- and 150-mg dose of AZD5672 is the actual determined total Cmax of AZD5672 (at steady state) derived from the plasma concentration data determined in the clinical interaction study.
Summary of AZD5672 dose-related concentration and inhibitory kinetic parameters for calculation of [I]/IC50 ratios
Effect of AZD5672 on the Pharmacokinetic Parameters of Digoxin in Healthy Volunteers.
The major pharmacokinetic parameters of a single oral dose of digoxin (0.5 mg) when administered alone or concomitantly with 50 mg of AZD5672 or 150 mg of AZD5672 at steady state (dosed once daily for 12 days) are summarized and compared in Table 2. The mean plasma concentration-time profiles (0–24 h) are shown in Fig. 5. The 50-mg dose of AZD5672 at steady state did not appear to alter either the geometric least-squares mean AUC0–72 h nor Cmax of digoxin. In contrast, the 150-mg dose of AZD5672 at steady state significantly increased the geometric least-squares mean AUC0–72 h and Cmax of digoxin by 1.33-fold (90% confidence interval, 1.12–1.57) and 1.82-fold (90% confidence interval, 1.38–2.39), respectively, indicating an interaction. There were no significant differences between digoxin tmax after administration of digoxin alone or in combination with either dose of AZD5672 (data not shown).
Effect of coadministration of AZD5672 at steady state on the geometric least-squares mean (n = 12) pharmacokinetic parameters of digoxin
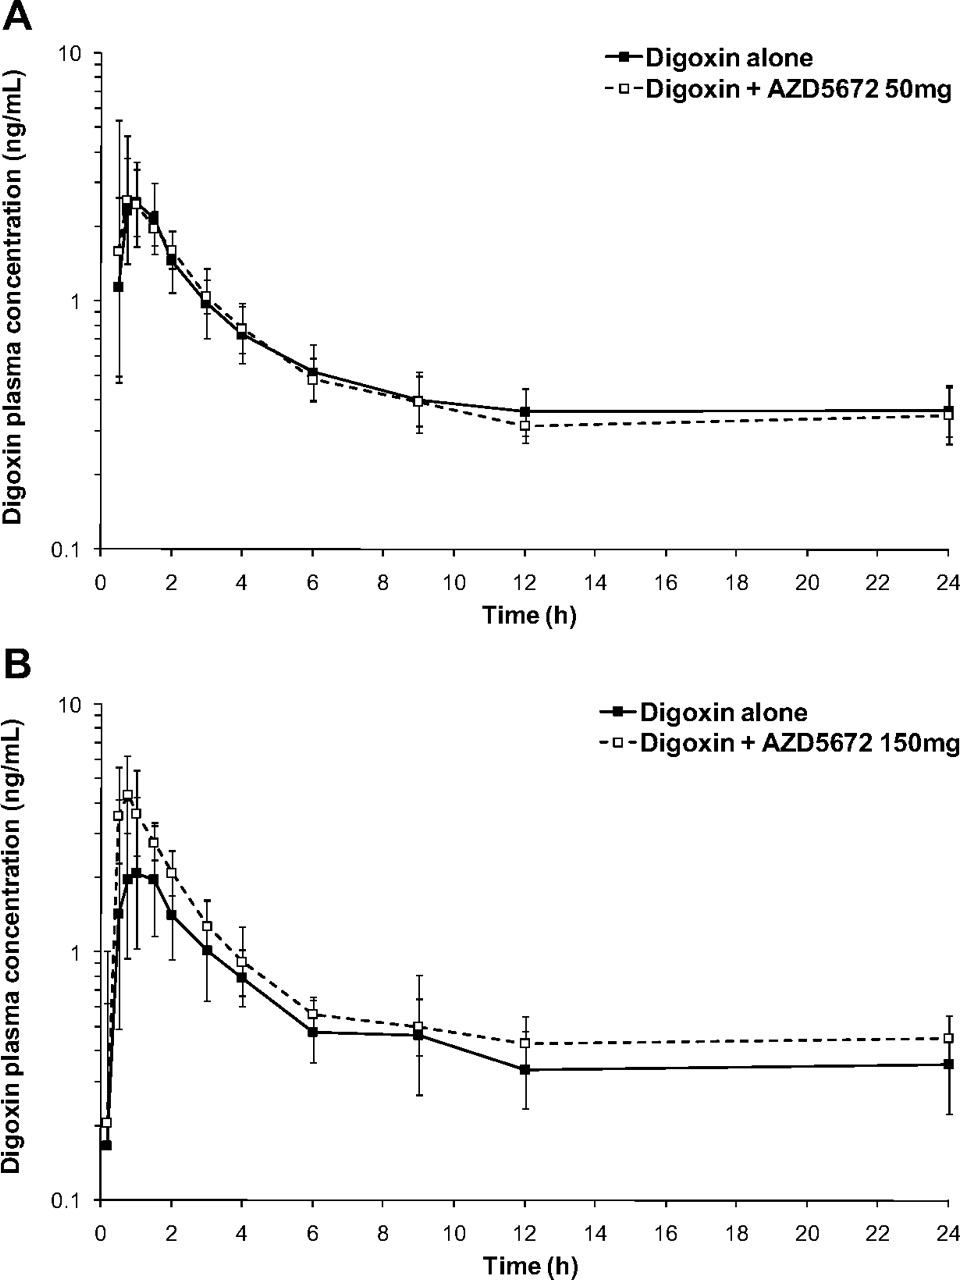
Semilogarithmic plot of the geometric mean ± S.D. digoxin plasma concentration versus time after administration of a single oral dose of digoxin (0.5 mg) in the presence and absence of 50 mg of AZD5672 (A) and 150 mg of AZD5672 (B).
Discussion
Inhibition of P-gp can affect the oral bioavailability, biliary and renal clearance, and/or distribution of drugs that are substrates of this transporter, resulting in a drug-drug interaction. To date, the vast majority of DDIs attributed to P-gp have been observed clinically with digoxin because the transporter plays a major role in the drug's disposition (Hedman et al., 1990; Jalava et al., 1997; Kovarik et al., 1999; Westphal et al., 2000). Resultant safety concerns related to the narrow therapeutic window of digoxin are the reason, in part, that assessment of the potential for P-gp-mediated drug-drug interactions in the clinic is required to support drug development and registration (FDA, http://www.fda.gov/cder/guidance.com, 2006; EMA, http://www.ema.europa.eu/docs/en_GB/document_library/Scientific_guideline/2010/05/WC500090112.pdf, 2010). Accordingly, because of the regulatory requirement and the fact that digoxin is likely to be a comedicant in the target disease population with rheumatoid arthritis, the human P-gp-mediated DDI potential of the candidate drug AZD5672 was evaluated.
The validated Caco-2 cell monolayer test system and associated bidirectional transport and digoxin interaction assays were used in this study in strict accordance with the previously defined acceptance criteria for quality control of the assays (Elsby et al., 2008) to evaluate AZD5672 as a substrate or inhibitor of human P-gp in vitro. The demonstration that AZD5672 was both chemically and metabolically stable in the in vitro test system confirmed that the radioactivity quantified by liquid scintillation counting originated from radiolabeled parent compound and not from degradative products/metabolites and gave confidence in the calculation of apparent permeability. Vectorial efflux of the positive control substrate digoxin, assessed alongside AZD5672 in the bidirectional transport assay, and abolition of this efflux by the potent P-gp inhibitors ketoconazole and quinidine (Elsby et al., 2008) confirmed that the in vitro test system had sufficient P-gp expression for transport experiments and was able to identify substrates of P-gp. The contribution of an active transporter protein to the apparent permeability of AZD5672 was demonstrated by concentration-dependent vectorial efflux at 1 and 100 μM, which was saturated at 500 μM. This drug transporter was confirmed to be P-gp, as the efflux of AZD5672 was abolished in the presence of ketoconazole and quinidine. A follow-up clinical interaction study between AZD5672 (as a substrate/victim) and a clinical P-gp inhibitor was deemed unnecessary for a number of reasons. First, from an absorption perspective, inhibition of P-gp is unlikely to have an impact on AZD5672 at the predicted therapeutic dose (100 mg) because the primary mediator of absorption at this theoretical intestinal concentration ([I2] = 528 μM) (Table 1) would be passive permeability as P-gp is likely to be saturated. Second, from a kidney perspective, because a human radiolabeled excretion-balance study indicated that renal elimination of unchanged AZD5672 accounted for only 5% of the administered dose, overall clearance of AZD5672 is unlikely to be significantly affected by inhibition of renal P-gp (R. Elsby, unpublished data). Finally, from a central nervous system penetration perspective, the clinical impact of P-gp inhibition at the blood-brain barrier remains unclear (Eyal et al., 2009; International Transporter Consortium, 2010).
In the digoxin inhibition assay, the acceptable basolateral-to-apical apparent permeability of digoxin (∼9.5 × 10⁻⁶ cm/s) in the presence of the negative control inhibitor probenecid, coupled with the determined IC50 (3.1 μM) of the positive control inhibitor verapamil, gave confidence in the test system used to generate data for the test compound. AZD5672 inhibited P-gp-mediated digoxin transport in a concentration-dependent manner with an IC50 of 32 μM, identifying AZD5672 as an inhibitor of human P-gp in vitro. Assessment ([I1]/IC50 >0.1 and [I2]/IC50 >10) of the in vitro P-gp inhibitory data generated indicated that for the predicted therapeutic dose (100 mg), AZD5672 had the potential to cause an intestinal ([I2]/IC50 = 17) rather than a systemic ([I1]/IC50 = 0.006) P-gp-mediated DDI in vivo (Table 1).
Consequently, a clinical interaction study between concomitantly administered AZD5672 (orally dosed to steady state) and digoxin (single oral dose of 0.5 mg) was conducted in healthy volunteers, with digoxin plasma pharmacokinetics being determined before and after coadministration of AZD5672. Results from the clinical study indicated that the dose selection of AZD5672 mitigated the risk of a DDI with digoxin, because the 50-mg AZD5672 dose had no effect on digoxin pharmacokinetics, whereas the 150-mg dose elicited a clinically significant DDI resulting in a 1.82- and 1.33-fold increase in digoxin Cmax and AUC0–72 h, respectively. The observation that Cmax was more sensitive to change than AUC for digoxin in this study is in agreement with previous observations evaluating a range of perpetrators (Fenner et al., 2009). Furthermore, examination of the digoxin concentration-time profiles obtained in the presence and absence of AZD5672 (150 mg) indicated that the DDI was attributable to increased digoxin absorption, because the rate of digoxin elimination appeared unchanged as the elimination phases of the profiles were parallel (Fig. 5). Whereas P-gp has been demonstrated to be the primary transporter mediating the absorption and disposition of digoxin (Cavet et al., 1996; Jalava et al., 1997; Igel et al., 2007), it has been reported previously that digoxin is also a substrate of the hepatic uptake transporter OATP1B3 (Kullak-Ublick et al., 2001). Nevertheless, because AZD5672 is not a substrate of OATP1B3 (R. Elsby, unpublished data), it is unlikely that the observed increase in digoxin absorption (Cmax) due to AZD5672 is a consequence of competitive inhibition of OATP1B3. Therefore, the increased absorption of digoxin in this study may be attributed to inhibition of intestinal P-gp by AZD5672. This result is further supported by the fact that the observed increase in digoxin AUC in the present study (33%) is close to the calculated theoretical maximum increase (42%) in the digoxin (Lanoxin) AUC that would be expected if absorption of digoxin increased from the usual 70 to 100% because of intestinal P-gp inhibition (Fenner et al., 2009). Moreover, when the clinically observed AZD5672 steady-state Cmax and calculated theoretical gut concentration for the 150-mg dose of AZD5672 were used to back-extrapolate assessment ([I]/IC50) of the in vitro P-gp inhibitory data, the resultant ratios predicted an intestinal-based DDI ([I2]/IC50 = 25) rather than an elimination-based (systemic) DDI ([I1]/IC50 = 0.009) with 150 mg of AZD5672.
Of interest, the back-extrapolated ratios for the 50-mg dose of AZD5672 also correctly predicted observed clinical outcome: [I1]/IC50 (0.002) and [I2]/IC50 (8.3) ratios predicted neither a systemic nor intestinal interaction, respectively. These data for both doses of AZD5672 support the approach proposed by the FDA for assessing P-gp DDI potential. It was noted that use of the revised [I2]/IC50 >5 ratio suggested by Cook et al. (2010) would have resulted in a false-positive DDI prediction for the 50-mg dose of AZD5672 if applied to the current study; however, those authors acknowledged that refinement of this ratio to reduce false-negatives would inevitably increase the number of false-positives.
Because 150 mg of AZD5672 has been found to cause a clinically significant intestinal P-gp-mediated DDI with digoxin, a dose adjustment may be required if this dose of AZD5672 and digoxin (or other drugs whose absorption is primarily restricted by P-gp) are to be coadministered. Clearly, no such dose adjustment will be necessary if the therapeutic dose of AZD5672 is determined to be 50 mg.
In summary, in vitro studies have identified AZD5672 as both a substrate and an inhibitor of human P-glycoprotein, and the data were used to support the candidate drug's development. In a subsequent clinical study, AZD5672 (150 mg) demonstrated a clinically significant DDI with digoxin, thereby confirming it to be a P-gp inhibitor in vivo. Finally, the observed clinical interaction was accurately predicted using calculated [I2] and in vitro P-gp inhibition data.
Authorship Contributions
Participated in research design: Elsby, Gillen, Imisson, Smith, and Surry.
Conducted experiments: Elsby and Smith.
Performed data analysis: Elsby, Gillen, and Imisson.
Wrote or contributed to the writing of the manuscript: Elsby, Gillen, Butters, Imisson, Sharma, Smith, and Surry.
Acknowledgments
We thank Kate Harris and Shanoo Ravalia (Pharmaceutical Development, AstraZeneca R&D Charnwood) for the culture and supply of the Caco-2 cells and Dr. Ken Grime (Discovery DMPK, AstraZeneca R&D Charnwood) for his critical review of the manuscript. We acknowledge Covance Inc. for bioanalytical support.
Footnotes
Article, publication date, and citation information can be found at http://dmd.aspetjournals.org.
doi:10.1124/dmd.110.035881.
-
ABBREVIATIONS:
- P-gp
- P-glycoprotein
- DDI
- drug-drug interaction
- AZD5672
- N-(1-{(3R)-3-(3,5-difluorophenyl)-3-[4-methanesulfonylphenyl] propyl}piperidin-4-yl)-N-ethyl-2-[4-methanesulfonylphenyl]acetamide
- FDA
- U.S. Food and Drug Administration
- EMA
- European Medicines Agency
- ITC
- International Transporter Consortium
- TEER
- transepithelial electrical resistance
- ER
- efflux ratio
- AUC
- area under the plasma concentration versus time curve
- OATP
- organic anion-transporting polypeptide.
- Received August 16, 2010.
- Accepted November 12, 2010.
- Copyright © 2011 by The American Society for Pharmacology and Experimental Therapeutics


