


Abstract
Cell differentiation increases UDP-glucuronosyltransferase (UGT) gene expression in Caco-2 cells. Glucuronidation of 13 UGT substrates, 1-naphthol, diclofenac, epitestosterone, estradiol, ethinylestradiol, indomethacin, oxazepam, R- and S-propranolol, propofol, testosterone, trifluoperazine, and zidovudine, were studied to derive a broad view on the effect of cell differentiation on the glucuronidation activities of different human UGTs. In parallel, the glucuronidation of these compounds in human liver microsomes (HLM) and human intestinal microsomes (HIM) was analyzed. Because many of the substrates are highly lipophilic, the effects of dimethyl sulfoxide (DMSO) concentrations in the reaction mixture on glucuronidation rates were tested, as well as the effect of alamethicin, a pore-forming peptide. Large differences were observed in the effects of DMSO and alamethicin between recombinant UGTs and Caco-2 cells and HLM and HIM, and, therefore, the activity assays were performed under multiple conditions. Regardless of the assay conditions, however, the results clearly indicated that although differentiation increases glucuronidation activity, the rates in Caco-2 cells are mostly very low, much lower than those in either HLM or HIM. One clear exception was observed: substrates of UGT1A6, such as 1-naphthol, were glucuronidated at very high rates in both undifferentiated and differentiated Caco-2 cells. It may thus be concluded that Caco-2 cells, even differentiated ones, do not provide a good model system to assess first-pass drug glucuronidation in the intestine.
Introduction
The Caco-2 cell line, originating from colon carcinoma (Pinto et al., 1983), is widely used as a model system for drug absorption in the intestine (for review, see Press and Di Grandi, 2008). Confluent and differentiated Caco-2 cells have enterocyte-like properties (Hidalgo et al., 1989) and contain many enterocyte transporters (Siissalo et al., 2007), supporting their use for assessing both passive diffusion and active transport of drugs across the intestinal epithelium.
Absorbed drugs are often subjected to first-pass metabolism in the intestine, and, therefore, it is worth asking how drugs are metabolized in Caco-2 cells. The expression and activity of cytochrome P450 monooxygenase enzymes in Caco-2 cells are very low (Prueksaritanont et al., 1996; Korjamo et al., 2006). On the other hand, glutathione transferases and cytosolic sulfotransferases are highly expressed in Caco-2 cells, and some, but not all, of them are strongly induced during cell differentiation (Peters and Roelofs, 1989; Meinl et al., 2008; Scharmach et al., 2009). Thorough characterization of the effects of cell differentiation on drug glucuronidation rates and the activities of individual UDP-glucuronosyltransferases (UGTs) in Caco-2 cells have not been undertaken yet.
UGTs are membrane enzymes of the endoplasmic reticulum that catalyze xenobiotic conjugation with glucuronic acid from UDP-glucuronic acid (UDPGA) (Wells et al., 2004). There are 19 different human UGTs, and they are divided into three subfamilies, 1A, 2A, and 2B (Mackenzie et al., 2005). Many UGTs can bind and glucuronidate multiple substrates, leading to partial overlaps in their substrate selectivity. However, individual enzymes differ from each other in the spectrum of substrates they can conjugate, in the kinetics of the different reactions they catalyze, in their stereoselectivity, and in their regioselectivity.
The UGTs substrates are often highly lipophilic compounds, like several steroids, and limited solubility may lower their apparent glucuronidation rates. The inclusion of a suitable organic solvent may be advantageous in assaying the glucuronidation of such compounds, provided its positive contribution through increased substrate availability to the enzyme is not surpassed by negative effects on the protein. Dimethyl sulfoxide (DMSO) has often been considered in this respect, and our previous results indicated that 10% DMSO is compatible with glucuronidation assays, at least in the case of androgens (Kuuranne et al., 2003). On the other hand, Uchaipichat et al. (2004) reported that 4-methylumbeliferone glucuronidation activity by UGT2B17 is highly sensitive even to low concentrations of DMSO. Although the differences may stem from differences in substrate or source of enzyme, it may be useful to reexamine the contribution of DMSO to glucuronidation activity assays, particularly when the substrate is very lipophilic.
The expression of individual UGTs in the human body is tissue specific, and there are clear differences in the mRNAs that encode different UGTs between the liver and the small intestine (Kaivosaari et al., 2007; Itäaho et al., 2009; Ohno and Nakajin, 2009). Previous studies on UGTs in Caco-2 cells often focused on UGT1A6 (Abid et al., 1995; Köhle et al., 2005) and rather old cells were used (passage numbers close to 100, e.g., Sabolovic et al., 2006 and references therein). We have recently demonstrated, however, that the state of the cells, mainly whether or not they have fully been differentiated, is very important for gene expression of most UGTs, with the exception of UGT1A6 (Siissalo et al., 2008). Nevertheless, determining the mRNA levels in the cells at passage numbers around 40 does not reveal how the activity of individual UGTs in them compares with, e.g., that of microsomes from the small intestine. Therefore, in the present study we have examined the effect of cell differentiation and of several assay conditions, on many different glucuronidation activities in Caco-2 cells. A battery of 13 substrates was selected for this study to examine the activity of most UGTs in the two Caco-2 cell types. Corresponding activities were determined in human microsomes from both the intestine (HIM) and the liver (HLM) to be able to clearly conclude whether or not the Caco-2 cells provide a good model for first-pass drug glucuronidation in the small intestine.
Materials and Methods
Materials.
The Caco-2 cells were obtained from American Type Culture Collection (Manassas, VA). Cell culturing reagents were purchased from Euroclone (Pero, Italy), except fetal bovine serum, which was from Invitrogen (Carlsbad, CA). The plastic wares for cell cultures were from Corning B.V. Life Sciences (Schiphol-Rijk, Netherlands). All of the test substrates for the glucuronidation assays and the UDPGA (triammonium salt) and alamethicin were bought from Sigma-Aldrich (St. Louis, MO). DMSO was from Riedel-de Haen (Seelze, Germany). Pooled human liver and intestinal (from duodenum and jejunum) microsomes and recombinant UGT2B15 were purchased from BD Biosciences (Franklin Lakes, NJ). Individual recombinant human UGTs, with the exception of UGT2B15, were produced in our laboratory using baculovirus-infected insect cells (Kurkela et al., 2007; Sneitz et al., 2009). The tetra-His antibodies that were used to determine the relative expression levels of individual recombinant UGTs that were expressed in our laboratory were purchased from QIAGEN (Hilden, Germany). All of the solvents were HPLC grade. Relative expression levels of the recombinant UGTs, with respect to the expression level of UGT1A10, were determined as described previously (Kurkela et al., 2007).
Preparation of Caco-2 Cell Homogenates.
Caco-2 cells were cultured as described previously (Siissalo et al., 2008). Mature undifferentiated (U) and differentiated (D) cells at passage 43 were washed with cold phosphate-buffered saline and harvested by scraping the attached cells off the flask or the filter membranes. Cell suspensions were combined and centrifuged at 3200g for 5 min at 4°C, suspended in small volume of cold water, divided into aliquots, and stored at −80°C. An attempt to prepare microsomes from the harvested Caco-2 cells led to a large loss of activities and mild sonication did not improve this (data not shown). Hence, because of the relatively limited availability of Caco-2 cells, the goal of studying many different activities and the high observed rates of 1-naphthol glucuronidation per milligram of protein in the cell homogenates (see below), we have used both undifferentiated and differentiated Caco-2 cell as homogenates throughout this study.
Glucuronidation Assays.
The glucuronidation assays were performed under several different conditions, but in all of them the enzyme samples were thawed on the day they were assayed, and the reactions were performed in a total volume of 100 μl, containing 50 mM sodium phosphate buffer, pH 7.4, 10 mM MgCl2, and 5 mM UDPGA (except in the “minus UDPGA” control samples).
The experiments to determine the effect of DMSO on estradiol glucuronidation by UGT1A1, UGT1A10, UGT2B7, UGT2B17, HIM, and HLM to DMSO contained 0.05 mg of protein/ml. When alamethicin was included, its concentration was 2.5 μg/ml (5% of the protein concentration). The corresponding assays with Caco-2 cell homogenates contained either 3.5 mg/ml (U) or 7 mg/ml (D) protein, whereas the 1-naphthol glucuronidation assays in Caco-2 cells contained 0.35 mg/ml protein of either U or D cell homogenates. When alamethicin was added to the Caco-2 cell homogenate assays, its concentration was 17.5 μg/ml. This is less than 5% of the protein concentration in these samples, but because the indicated protein concentrations for the Caco-2 cells are for cell homogenates, not isolated microsomes, we have selected this alamethicin amount. It should also be added that because of the relatively low activities with most substrates in the Caco-2 samples, the cell homogenates were not diluted and the reported protein concentrations represent the highest amount that could be added to the 100-μl incubation assays.
The glucuronidation of 13 test compounds (Fig. 1) was examined in U and D Caco-2 cell homogenates, as well as in HIM and HLM. The first round of assays was done under conditions that were found to be optimal for the Caco-2 samples (see below), and formation of glucuronides was analyzed by LC-MS. The incubations in this set of assays did not contain alamethicin, and they were done in the presence of either 10 or 1% DMSO (Table 1). The protein concentrations in this set of incubations were either 3.5 mg/ml (U) or 7 mg/ml (D) for the Caco-2 cell homogenates, except for the 1-naphthol glucuronidation assays where they were 0.35 mg/ml for both U and D cells. In the cases of HLM and HIM, the protein concentrations were 0.02 or 0.04 mg/ml, respectively.

Structures of the 13 substrates that were used in this study (glucuronidation occurs at the –OH or –NH group).
Glucuronidation assay conditions for individual substrates (LC-MS analyses)
Concentrations of the different substrates in the glucuronidation assays and the concentrations of DMSO that were used for the samples that were analyzed by LC-MS (see text and results in Table 3). In subsequent HPLC and UPLC assays, the substrate concentrations were as indicated here, whereas the DMSO concentrations were either as indicated here or 1% for all compounds. In addition, alamethicin was included in the assays with HIM and HLM (see text and results in Table 4).
In assays that were mainly analyzed by LC with UV absorbance or fluorescence detection, both under the same conditions as above (but with higher protein concentrations, as described below) and also for HIM and HLM in the presence of alamethicin (5% of the protein concentration) and 1% DMSO for all substrates. The protein concentrations in the experiments that were designed for the UV or fluorescence detection were the same as above for the Caco-2 samples, whereas for HLM and HIM they were 0.2 mg/ml in most cases but 0.4 and 0.8 mg/ml for the oxazepam glucuronidation assays, respectively.
In all the glucuronidation assays, proteins and substrate mixtures were prepared, with or without alamethicin and in the absence of UDPGA, and kept on ice for 30 min. The mixtures were subsequently preincubated at 37°C for 5 min, and the reactions were then initiated by the addition of UDPGA to a final concentration of 5 mM and mixing. The incubations were performed for 2 h at 37°C and were mostly terminated by the addition of 10 μl of 4 M perchloric acid. The trifluoperazine (TFP) glucuronidation reactions were terminated by the addition of 95 μl of cold methanol and 5 μl of glacial acetic acid, whereas the oxazepam glucuronidation reactions were terminated by the addition of 45 μl of acetonitrile and 5 μl of glacial acetic acid. After reaction stoppage and cooling on ice, the samples were centrifuged at 13,000 rpm for 15 min in a bench top centrifuge, and the supernatants were transferred to new tubes for glucuronides analyses.
LC-MS.
Formation of glucuronides in the U and D Caco-2 cells, as well as in HIM and HLM, was analyzed in two laboratories and with two analytical approaches that mainly differ in the detection method, MS or UV absorbance and/or fluorescence detection. The UPLC-MS analyses were performed using a BEH ShieldRP18 (2.1 × 50 mm, 1.7 μm; Waters, Milford, MA) column with an online filter. The mobile phase was 2 mM ammonium acetate-acetonitrile and was delivered at a flow rate of 0.5 ml/min, using a gradient of 5, 5, 50, and 90% acetonitrile at 0, 1, 4, and 5 min. The instrumental system consisted of an Acquity ultraperformance liquid chromatograph (Waters), Acquity photodiode array detector, and LCT Premier XE time-of-flight mass spectrometer (Waters, Manchester, UK). The compounds and glucuronides were detected in negative ionization mode (except trifluoperazine, which was detected at positive ionization mode) at mass range m/z 140 to 800, using capillary voltage of 2800 V and cone voltage of 40 V.
LC with UV or Fluorescence Detection.
The glucuronidation of 1-naphthol, estradiol, and R- and S-propranolol were detected by an 1100 series high-performance liquid chromatograph (Agilent Technologies, Waldbronn, Germany), ethinylestradiol glucuronidation was assayed using a Shimadzu high-performance liquid chromatograph (Kyoto, Japan), whereas diclofenac, epitestosterone, indomethacin, oxazepam, propofol, testosterone, trifluoperazine, and zidovudine (AZT) glucuronidation were measured using a Acquity ultraperformance liquid chromatograph. The columns and analytical methods for these assays are detailed in Table 2. Standard curves for quantification of glucuronides in the analyses were prepared using authentic glucuronides, when they were available (Table 2). In other cases, the parent compound (aglycone substrate) absorbance was used as a close approximation for the glucuronide absorbance when the detection was done by UV absorbance, whereas when fluorescence detection was used, standard curves were prepared separately using radiolabeled UDPGA as described previously (Itäaho et al., 2008).
Analytical methods used in this study for glucuronide detection and quantification
Results
Compounds.
The main objectives of this study were to determine the effect of cell differentiation on the glucuronidation activities in Caco-2 cells and to compare these activities with the corresponding activities in HIM and HLM. The collection of 13 substrates that were selected for this study (Fig. 1) was designed to reveal information on the activity of many individual UGTs, and care was taken to ensure that the majority of the compounds in this collection are not substrates for UGT1A6. For example, epitestosterone and AZT are markers for UGT2B7 (Court et al., 2003; Sten et al., 2009), ethinylestradiol is mainly for UGT1A1 (Soars et al., 2003), oxazepam is for UGT2B15 (S-oxazepam glucuronide) (Court et al., 2002), propofol is for UGT1A9 (and UGT1A10 to some extent) (Court, 2005; M. Kurkela and M. Finel, unpublished observation from our laboratory), testosterone is mainly for UGT2B17, and TFP is for UGT1A4 (Uchaipichat et al., 2006). The marker substrate for UGT1A6 was 1-naphthol, a compound that is also glucuronidated by many other UGTs, but at much lower rates than by UGT1A6.
Effects of DMSO and Alamethicin.
To be able to detect low activities in the different samples, we have tried to improve assay conditions and examined the effects of adding DMSO and alamethicin to the reaction mixtures. Estradiol was selected as the substrate for these experiments because of its hydrophobicity, the information we already had on its glucuronidation by the human UGTs (Itäaho et al., 2008), and its usefulness in detecting increased activity in differentiated Caco-2 cells (Siissalo et al., 2008). The effect of different DMSO concentrations on recombinant UGT1A1, 1A10, 2B7, and 2B17 was tested using two estradiol concentrations, 10 and 100 μM. These concentrations were selected because preliminary experiments indicated that in a reaction mixture that contains the membrane-bound UGTs there is no apparent difficulty in dissolving 10 μM estradiol, whereas a 100 μM concentration of this steroid is not well solubilized in the absence of a solvent such as DMSO (the reported experimental solubility of estradiol in pure water is in the range of 5 to 10 μM and the added membranes in the assays may slightly increase it). Indeed, the results revealed that DMSO addition, up to 10%, has only a marginal effect on the glucuronidation rate when the substrate concentration was 10 μM (Fig. 2, □), but when the estradiol concentration was 100 μM, the addition of DMSO up to 10% increased the glucuronidation rate (Fig. 2, ■). UGT1A1 and UGT1A10, which mainly conjugate estradiol at the 3-OH, exhibited the highest activity rates in the presence of 10% DMSO, whereas UGT2B7 and UGT2B17, which conjugate this steroid at the 17-OH, reached the optimum at 5% DMSO (Fig. 2). Of importance, no inhibition of UGT2B7 and UGT2B17 was observed at 10% DMSO, but increasing the DMSO concentration to 20% inhibited the activity significantly or even abolished it (Fig. 2).

Effect of different DMSO concentrations on the estradiol glucuronidation rate by recombinant human UGT1A1, 1A10, 2B7, and 2B17. Two estradiol concentrations, 10 μM (□) and 100 μM (■), were tested. The results are presented as means ± S.D. (n = 3) for either the formation of estradiol 3-glucuronide [UGT1A1 (A) and UGT1A10 (B)] or estradiol 17-glucuronide [UGT2B7 (C) and UGT2B17 (D)].
We have reported previously that addition of alamethicin does not activate recombinant UGTs (Kaivosaari et al., 2008), and similar results were obtained in preliminary experiments with several UGTs (data not shown). Nevertheless, because the assay conditions became an important issue in this study, we have examined the effect of alamethicin on the ethinylestradiol glucuronidation activity of recombinant UGT1A1. The results demonstrated that the presence of alamethicin had no effect on it at any DMSO concentration within the tested range (Fig. 3).

Effect of DMSO and alamethicin on the glucuronidation rate of ethinylestradiol, at a substrate concentration of 100 μM, by recombinant UGT1A1. When alamethicin was present, its concentration was 5% of the total protein concentration in the sample. Data are presented as means ± S.D. (n = 3).
The effects of DMSO and alamethicin on HIM and HLM were tested using a single estradiol concentration, 100 μM (Fig. 4). The results show that alamethicin strongly increased the glucuronidation activities in the microsomes from human liver and intestine, at least in the presence of up to 5% DMSO. Of interest, there appears to be a complex relationship between the presence of alamethicin and DMSO in HIM and HLM. The optimal DMSO concentration for estradiol glucuronidation in the presence of alamethicin was 1%, regardless of whether estradiol is conjugated on the 3-OH or the 17-OH. In the absence of alamethicin, however, the optimal DMSO concentration for HIM and HLM was 10% (Fig. 4).

Effects of DMSO and alamethicin on estradiol (100 μM) glucuronidation rate by HIM and HLM. When alamethicin was present, its concentration was 5% of the protein concentration in microsome sample. Data are presented as means ± S.D. (n = 3). A, HIM, estradiol 3-glucuronide (G). B, HLM, estradiol 3-glucuronide. C, HLM, estradiol 17-glucuronide.
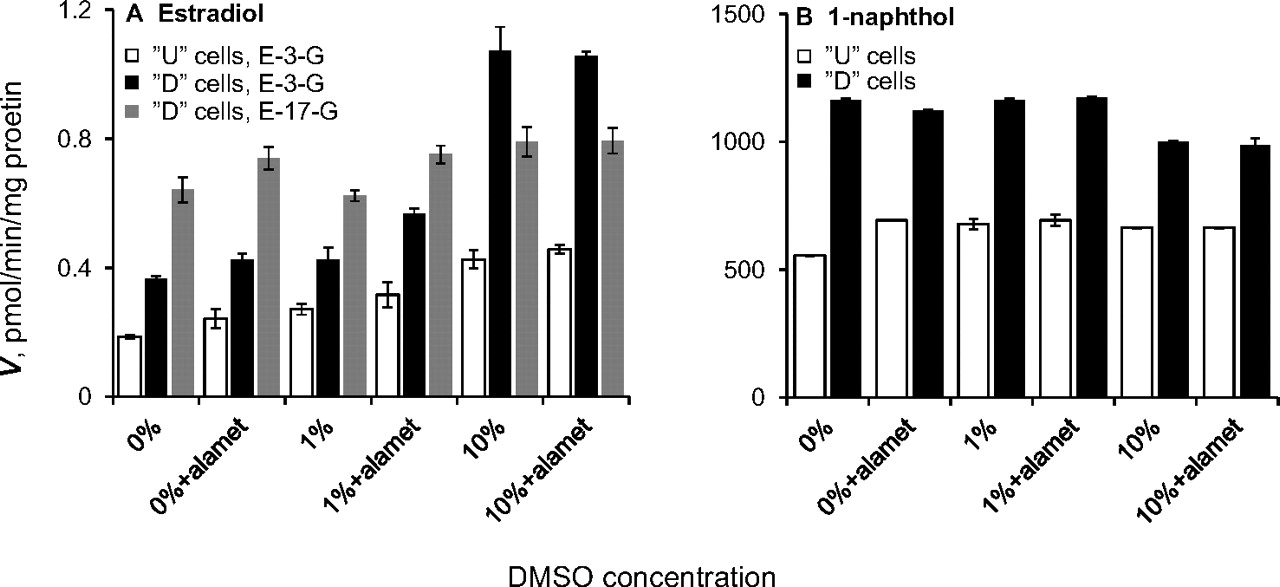
The effects of DMSO and alamethicin on estradiol glucuronidation by the U and D Caco-2 cell homogenates were tested using 100 μM substrate and either 1 or 10% DMSO (Fig. 5A). The results demonstrate that alamethicin has a low and barely significant stimulatory effect on the estradiol glucuronidation activity in Caco-2 cells in the absence of DMSO or in the presence of 1% solvent, and no effect at all in the presence of 10% DMSO (Fig. 5A). The results also reveal that in the presence of 10% DMSO, the glucuronidation rates of estradiol at the 3-OH is considerably higher than at 0 or 1% DMSO, whereas the glucuronidation of estradiol at the 17-OH by the D cells (the corresponding activity in the U cells was very low under all tested conditions) was similar to the rate at low DMSO concentrations (Fig. 5A). We also tested the effects of DMSO and alamethicin on the glucuronidation rates of 1-naphthol in the U and D Caco-2 cells, an activity that is relatively high in both cell types (Siissalo et al., 2008). The results indicated that alamethicin does not significantly stimulate 1-naphthol glucuronidation activity in the Caco-2 cell homogenates, whereas the presence of 10% DMSO slightly lowers the glucuronidation rate of 1-naphthol in the differentiated Caco-2 cells (Fig. 5B).

Effects of DMSO and alamethicin on estradiol (A) and 1-naphthol (B) (both at a 100 μM substrate concentration) glucuronidation rate by U and D Caco-2 cells. The concentration of alamethicin (alamet), when present, was 17.5 μg/ml. Data are presented as means ± S.D. (n = 3). E, estradiol; G, glucuronide.
Glucuronidation Analyses by LC-MS.
To take into account the variable results on the effects of DMSO and alamethicin on the glucuronidation rates in the different samples and to keep the conditions similar for all the samples when the glucuronidation rates of the 13 compounds were compared, we performed the first analyses for the U and D Caco-2 cell homogenates, HLM, and HIM under the conditions that appeared best for the Caco-2 cells, namely in the presence of 1 or 10% DMSO and without alamethicin (Table 1). This large set of samples was analyzed by LC-MS, and the results are presented in Table 3.
LC-MS analysis of glucuronidation patterns in undifferentiated and differentiated Caco-2 cells, HIM, and HLM
See Table 1 for the substrate and DMSO concentrations in each case. The analyses were done by UPLC-MS, and the values are means ± S.D. (n = 3). Note that the type of values and rates for different substrates should not be compared with each other in this table except between different samples glucuronidating the same substrate.
Glucuronidation Analyses by LC with UV Absorbance or Fluorescence Detection.
The LC-MS results (Table 3) provide a good comparison of the glucuronidation rates for the test substrates among the different enzyme sources. However, in the absence of suitable glucuronide standards for quantification, they do not yield the actual activity rates. To get more quantitative rates, we turned to LC with either UV absorbance or fluorescence detection (see Materials and Methods and Table 2). It must be noted here that use of the aglycone substrate for generating the standard curve that is used to quantify the glucuronides may also be biased because the glucuronidation may change the absorbance of the compound. However, the change is mostly small, and this approach is, thus, useful for getting close estimates of the glucuronidation rates if the corresponding glucuronides are not available.
The incubations with HIM and HLM for this set of analyses were performed both under the same conditions as for the LC-MS assays (above) and under more optimal conditions for HIM and HLM in the presence of alamethicin and 1% DMSO for all substrates. The results for HIM and HLM from this set of analyses are presented in Table 4, and the corresponding rates in the U and D Caco-2 cell homogenates are given in Table 5.
Glucuronidation rates of HIM and HLM toward the 13 test compounds under two different incubation conditions
The analyses were performed with HPLC or UPLC with UV or fluorescence detections (Table 2). Two different reaction conditions were used: one in the presence of 1 or 10% DMSO (see Table 1 for the DMSO concentration in each case) and without alamethicin (see legend to Table 3) and the other in the presence of alamethicin and 1% DMSO (see Materials and Methods for further details). Values represent means ± S.D. (n = 3).
Inspection of the different results reveals that there is good consistency between the data in Table 3, obtained by LC-MS, and that in Tables 4 and 5, obtained using different LC systems in combination with UV absorbance or fluorescence detection. Regarding the effect of cell differentiation on the glucuronidation rates in Caco-2 cells, the results are in good agreement with the effect of differentiation on the expression level of individual UGTs in Caco-2 cells (Siissalo et al., 2008). However, the current study adds a new layer onto the gene expression results, a broad comparison of glucuronidation activities between Caco-2 cells and microsomes from the human intestine and liver. The outcome is, unfortunately, that even differentiated Caco-2 cells do not provide a good in vitro system to estimate drug glucuronidation in the intestine. The only possible exception to the latter rule is substrates that are solely or predominantly glucuronidated by UGT1A6.
Discussion
In this study our aim was to get a broader view of glucuronidation activities in Caco-2 cells to answer two questions. The first is how glucuronidation activities in these cells are affected by cell differentiation and how they are reflected in the large effect of cell differentiation on the expression level of most, but not all, UGTs in these cells (Siissalo et al., 2008). The second question is whether Caco-2 cells, either undifferentiated or differentiated, provide a good model to study first-pass glucuronidation in the small intestine.
The results reveal that although no clear effect of DMSO was observed when the substrate (estradiol) concentration was 10 μM and probably not limited by solubilization, there was a significant increase in the glucuronidation rate by DMSO when the estradiol concentration was 100 μM (Fig. 2). The results also suggest that individual UGTs, such as UGT1A1 and UGT2B7, may be affected differently by high DMSO concentrations (Fig. 2). However, more systematic study on this issue is needed to clarify the reasons for this difference.
Alamethicin raises the apparent glucuronidation activity in HLM (Fisher et al., 2000), but we have earlier noted that it has no significant effect on the glucuronidation rate by recombinant UGTs (Kaivosaari et al., 2008). Nevertheless, we have reexamined this issue, particularly whether or not the presence of DMSO changes the alamethicin effect (or lack of it) on recombinant enzymes, using UGT1A1 as the enzyme and ethinylestradiol as the substrate. The results indicate that although the glucuronidation rate of ethinylestradiol by recombinant UGT1A1 was increased by raising the DMSO concentration up to 10%, alamethicin exerted no significant effect on the ethinylestradiol glucuronidation rate, regardless of the DMSO concentration (Fig. 3). In the case of HLM and HIM, on the other hand, alamethicin had a strong stimulatory effect on estradiol glucuronidation rates (Fig. 4). However, high DMSO concentrations appear to attenuate the stimulatory effect of alamethicin in HLM (Fig. 4), perhaps due to extraction of alamethicin from the membrane or interference with the assembly of membrane-“puncturing” pores by this peptide. On the other hand, in the absence of alamethicin, 10% DMSO increases estradiol glucuronidation at both the 3-OH and the 17-OH (Fig. 4).
The effect of alamethicin and DMSO on the glucuronidation rates of estradiol and 1-naphthol in U and D Caco-2 cells were also examined (Fig. 5). The results reveal no significant effect of alamethicin, and, in the case of the more water-soluble substrate, 1-naphthol, almost no effect of DMSO either, except for a small inhibition at the highest solvent concentration. In contrast, the presence of 10% DMSO clearly improved estradiol glucuronidation rate, particularly at the 3-OH (Fig. 5A). The latter observation is in line with the results suggesting that UGT1A1 and UGT1A10, the main contributors to the formation of estradiol 3-glucuronide (together with UGT1A8 that was not examined separately here), are more affected by, or more resistant to, 10% DMSO than UGT2B7 and UGT2B17 that mainly contribute to estradiol 17 glucuronide formation (Itäaho et al., 2008).
It may be noted here that direct comparison of glucuronidation rates per milligram of protein could not be easily done because the HLM and HIM samples were isolated microsomes, whereas the Caco-2 samples were cell homogenates. This means that both Caco-2 samples, U and D, carried a considerable amount of additional cytoplasmic and nuclear proteins. Nevertheless, the high rates of 1-naphthol glucuronidation by both type of Caco-2 cells, even the undifferentiated ones, were similar to or higher than the corresponding rates in HIM (Tables 3⇑–5), indicating that conclusions about the similarity, or lack of it, in drug glucuronidation patterns between Caco-2 cells and the human small intestine can be drawn with confidence, even when this difference in the protein composition of the samples is taken into account. It may also be added that the latter difference between the samples caused difficulties when one is trying to decide on the amount of alamethicin that should be added to the Caco-2 cell homogenates. However, one may expect that if alamethicin improves glucuronidation in such sample, a clear effect will be observed also when its concentration is not optimal. Because we have not detected such a stimulatory effect (Fig. 5), we saw no point, in the context of the current study, in carrying out a large titration of the limited amount of samples with that highly lipophilic peptide.
The observed differences in optimal assay conditions between Caco-2 cells and HLM and HIM strongly suggested that multiple activity tests under variable conditions should be conducted if one wants to ascertain that suboptimal conditions do not lead to mistaken conclusions. These were performed, and the results of activity assays toward the collection of 13 test compounds are summarized in Tables 3 to 5 and provide the answer to the question of whether or not cell differentiation makes Caco-2 cells a good model system to study first-pass glucuronidation in the small intestine. The answer is clearly negative. Although many glucuronidation activities in Caco-2 cells are increased by cell differentiation, those in neither U nor D Caco-2 cells resemble the corresponding activities in HIM or in HLM (Tables 3⇑–5). The glucuronidation rates in Caco-2 cells for most of the substrates are 2 or 3 orders of magnitude lower than in HIM (or HLM). The only exception to this rule is the rates of 1-naphthol glucuronidation (Table 3). The obvious reason for the high rate of 1-naphthol glucuronidation rates in Caco-2 cells and the relatively low degree of change in this activity by cell differentiation is the high expression level of UGT1A6, the enzyme that is mainly responsible for 1-naphthol glucuronidation, in both undifferentiated and differentiated Caco-2 cells (Siissalo et al., 2008).
The speeding up of several other activities in Caco-2 cells during cell differentiation, for example, the glucuronidation rates of estradiol at both the 3-OH and 17-OH, ethinylestradiol, propofol, and, particularly testosterone and epitestosterone, is in agreement with the effect of cell differentiation on the expression level of most UGTs, including 1A1, 1A9, 1A10, 2B7, and 2B17 that mainly contribute to these activities (Table 3). However, the rates of these improved activities in Caco-2 D cells are so much lower than those in HIM and HLM that the amount of active UGT enzymes in Caco-2 cells, with the exception of UGT1A6, must be much lower than that in either HIM or HLM. This conclusion could not have been reached from analyses of mRNA levels, simply because they could not be compared between Caco-2 and HIM and HLM, which are subcellular fractions and lack mRNA.
In summary, in this study we have shown that high DMSO concentrations, up to 10%, during incubation with recombinant UGTs do not necessarily inhibit these enzymes. This finding opens the possibility of improving the accessibility of highly hydrophobic compounds by adding DMSO to the reaction mixture. However, this treatment should be tested in each case, particularly when human microsomes are examined. On the other hand, alamethicin should be added to glucuronidation assays using human microsomes, but in the case of recombinant UGTs, its addition may just lead to an unnecessary complication of the assays and waste of resources. The results clearly show that although differentiation has a relatively large stimulatory effect on many glucuronidation activities in Caco-2 cells, with the exception of UGT1A6-catalyzed reactions, these activities fall far short of the corresponding activities in HIM and HLM. It is thus concluded that Caco-2 cells do not provide a good model system to assess first-pass drug glucuronidation in the intestine, particularly when several UGTs, not merely UGT1A6, are involved in the glucuronidation of the tested compounds.
Authorship Contributions
Participated in research design: Zhang, Hirvonen, and Finel.
Conducted experiments: Zhang, Tolonen, and Rousu.
Contributed new reagents or analytic tools: Tolonen.
Performed data analysis: Zhang and Tolonen.
Wrote or contributed to the writing of the manuscript: Zhang, Tolonen, Hirvonen, and Finel.
Acknowledgments
We thank Dr. Sanna Siissalo for help and advice with Caco-2 cell culturing and Johanna Mosorin for assistance with the expression of recombinant UGTs.
Footnotes
This study was supported by the European Union FP6 program [LIINTOP LSH-2005-1.2.3-4]; the Sigrid Juselius Foundation, Finland; and the University of Helsinki (personal stipend to H.Z.).
Article, publication date, and citation information can be found at http://dmd.aspetjournals.org.
doi:10.1124/dmd.110.036582.
-
ABBREVIATIONS:
- Caco-2
- a human intestinal cell line derived from colonic adenocarcinoma
- UGT
- UDP-glucuronosyltransferase
- UDPGA
- UDP-glucuronic acid
- DMSO
- dimethyl sulfoxide
- HIM
- human intestinal microsomes
- HLM
- human liver microsomes
- HPLC
- high-performance liquid chromatography
- U
- undifferentiated
- D
- differentiated
- LC
- liquid chromatography
- MS
- mass spectrometry
- TFP
- trifluoperazine
- UPLC
- ultraperformance liquid chromatography
- AZT
- zidovudine.
- Received October 1, 2010.
- Accepted November 23, 2010.
- Copyright © 2011 by The American Society for Pharmacology and Experimental Therapeutics


