


Abstract
In addition to primary human hepatocytes, hepatoma cell lines, and transfected nonhepatoma, hepatic cell lines have been used for pharmacological and toxicological studies. However, a systematic evaluation and a general report of the gene expression spectra of drug-metabolizing enzymes and transporters (DMETs) in these in vitro systems are not currently available. To fill this information gap and to provide references for future studies, we systematically characterized the basal gene expression profiles of 251 drug-metabolizing enzymes in untreated primary human hepatocytes from six donors, four commonly used hepatoma cell lines (HepG2, Huh7, SK-Hep-1, and Hep3B), and one transfected human liver epithelial cell line. A large variation in DMET expression spectra was observed between hepatic cell lines and primary hepatocytes, with the complete absence or much lower abundance of certain DMETs in hepatic cell lines. Furthermore, the basal DMET expression spectra of five hepatic cell lines are summarized, providing references for researchers to choose carefully appropriate in vitro models for their studies of drug metabolism and toxicity, especially for studies with drugs in which toxicities are mediated through the formation of reactive metabolites.
Introduction
Drug-metabolizing enzymes and transporters (DMETs) are broadly categorized into three groups: phase I, phase II, and phase III, according to their functional role in the metabolism process. Phase I enzymes usually catalyze oxidation, reduction, hydrolysis, cyclization, and decyclization reactions. The cytochrome P450 (P450) enzyme superfamily, for example, plays a dominant role in phase I biotransformation. Phase II metabolizing enzymes are involved in conjugation reactions that attach an ionized group (such as glutathione, sulfate, or glucuronic acid) to the drug, resulting in more water-soluble metabolites. Located in the membrane of epithelial and endothelial cells of the liver and other organs, phase III enzymes are membrane transporters that pump drugs across cellular barriers, thus having a huge impact on a drug's therapeutic efficacy by influencing its absorption, distribution, and elimination.
To better understand drug metabolic pathways, drug efficacies or toxicities, and drug-drug interactions, the establishment of a reliable research model system remains a key challenge. During past decades, several in vitro models have been developed and used, including isolated (recombinant) enzymes, human liver microsomes, human liver cytosolic fractions, human cell lines, human primary hepatocytes, human liver slices, and isolated perfused livers (Huang et al., 2008). In general, the advantage of these models is a reduced complexity of the study system. However, low expression levels of drug-metabolizing enzymes and the lack of cofactor-providing cells, e.g., Kupffer cells (for review, see Brandon et al., 2003) are among the disadvantages for these various models.
Primary human hepatocytes and hepatoma cell lines such as HepG2 are among the most widely used in vitro models in pharmacological and toxicological studies. Primary human hepatocytes remain differentiated and sustain the major drug-metabolizing enzyme activities for a relatively long period of time in culture; they represent a unique in vitro system and serve as a “gold standard” for studies of drug metabolism and toxicity (LeCluyse, 2001). However, primary human hepatocytes have high variability, short life spans, and limited availability. On the other hand, HepG2 hepatoma cells are relatively easy to maintain in culture and are widely used for toxicity studies. Despite the low activities of certain drug-metabolizing enzymes, such as CYP3A4, CYP2A6, CYP2C9, and CYP2C19, in comparison with primary human hepatocytes (Westerink and Schoonen, 2007), the HepG2 cell line has been considered a valuable model and is used for risk assessment of toxicants and toxins because it retains several liver functions (Dykens et al., 2008; Rudzok et al., 2010). In addition, other human hepatoma cell lines, such as Huh7, SK-Hep-1, Hep3B, and HepaRG have also been used in drug metabolism and toxicity studies (Henzel et al., 2004; Knasmüller et al., 2004; Shiizaki et al., 2005; Aninat et al., 2006; Suzuki et al., 2008; Chao et al., 2009; Wee et al., 2009). Olsavsky et al. (2007) compared global gene expression profiles of HepG2, Huh7, human primary hepatocytes, and human liver slices. Hart et al. (2010) recently compared whole-genome gene expression profiles of HepaRG cells and HepG2 cells with that of primary human hepatocytes and demonstrated that many DMETs are expressed at a level in HepaRG cells comparable to that in HepG2 cells in comparison with primary human hepatocytes. To overcome the disadvantages of a short life span and limited availability of primary human hepatocytes, immortalized “normal” human liver epithelial cell lines were established by introduction of the simian virus 40 large T antigen gene. Transfected human liver epithelial (THLE) cells have expression profiles of phase I and phase II enzymes similar to those of human primary hepatocytes (Pfeifer et al., 1993).
Although various hepatocyte-derived in vitro-grown cell systems have been established, a systematic evaluation and a general report of gene expression spectra of drug-metabolizing genes in these systems are not currently available. In the current study, we systematically characterized gene expression profiles of phase I, phase II, and phase III enzymes in primary human hepatocytes, commonly used hepatoma cell lines (HepG2, Huh7, SK-Hep-1, and Hep3B), and THLE2 cells using the human drug metabolism RT2 Profiler PCR Array (SABiosciences, Frederick, MD), a real-time PCR based assay with the ability to detect expression levels of 251 drug-metabolizing genes simultaneously.
Materials and Methods
Cell Culture.
The human liver cell line THLE2, which was derived from primary normal liver epithelial cells, was purchased from the American Type Culture Collection (Manassas, VA). THLE2 cells were cultured in LHC-8 medium (Invitrogen, Carlsbad, CA) supplemented with 70 ng/ml phosphoethanolamine, 5 ng/ml epidermal growth factor, 10% fetal bovine serum (Atlanta Biologicals, Lawrenceville, GA), and the antibiotics penicillin (50 U/ml), and streptomycin (50 μg/ml) (Sigma-Aldrich, St. Louis, MO). Human hepatoma cell lines HepG2, Hep3B, Huh7, and SK-Hep-1 (American Type Culture Collection) were cultured in Dulbecco's modified Eagle's medium (Sigma-Aldrich) supplemented with 10% fetal bovine serum, 2 mM l-glutamine, 50 U/ml penicillin, and 50 μg/ml streptomycin. The passage number was less than 10 for all experiments performed in each cell type. Cells were seeded onto 60 × 15-mm cell culture dishes at a cell density of 5 × 10⁵ in 5 ml of culture media and were maintained at 37°C in a humidified atmosphere with 5% CO2 until they were 70 to 80% confluent (cell confluence was evaluated by visual observation using an optical microscope).
Human primary hepatocytes from anonymous donors were obtained through the Liver Tissue Cell Distribution System (Pittsburgh, PA). Donor information is listed in Supplemental Table 1. Hepatocytes were isolated by a three-step collagenase perfusion as described previously (Strom et al., 1996). Upon arrival, the shipping medium was removed and replaced with serum-free hepatocyte maintenance medium supplemented with insulin and GA-1000 using HMM SingleQuots (Lonza Walkersville, Inc., Walkersville, MD). Primary hepatocytes were plated on collagen in T-25 flasks containing approximately 106 cells. The cultured hepatocytes were incubated at 37°C in a humidified atmosphere of 5% CO2 for at least 12 h before harvesting. This project was approved by the Research Involving Human Subjects Committee of the U.S. Food and Drug Administration.
RNA Isolation.
Total RNA from hepatocytes or cell lines was isolated using an RNeasy system (QIAGEN, Valencia, CA). The yield of the extracted RNA was determined spectrophotometrically by measuring the optical density at 260 nm. The purity and quality of RNA were evaluated using an RNA 6000 LabChip on an 2100 Bioanalyzer (Agilent Technologies, Santa Clara, CA). High-quality RNA with RNA integrity numbers greater than 9.0 were used for the study.
Human Drug Metabolism RT2 Profiler PCR Array.
First Strand cDNA Synthesis Kits and human drug metabolism RT2 Profiler PCR arrays were obtained from SABiosciences. The human drug metabolism RT2 Profiler PCR array contains a total of 251 drug metabolism genes and 5 endogenous control genes.
Real-Time Reverse Transcriptase-PCR.
For first-strand cDNA synthesis, 1 μg of total RNA was reverse-transcribed in a final volume of 20 μl of with random primers at 37°C for 60 min according to the manufacturer's instructions (SABiosciences). In brief, reverse transcriptase was inactivated by heating at 95°C for 5 min. The cDNA was diluted to 100 μl by adding RNase free water and stored at −20°C. The PCR was performed using an ABI 7900 instrument (Applied Biosystems, Foster City, CA). For one 96-well plate of the PCR array, 2450 μl of PCR Master Mix containing 1× PCR Master Mix and 98 μl of diluted cDNA was prepared, and an aliquot of 25 μl was added to each well. Three technical replicates were run for each RNA sample.
Data Normalization and Analysis.
Endogenous control genes, glyceraldehyde-3-phosphate dehydrogenase (GAPDH), and β-actin (ACTB) present on the PCR array were used for normalization. Each cycle threshold (Ct) was normalized to the average Ct of the two endogenous controls. The comparative ΔCt method was used to calculate relative quantification of gene expression.
Sensitivity Detection and Identification of Differentially Expressed Genes.
PCR array quantification was based on the Ct number. A gene was considered not detectable when Ct >32. A list of differentially expressed genes was identified using a two-tailed t test. The criteria were p < 0.05 and a mean difference ≥2-fold. The statistical calculations were based on ΔCt values.
Results
In the current study, 251 DMETs including phase I (84 genes), phase II (83 genes), and phase III genes (84 genes) (Supplemental Table 2) were systematically assessed at the mRNA level in five hepatic cell lines, primary hepatocytes from six donors, and pooled RNA samples of all six donors using real-time PCR array-based technology. Each RNA sample was run in triplicate; therefore, a total of 36 expression profiles were generated for this study (detailed original data are listed in Supplemental Table 3). DMETs from each cell line were evaluated in comparison with DMET expression levels of pooled primary hepatocytes from six donors.
Abundance of DMETs in Primary Hepatocytes and Relative Abundance of DMETs Expressed in Hepatic Cell Lines Compared with That in Primary Hepatocytes.
Gene expression profiles of primary hepatocytes obtained from six donors (for confidentiality reasons, limited/deidentified donor information only is listed in Supplemental Table 1) were analyzed by reverse-transcriptase-PCR. A gene was considered not detectable when Ct >32. Using this criterion, 69 of 84 phase I genes, 73 of 83 phase II genes, and 78 of 84 phase III genes were detected in RNA preparations from primary hepatocytes. With the use of DMET expression levels measured in a pool of primary hepatocytes as references, the relative abundance of each DMET detected in each hepatic cell line was calculated. In Table 1, the relative abundance (indicating relative expression levels) of phase I enzymes for 5 hepatic cell lines, HepG2, THLE2, Hep3B, SK-Hep-1, and Huh7 is listed. In contrast with 69 of 84 phase I genes that were expressed in pooled primary hepatocytes, a smaller number of phase I genes were detected in each cell line, with total numbers of 44, 37, 49, 34, and 57 genes in HepG2, THLE2, Hep3B, SK-Hep-1, and Huh7 cell lines, respectively. A striking finding was that several critical phase I DMETs, such as CYP3A4, CYP2C9, CYP2C18, and CYP2C19, were not detected in any of the cell lines. Among the expressed genes, some were barely detectable with a relative abundance of less than 5% of those in primary hepatocytes. CYP2D6, one of key phase I enzymes in HepG2 cells, falls into this category. The abundance for the majority of expressed genes in all cell lines was at a modest level (6–29%) or at a similar level (31–300%), compared with that of their counterparts in primary hepatocytes. In addition, a few genes have much higher abundance (∼3–243 times higher) in cell lines than in primary hepatocytes. For example, DHRS2 was expressed more than 200 times higher in HepG2 cells than in primary hepatocytes, whereas CYP2W1 was expressed more than 150 times higher in HepG2 than in primary hepatocytes. Of note, although not detected in primary hepatocytes, several genes were found to be expressed in different cell lines, such us CYP19A1 in HepG2, Hep3B, and Huh7, making these cell lines potential surrogate tools for investigation of related DMETs. Likewise, the relative abundance for phase II and phase III DMETs is listed for different hepatic cell lines compared with that in primary hepatocytes in Table 1.
Relative abundance of drug-metabolizing genes expressed in hepatic cell lines and primary hepatocytes
Relative abundance was calculated based on eq. 3:

The approximate abundance of DMETs expressed in pooled primary hepatocytes is listed as “Expression Value” in Table 1, using housekeeping genes GAPDH and ACTB as references. The expression value in primary hepatocytes of each DMET was defined by using eqs. 1 and 2:


The Expression Value implies the relative mRNA expression abundance of a DMET gene, arbitrarily assuming an average expression level of the two housekeeping genes GAPDH and ACTB being 10,000 copies. For example, if the average expression value of GAPDH and ACTB in human primary hepatocytes is 10,000 copies, the expression values of CYP3A4 (phase I), SULT1A1 (phase II), and ABCB1 (phase III) should be 115,260 and 2388 copies, respectively (Table 1). This table is intended to provide very general information about the expression of DMETs in human primary hepatocytes, in which the large interindividual variability of DMET expression levels in human populations is certainly underrepresented.
Similarities and Discrepancies between Primary Hepatocytes and Hepatic Cell Lines.
Similarities and differences in DMET expression patterns among hepatic cell lines and primary hepatocytes are pronounced as indicated by the relative abundance of drug-metabolizing genes in different cells. To reveal similarities of DMET expression patterns among these cells, a similarity matrix was evaluated by a pairwise comparison of the samples (Table 2), in which the Pearson's correlation coefficient (r) was calculated based on the averaged ΔCt obtained for each gene. The numbers in Table 2 are the Pearson's correlation coefficient values that represent the strengths of the linear relationship between any two sets of comparative components (a greater number indicates higher similarity). In general, similarities among primary hepatocytes isolated from different donors (with r values between 0.930 and 0.993) were much higher than the similarities among different hepatic cell lines (with r values between 0.707 and 0.893). Among these five hepatic cell lines, the highest r value of 0.893 was observed between THLE2 and SK-Hep-1, whereas the lowest r value of 0.707 was found between SK-Hep-1 and Huh7. Of more importance, the similarities between any hepatic cell line and the pooled primary hepatocytes were very low, with r values between 0.473 and 0.710. The highest similarity (r = 0.710) was observed between Huh7 cells and the pooled primary hepatocytes, whereas the lowest similarity (r = 0.473) was observed between SK-Hep-1 cells and the pooled primary hepatocytes. Of note, in terms of DMET expression levels, the most often used hepatic cell line HepG2 was quite different from the pooled primary hepatocytes with an r value of 0.600.
Pearson's correlation coefficient between hepatic cell lines and primary hepatocytes
The correlation matrix was calculated based on the averaged ΔCt of three technical replicates. The numbers represent the pairwise Pearson's correlation coefficient r value.
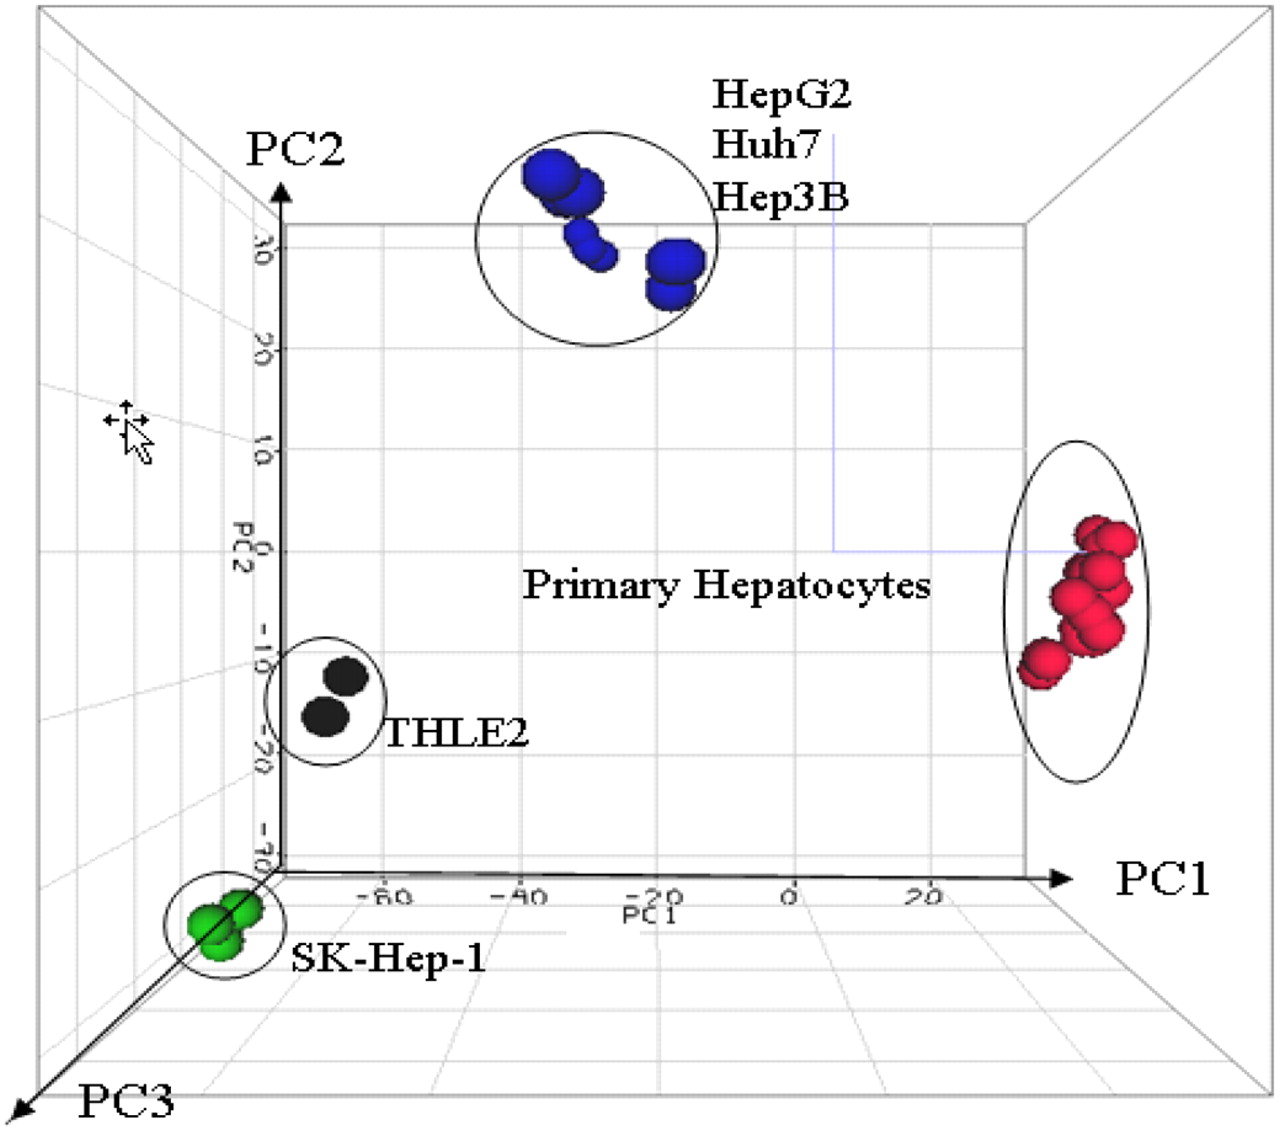
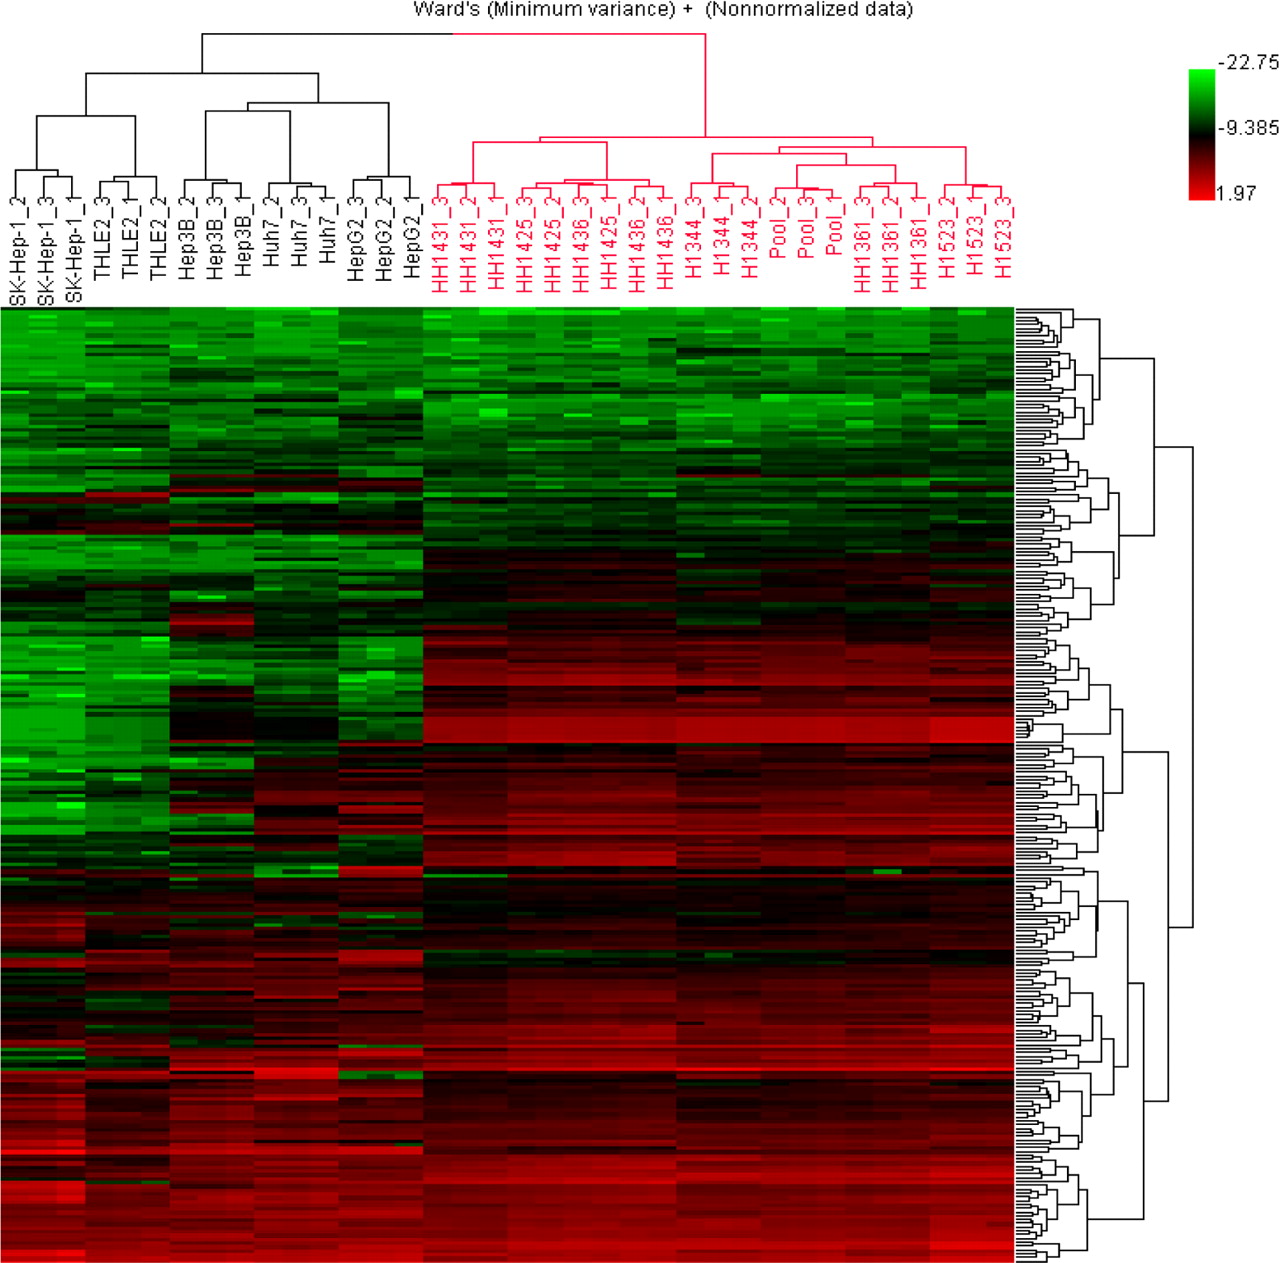
Similarities and discrepancies in DMET expression levels between primary hepatocytes and hepatic cell lines were further illustrated by principal component analysis (PCA). Figure 1 displays a PCA three-dimensional view using the first three principal components (PC1, PC2, and PC3) to illustrate the similarities and discrepancies of DMET expression profiles among five hepatic cell lines and primary hepatocytes from six individual donors. PC1 divided primary hepatocytes and hepatic cell lines into four groups and explained approximately 65% of total variation among them. Taken together, PC1 (65%), PC2 (12%), and PC3 (6%) explained 83% of total variation in the expression patterns of these cells. The results of the PCA indicate that these five hepatic cell lines and primary hepatocytes from six different donors formed four distinct patterns in DMET expression profiles. Furthermore, to visualize directly the distances of gene expression patterns among different hepatic cell lines and primary hepatocytes, hierarchical cluster analysis was performed. Figure 2 shows a dendrogram of 12 groups of the triplicate samples based on their DMET expression levels. Two big clusters were clearly separated; one consisted of five hepatic cell lines (black) and the other consisted of primary human hepatocytes (red). Within the two large clusters, the five hepatic cell lines showed higher variability than did the primary hepatocytes, consistent with Table 2. Triplicate results of each sample were clustered tightly together with the lowest distances, indicating good reproducibility of real-time PCR assays.

PCA of gene expression profiles generated from five hepatic cell lines and primary hepatocytes from six donors. For the 251 drug-metabolizing genes and transporter genes, the relative contribution of the variance is shown by three major principal components plotted in three dimensions.

Hierarchical clustering analysis of gene expression for five hepatic cell lines (black brackets) and primary human hepatocytes from six donors (red brackets). The clustering was based on the normalized ΔCt values of 251 drug-metabolizing enzyme genes and transporter genes. This analysis approach is an intuitive way to display the many different possible combinations of differently expressed genes. The clear separation of the two big clusters of samples, primary hepatocytes colored in red and hepatic cell lines colored in black, is primarily determined by the distinctive expression profiles among some DMETs that are highly expressed in primary hepatocytes but dramatically down-regulated in hepatic cell lines. Within each cluster of samples, the expression profiles among hepatic cell lines or among individual hepatocyte donors are variable, with a higher variability among the five hepatic cell lines in comparison to the variability among the primary hepatocyte from the six different donors. This figure also shows that the reproducibility of real-time PCR assays for the triplicate results of the same sample is quite high compared with sample-to-sample variabilities.
Interindividual Variability in DMET Expression Profiles of Primary Hepatocytes from Different Donors.
Interindividual variation of DMET expression is one of the most important contributors to the variability of the drug therapy, adverse drug reactions, and drug interactions. To evaluate the interindividual variation of DMET expression profiles of primary hepatocytes from different donors, the mean, S.D., and coefficient of variation (CV) for each DMET was calculated. The 15 expressed DMETs with the highest CVs in each category (phase I, phase II, or phase III) are plotted in Fig. 3, A, B, and C, respectively; each dot indicates a mean value of ΔCt for the gene and the bar displays a corresponding S.D. across the six donors. CYP3A4, CYP3A7, CYP1A1, CYP1A2, and CYP2C9 were among the most variably expressed phase I enzymes, indicating their remarkable expression variability (Fig. 3A).
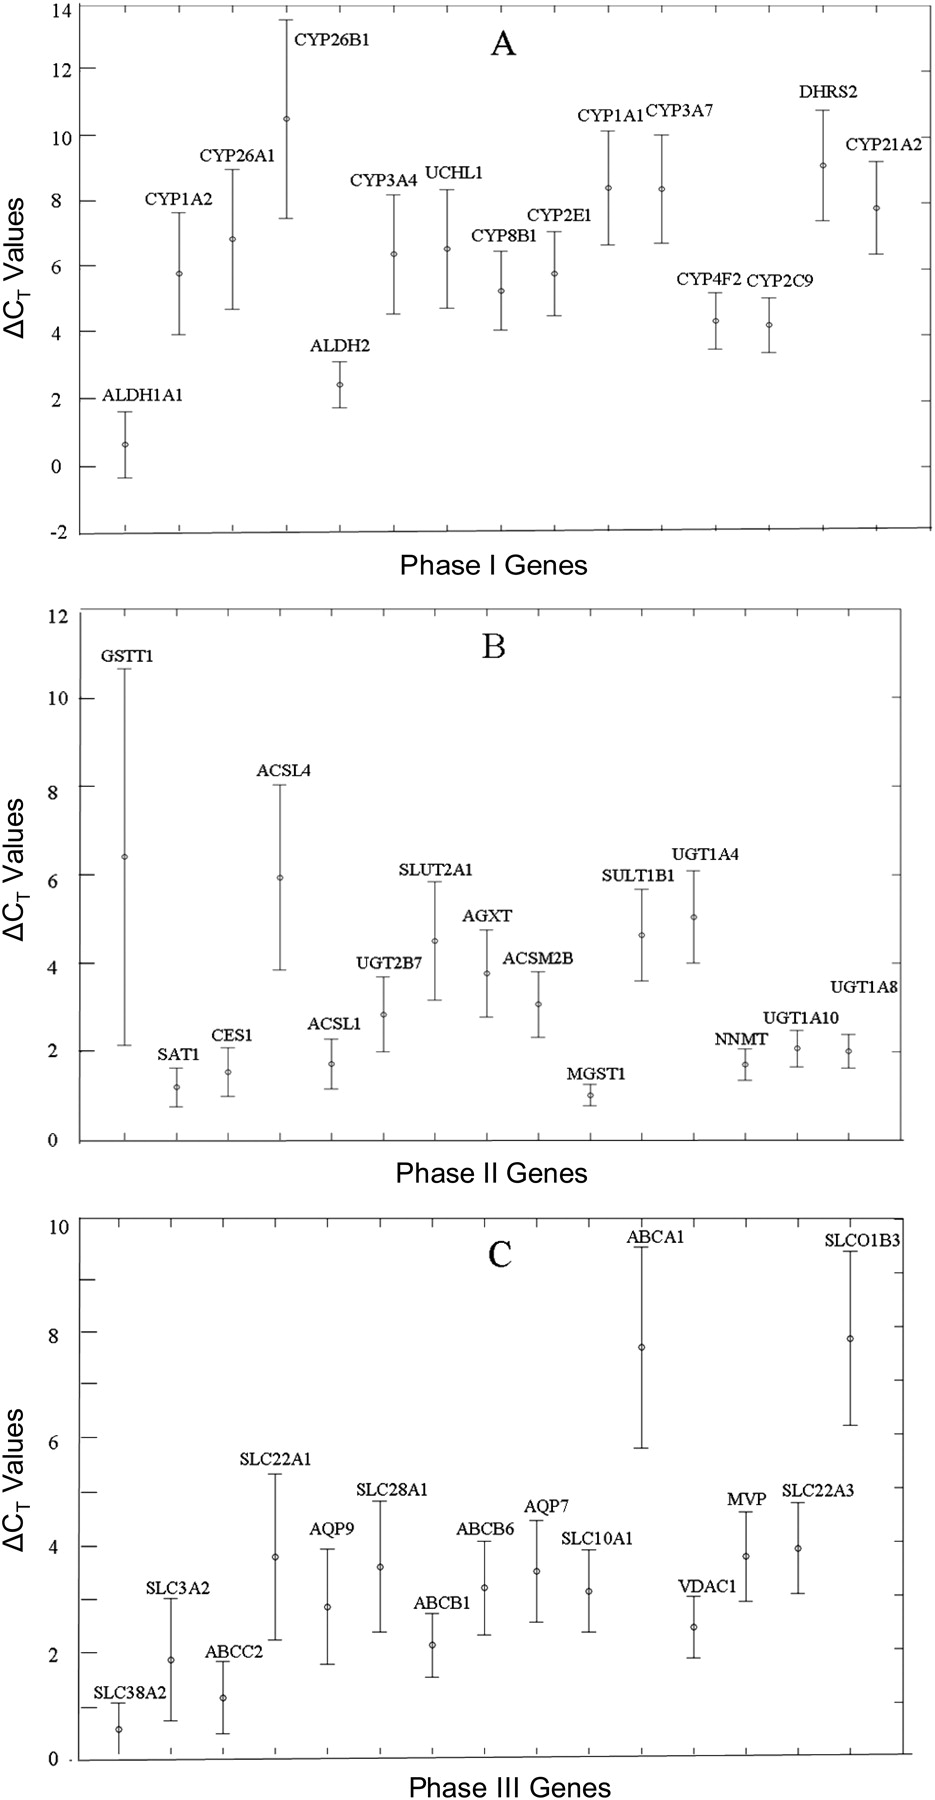
The 15 most variably expressed drug-metabolizing enzyme genes or transporter genes among six donors. The dot indicates the mean value of ΔCt of the gene, averaged from six donors, and the bars display the corresponding SD. A, B, and C represent phase I, phase II, and phase III genes, respectively. The y-axis indicates the values of ΔCt and the x-axis displays drug-metabolizing genes. The 15 most variably expressed DMETs for each category (phase I, II, or III) were selected on the basis of their highest CV values calculated based on the following equation: CV = S.D. (S.D. of the ΔCt)/M (mean of the ΔCt).
Furthermore, the interindividual variabilities of DMET expression levels in primary hepatocytes were demonstrated by the expression differences (fold) between the highest expressing individual and the lowest expressing individual, within the group of six primary hepatocyte donors. Table 3 lists the 10 DMETs with the widest range of expression levels for each of the phases I, II, and III systems. The numbers in the column “Expression Difference” indicate the expression fold differences that were calculated on the basis of the differences in values of ΔCt between the highest expressing individual and lowest expressing individual. Among these six individuals, the most widely ranged expressed DMET was GSTM5 (166-fold), followed by CYP26B1 (157-fold) and SULT1C1 (58-fold). However, GSTT1, with the highest fold difference of 2074 between individuals, should be considered as unique because a null variant exists in the general population (Norppa, 1997).


Discussion
In addition to primary human hepatocytes, hepatoma cell lines and immortalized or transfected nonhepatoma hepatic cell lines have been used for pharmacological and toxicological studies (Dykens et al., 2008; Rudzok et al., 2010). However, their limitations with respect to their expression of DMETs have also been discussed (Pfeifer et al., 1993; Gómez-Lechón et al., 2003; Wilkening et al., 2003; Knasmüller et al., 2004; Aninat et al., 2006; Donato et al., 2008). All of these in vitro models exhibit advantages and disadvantages. For instance, primary human hepatocytes have high expression levels of drug-metabolizing enzymes, but also exhibit high variability in genotype, short life span, and limited availability (Brandon et al., 2003). At present, neither a systematic evaluation nor a general report regarding expression of drug-metabolizing genes in these in vitro systems is available.
In the current study, similarities and differences between primary hepatocytes and five hepatic cell lines in DMET expression levels were observed using similarity matrix analysis, principal component analysis, and hierarchical clustering analysis. These similarity comparison analyses suggest that, in terms of DMET expression characteristics, hepatic cell lines only partially reflect the DMET expression characteristics of primary hepatocytes, indicating their limitations as surrogate cell models for human hepatocytes in toxicological and pharmacological studies. It has been reported that the differences in expression profiles between primary hepatocytes and hepatic cell lines are determined by a group of evolutionarily conserved transcription factors, known as liver-enriched transcription factors consisting of four major members: hepatocyte nuclear factors 1, 3, and 4 and CCAAT/enhancer binding protein α (Cereghini, 1996; Costa et al., 2003). With a high level of complexity in the gene regulation network, these factors interact cooperatively to stimulate specific gene expression events. However, the expression levels of liver-enriched transcription factors are quite different between primary hepatocytes and hepatic cell lines. For example, most of these transcription factors were found to be weakly expressed in hepatoma cell lines, with the exception of HNF4, which is expressed at a similar level in the hepatoma cell lines and primary hepatocytes (Gómez-Lechón et al., 2003). The fact that P450 enzymes are usually expressed at low levels or are undetectable in hepatoma cells may be largely due to the decreased expression levels of key transcription factors in those cell lines. This observation is supported by data indicating that the transfection of CCAAT/enhancer binding protein α into HepG2 cells resulted in a significant increase in CYP2 family expression in this cell line (Jover et al., 1998). In addition, cell culture environments, such as the composition of the culture medium and the oxygen concentration, can alter DMET expression profiles in HepG2 cells. Higher expression levels of CYP1A and CYP2B were found in cells cultured in Earle's medium compared with those in Dulbecco's modified Eagle's medium and Williams' E medium (Doostdar et al., 1988). During exposure to moderate hypoxia for 24 h, HepG2, Hep3B, and Huh7 produced a general pattern of down-regulation of response genes including drug-metabolizing genes (Fink et al., 2001).
Cultivation of primary hepatocytes has been widely used for pharmacological and toxicological studies, and various cultivation approaches (and medium formulations) have been applied, depending on the purpose of a particular study and the endpoints measured. In addition to the conventional monolayer culturing approach using a collagen-coated plate that was used in the current study, culturing hepatocytes in a sandwich configuration on Matrigel is becoming more appreciated for pharmacological studies, because the hepatocytes cultured on Matrigel could maintain more complex cellular behavior (such as canaliculi-like structure) that is not achievable under conventional culture systems. In the Matrigel system, hepatocytes are maintained in a higher structural integrity and a better polarization condition, as well as a suitable microenvironment mimicking the liver tissue, thus appearing to show drug-metabolizing capabilities more comparable to liver functions in vivo (Hewitt et al., 2007a). Olsavsky et al. (2007) demonstrated that human primary hepatocyte culturing on Matrigel produces extreme similarity of phenotypes (including drug metabolism), gene expression profiles between hepatocytes, and human liver tissue, indicating the highly differentiated nature of the hepatocytes when cultured in the Matrigel sandwich system.
Hepatic cell lines are usually used as surrogate tools of primary hepatocytes for toxicological and pharmacological studies. Cell lines such as HepG2 are especially useful for studying toxicities of chemicals that affect DNA replication and cell cycling because it can take several cell passages before the threshold of toxic effect is reached. Cell lines have unique advantages over primary cells, such as easier culturing and handling, lower costs, higher reproducibility for experiments, and relatively stable gene expression profiles. However, the most dramatic disadvantage of hepatic cell lines in toxicological and pharmacological studies is the absence or much lower expression of some key drug-metabolizing enzymes.
Chromosomal aberration including gene amplification, gene deletion, and heteroploidy is a common event in carcinogenesis, which introduces gene dosage differences between normal cells and transformed cell lines. In addition, expression profiles of transcription factors could be different between primary hepatocytes and hepatoma cell lines. Therefore, expression levels of some DMETs are extremely different between primary hepatocytes and hepatic cell lines. For example, SLC16A3 was expressed more than 10 times higher, whereas SLC22A1 was expressed 20 times lower in hepatic cell lines in comparison with expression in primary hepatocytes. The “abnormity” of expression of DMETs may provide survival advantages, such as drug resistance of hepatoma cell lines.
In choosing an alternative to primary hepatocytes, it is essential that the hepatic cell line expresses the complete spectrum of drug-metabolizing enzymes similar to that of primary hepatocytes. Although the “perfect” hepatoma cell line is not yet available, the expression of many drug-metabolizing genes was similar in the HepaRG cell line and primary hepatocytes, suggesting that this cell line may be a reliable surrogate for human hepatocytes for studies of xenobiotic metabolism and toxicology (Aninat et al., 2006; Hart et al., 2010; Jennen et al., 2010). It should be mentioned that choosing an appropriate cell line is highly dependent on the purpose of a specific study. A recent study suggested that for a chemical carcinogenesis analysis, HepaRG is a more suitable in vitro model than HepG2. On the other hand, in contrast to HepaRG, HepG2 is a better in vitro model for predictive toxicogenomics studies (Jennen et al., 2010).
Primary hepatocytes are often used in drug metabolism and toxicity studies because most of the activities of their DMETs are similar to those of intact human liver (Hewitt et al., 2007a; Soars et al., 2007). However, markedly high interindividual variability of DMET activities among humans is well documented (Ma et al., 2002; Zhou et al., 2009). For example, by measuring activities of 10 P450s in 12 human liver samples, Rodríguez-Antona et al. (2001) observed large variations of P450 activities among donors, with 50-fold differences of CYP3A4, more than 500-fold differences of CYP2D6, and 40-fold differences of CYP2C19. Genetic polymorphisms, including single nucleotide polymorphism, copy number variation, and insertion and deletion variation, contribute greatly to DMET expression profiles, drug metabolism, and clinical impacts (Zhou et al., 2008, 2009). In addition, environmental factors such as exogenous inducers and inhibitors may produce more heterogeneous DMET expression/activity and drug responses (Hewitt et al., 2007b; Walsky and Boldt, 2008). Donor variations in the responses to inducers and inhibitors (i.e., gene-environment interactions) further complicate the selection of primary hepatocytes for pharmacological and toxicological studies.
The variability of gene expression among humans is largely contributed by genetic and environmental factors, whereas the genetic polymorphism is the most important genetic contributor. Expression quantitative trait loci mapping studies aim to identify genetic variants that affect gene regulation. In these studies, gene expression levels are treated as quantitative traits, and gene expression phenotypes are mapped to particular genomic loci by combining studies of variation in gene expression patterns with genome-wide genotyping (Gilad et al., 2008; Schadt et al., 2008; Yang et al., 2010).
The variability of DMET expression among individuals has been recognized to have clinical significance. It was reported that decreased activity of UGT1A1 was found in 30% of patient populations, leading to increased adverse effects such as leukopenia and diarrhea after treatment with the chemotherapeutic agent irinotecan (Ando et al., 2000). In another study with docetaxel, it was reported that interpatient variability in CYP3A4 activity was attributed to the differences in drug clearance and toxicity. When docetaxel was administrated, patients with lower CYP3A4 activity were at a higher risk of drug toxicity because of a decreased clearance rate in their bodies (Hirth et al., 2000). The genetic variability in CYP2C9, CYP2C19, and CYP2D6 has been estimated to significantly affect the outcomes of 20 to 25% of drug treatment, and this genetic variability can be used to explain outliers in the clinic. For example, the Food and Drug Administration has a label for atomoxetine stating that it is highly dependent on CYP2D6 activity and a label for tamoxifen (CYP2D6) has also been considered. Recently, the Food and Drug Administration updated the label for warfarin, stating that “the patient's CYP2C9 and VKORC1 genotyping information, when available, can assist in selection of starting dose.”
Authorship Contributions
Participated in research design: Guo, Shi and Ning.
Conducted experiments: Guo, Dial, Branham, Liu, Fang, and Green.
Performed data analysis: Guo, Shi, and Ning.
Wrote or contributed to the writing of the manuscript: Guo, Shi, Branham, Deng, Kaput, and Ning.
Other: Guo, Shi, Kaput, and Ning acquired funding for the research.
Acknowledgments
We thank Dr. Ching-Wei Chang for helpful discussion and critical review of this manuscript.
Footnotes
This work was supported in part by the Office of Women's Health at the U.S. Food and Drug Administration. The Liver Tissue Cell Distribution System was funded by the National Institutes of Health National Institute of Diabetes and Digestive and Kidney Diseases [Contract N01-DK-7-0004/HHSN267200700004C].
The authors declare that there is no conflict of interest. The contents of this article do not necessarily reflect the views and policies of the U.S. Food and Drug Administration.
Article, publication date, and citation information can be found at http://dmd.aspetjournals.org.
doi:10.1124/dmd.110.035873.
↵
 The online version of this article (available at http://dmd.aspetjournals.org) contains supplemental material.
-
ABBREVIATIONS:
- DMET
- drug-metabolizing enzyme and transporter
- P450
- cytochrome P450
- THLE
- transfected human liver epithelial
- PCR
- polymerase chain reaction
- GAPDH
- glyceraldehyde-3-phosphate dehydrogenase
- ACTB
- β-actin
- PCA
- principal component analysis
- CV
- coefficient of variation.

- Received August 15, 2010.
- Accepted December 13, 2010.
- U.S. Government work not protected by U.S. copyright


