


Ticagrelor is an orally administered, antiplatelet agent that inhibits the prothrombotic effects of ADP on the platelet by antagonizing the P2Y12 receptor. Ticagrelor is a reversibly binding direct-acting P2Y12 antagonist and does not require metabolic activation to achieve its antiplatelet effect. CYP3A4 and CYP3A5 appear to be the enzymes predominantly responsible for the formation of the ticagrelor active and inactive metabolites, AR-C124910XX and AR-C133913XX. The apparent Km values in human liver microsomes are 27.0 and 38.8 μM, with Vmax values of 730 and 417 pmol/min/mg for AR-C124910XX and AR-C133913XX, respectively. Ticagrelor moderately inhibited CYP2C9 activity in human liver microsomes with an IC50 of 10.5 μM, while exhibiting little or no inhibition of CYP1A2, CYP2B6, CYP2C8, CYP2C19, CYP2D6, and CYP2E1. In human liver microsomes, ticagrelor inhibited midazolam 4-hydroxylation with an IC50 of 8.2 μM, while activating 1′-hydroxylation of midazolam. Studies with recombinant enzymes suggested that cytochrome b5 and CYP3A4 interactions play a significant role in this differential kinetic behavior. Evaluated in fresh human hepatocytes at concentration up to 20 μM, ticagrelor was not an inducer of CYP1A2 or CYP3A4. Although ticagrelor exhibited a tendency for CYP2B6 and CYP2C9 induction, its potential to cause drug interactions via the induction of these enzymes is low when its exposure at a therapeutic dose is considered.
Introduction
Ticagrelor (Fig. 1) is the first of a new class of antiplatelet agents known as cyclo-pentyl-triazolo-pyrimidines. Ticagrelor inhibits the prothrombotic effects of ADP on the platelet by antagonizing the P2Y12 receptor. Ticagrelor nearly completely inhibited ADP-induced platelet aggregation ex vivo (Husted et al., 2006) and demonstrated a dose-dependent inhibition of platelet aggregation in humans, resulting in 79 and 95% inhibition by 90 and 180 mg b.i.d., respectively (Storey et al., 2007). Ticagrelor is differentiated from thienopyridine antiplatelet agents, such as ticlopidine, clopidogrel, and prasugrel, in several important ways. Ticagrelor is an orally active reversibly binding antagonist and does not require metabolic transformation to inhibit P2Y12. Conversely, the thienopyridines do require metabolic activation and bind irreversibly to the P2Y12 receptor. These characteristics may make ticagrelor a drug with faster onset and offset of action, compared with clopidogrel, with less interpatient variability in plasma concentrations and antiplatelet effects (Gurbel et al., 2009).
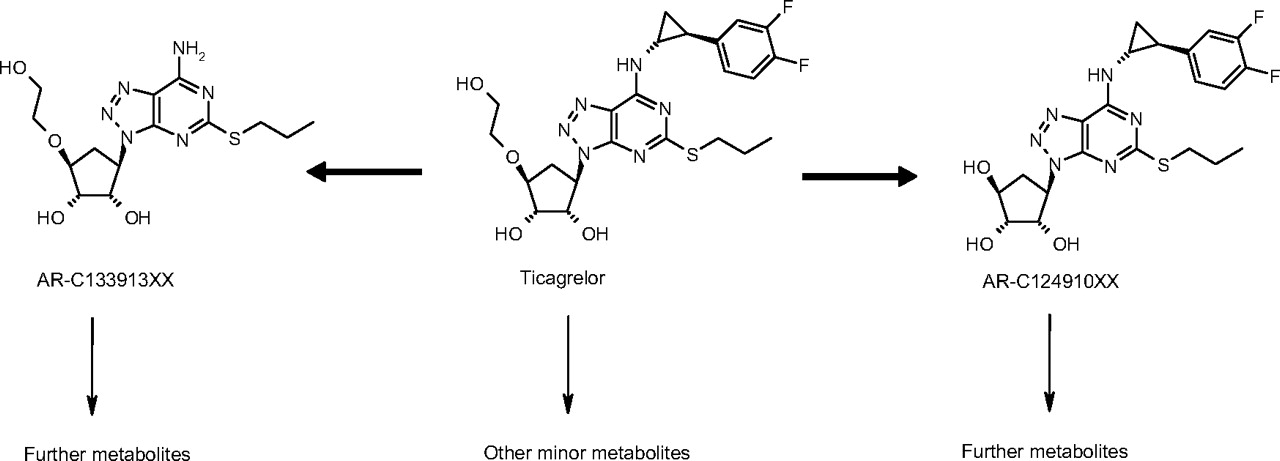
Chemical structures of ticagrelor and its major metabolites AR-C124910XX and AR-C133913XX. Refer to Teng et al. (2010) for detailed ticagrelor metabolic pathways.
In addition to the active parent compound, AR-C124910XX (a major metabolite of ticagrelor) has also been found to antagonize the P2Y12 receptor at approximately equal potency. After a 100-mg b.i.d. dose in humans, ticagrelor reaches a steady-state maximum plasma concentration (Cmax) of approximately 1.5 μM, whereas AR-C124910XX circulates in plasma at approximately one-third the concentration of the parent drug (van Giezen and Humphries, 2005; Husted et al., 2006). Ticagrelor and AR-C124910XX were observed as the predominant components in plasma and feces in six human subjects receiving a single oral dose of [14C]ticagrelor. Recoveries of ticagrelor and AR-C124910XX in urine were both less than 1% of the administered dose. The major components in urine were an inactive metabolite, AR-C133913XX, and its glucuronide conjugate (Teng et al., 2010).
Ticlopidine, the first thienopyridine antiplatelet agent, is mainly metabolized by CYP3A4 and CYP2C19 (Dalvie and O'Connell, 2004). Multiple P450 enzymes, including CYP1A2, CYP2B6, CYP2C9, CYP2C19, and CYP3A4, are responsible for the metabolism of clopidogrel (Kazui et al., 2010), whereas CYP3A4 and CYP2B6 have been identified as major contributors to the metabolism of prasugrel (Rehmel et al., 2006). Ticlopidine, clopidogrel, and prasugrel have been shown to be mechanism-based inhibitors of CYP2B6 (Richter et al., 2004; Nishiya et al., 2009), and ticlopidine was also demonstrated to be a mechanism-based inhibitor of CYP2C19 (Ha-Duong et al., 2001). Unlike reversible inhibition, mechanism-based inhibition of P450 enzymes can result in time-extended and less predictable changes in exposure to other “victim” drugs that are subject to metabolism by the inactivated enzyme because the inactivated P450 enzyme can only be replaced by newly synthesized protein.
The current studies were performed to characterize the P450 enzymes that are responsible for the metabolism of ticagrelor to its major active (AR-C124910XX) and inactive (AR-C133913XX) metabolites. In addition, ticagrelor was evaluated in vitro for its potential to inhibit, inactivate, or induce major human P450 enzymes.
Materials and Methods
Materials.
Chemicals were obtained from Sigma-Aldrich (St. Louis, MO), Toronto Research Chemicals (North York, ON, Canada), BD Gentest (Woburn, MA), or Inveresk (Tranent, Scotland). Ticagrelor, AR-C124910XX, AR-C133913XX, and omeprazole were obtained from the AstraZeneca compound collection. Pooled human liver microsomes (HLM) were purchased from BD Gentest or prepared within AstraZeneca (Södertälje, Sweden) or by Inveresk. Microsomes prepared from insect cells infected with recombinant baculovirus containing a cDNA insert for individual human P450 enzyme or cytochrome b5 (Cyt b5) were obtained from BD Gentest. All human recombinant P450 enzymes, except CYP1A2, CYP2D6, and CYP3A5, were coexpressed with Cyt b5. CYP3A4, with and without coexpression of Cyt b5, was used in this study.
Identification of the P450 Enzymes That Metabolize Ticagrelor to AR-C124910XX and AR-C133913XX.
In vitro incubations of ticagrelor in HLM to evaluate AR-C124910XX and AR-C133913XX formation were conducted under linear conditions with respect to incubation time and microsomal protein concentration. Ticagrelor at 3 μM was incubated with 0.5 mg/ml HLM at 37°C either alone or with selective P450 inhibitors, furafylline (2 and 10 μM), sulfaphenazole (1 and 5 μM), omeprazole (15 and 50 μM), quinidine (0.2 and 1 μM), and ketoconazole (0.2 and 1 μM). Incubation mixtures also contained 100 mM pH 7.4 potassium phosphate buffer, 5 mM MgCl2, and an NADPH-regenerating system containing 1.3 mM NADP, 3.3 mM glucose 6-phosphate, and 0.4 unit/ml glucose-6-phosphate dehydrogenase. Because of its inhibitory mechanism, furafylline was preincubated with microsomal protein and the NADPH-regenerating system for 15 min to increase its effect on CYP1A2. All incubations were conducted in duplicate. Reactions were terminated after a 30-min incubation by the addition of an equal volume of 0.1% formic acid in acetonitrile, and samples were quantified by liquid chromatography-mass spectrometry. The formation of AR-C124910XX and AR-C133913XX in the presence of inhibitors was compared with that of metabolites formed in their absence.
Microsomes expressing individual human cytochrome P450 enzymes, CYP1A2, CYP2A6, CYP2B6, CYP2C9, CYP2C19, CYP2D6, CYP3A4, and CYP3A5, at 150 pmol/ml were incubated with ticagrelor to evaluate the individual P450 contribution to the metabolism of AR-C124910XX and AR-C133913XX. Incubation conditions and sample preparation were similar to those described above. The ticagrelor metabolites formed in the presence of individual P450s were compared with those formed in microsomes from the vector control Sf9 membranes.
Enzyme kinetics for the formation of AR-C124910XX and AR-C133913XX were evaluated in HLM (0.5 mg/ml) and in recombinant CYP3A4 and CYP3A5 enzymes (150 pmol/ml). Ticagrelor was incubated for 30 min in the concentration range of 1 to 50 μM.
Separation of ticagrelor, AR-C124910XX, and AR-C133913XX was performed by reverse-phase high-performance liquid chromatography using a Synergi Max-RP column (4 μm, 3 × 30 mm; Phenomenex, Torrance, CA) with a 5-min gradient at 0.6 ml/min consisting of 0.1% formic acid in water (A) and 0.1% formic acid in methanol (B). Compounds were quantified on a Finnigan AQA single quadrupole mass spectrometer (Thermo Fisher Scientific, Waltham, MA) using selected ion monitoring mode with ion m/z at 523.0 for ticagrelor, 479.0 for AR-C124910XX, and 371.0 for AR-C133913XX.
Kinetic constants for the formation of AR-C124910XX and AR-C133913XX in HLM and recombinant CYP3A4 and CYP3A5 were obtained by fitting either Michaelis-Menten kinetics [v = Vmax [S]/(Km + [S])] or sigmodal kinetics [v = Vmax [S]n/(S50n + [S]n)] to experimental data using nonlinear regression (Prism 4; GraphPad Software Inc., San Diego, CA).
P450 Inhibition by Ticagrelor.
The potential to cause drug-drug interactions by inhibition of the major human P450 enzymes was evaluated by coincubation of ticagrelor with selective P450 probe substrates in HLM (Table 1). The metabolites formed, resorufin, 2-hydroxybupropion, 6α-hydroxypaclitaxel, 4′-hydroxydiclofenac, 4′-hydroxymephenytoin, dextrorphan, and 6-hydroxychlorzoxazone, were quantified as specific P450 markers for the activities of CYP1A2, CYP2B6, CYP2C8, CYP2C9, CYP2C19, CYP2D6, and CYP2E1, respectively. 1′-Hydroxymidazolam and 6β-hydroxytestosterone were formed and quantified as markers of the activity of CYP3A4/5. Ticagrelor was coincubated at concentrations up to 50 μM in each P450 assay in duplicate, and the respective metabolite formation of probe substrates was compared with that for the vehicle solvent control incubations. Samples were analyzed by fluorescent detection (Burke et al., 1985), online radio detection (Sonderfan et al., 1987), or mass spectrometry (API 3000 or API 4000 mass spectrometer; Applied Biosystems/MDS Sciex, Foster City, CA) (Li et al., 2010). The P450 inhibition results are expressed as percent inhibition of the control enzyme activity. When the inhibition exceeded 50% of the control activity, an IC50 value was estimated using nonlinear regression analysis (XL Fit 4.2.2 software; IDBS, Surrey, UK).
Incubation conditions for P450 inhibition assays
Interaction between Midazolam and Ticagrelor in Recombinant CYP3A4 and CYP3A5.
The interaction between midazolam and ticagrelor in CYP3A4 and CYP3A5 was further investigated using individual recombinant enzymes with varying ratios of Cyt b5. Midazolam at 3 μM was incubated with different concentrations of ticagrelor (0.07–50 μM) in the presence of 1 mM NADPH, 50 pmol/ml CYP3A4 or CYP3A5, and Cyt b5. Four different Cyt b5 experimental conditions were evaluated, 1) 0 pmol/ml Cyt b5, 2) 150 pmol/ml Cyt b5, 3) 500 pmol/ml Cyt b5, and 4) 150 pmol/ml heat-denatured Cyt b5, which resulted in a P450/Cyt b5 ratio of 1:0, 1:3, 1:10, and 1:3 denatured, respectively. Denatured Cyt b5 was achieved by pretreatment at 45°C for 5 min. Vector control protein was added to ensure a constant total protein concentration in all incubations. Reactions were initiated with the addition of NADPH (1 mM) and terminated after a 5-min incubation. Formations of 1′- and 4-hydroxymidazolam were evaluated as markers for CYP3A4 and CYP3A5 activities. An IC50 value was estimated when the inhibition exceeded 50% of the control activity.
Time-Dependent Inhibition of CYP3A4/5 and CYP2B6 by Ticagrelor.
The time-dependent inhibition of CYP3A4/5 activities by ticagrelor was evaluated by preincubating 3 μM ticagrelor at 37°C with 2 mg/ml HLM and 1 mM NADPH in 100 mM phosphate buffer for 0, 3, 10, 20, and 30 min. Verapamil, tested at 10 μM, was also incubated separately as a positive control. As a negative control experiment, HLM and NADPH were preincubated in buffer in the absence of test compound. An aliquot of 20 μl was removed from the preincubation tube at each time point and added to a secondary incubation tube (180 μl) containing 3 μM midazolam and 1 mM NADPH. In this way, the test compounds were diluted 10-fold to reduce the potential reversible inhibition and to observe any decrease in P450 activity due to enzyme inactivation. After 5 min of the secondary incubation, reactions were terminated.
The time-dependent inhibition of CYP2B6 activity by ticagrelor was also evaluated similarly as for CYP3A4/5. The preincubation was performed at 10 μM ticagrelor in the presence of 1 mg/ml HLM. At various time points, aliquots of the preincubation mixtures were added to secondary incubations to provide a 10-fold dilution of the test compound. The secondary incubations containing 120 μM bupropion and 1 mM NADPH were terminated after a 15-min incubation. Ticlopidine at 1 μM was used as a positive control.
The formation of 1′- and 4-hydroxymidazolam and hydroxybupropion was used as a marker for CYP3A4/5 and CYP2B6 activities, respectively. P450 activities after preincubation with ticagrelor were compared with activities after incubation with vehicle solvent (1% methanol) and without preincubation. The natural logarithm of percent inhibition of the control enzyme activity by the respective compound was plotted with preincubation time. The inactivation rate (kobs) was calculated as a negative slope.
P450 Induction by Ticagrelor.
The potential of ticagrelor to induce the expression of P450 enzymes was investigated in primary cultures of freshly isolated human hepatocytes from three individual donors. Hepatocytes were treated once daily for 3 consecutive days with ticagrelor (0.2, 2, and 20 μM) or positive control inducers, β-naphthoflavone (BNF) (20 μM), phenobarbital (PB) (2 mM), and rifampin (RIF) (20 μM), as well as with a solvent vehicle control (0.1% dimethyl sulfoxide). Hepatocytes were harvested after 72 h of treatment, and microsomes were prepared by two-speed centrifugation. P450 enzyme induction was assessed by a microsomal assay using probe substrates phenacetin (200 μM), bupropion (250 μM), diclofenac (100 μM), and testosterone (200 μM) for CYP1A2, CYP2B6, CYP2C9, and CYP3A4 catalytic activities, respectively. The metabolite of the probe substrate for each enzyme was analyzed using high-performance liquid chromatography with UV absorbance (Stresser et al., 2004). Fold induction was calculated as the ratio of activity from ticagrelor or the positive control to activity from the vehicle control. The extent of enzyme activity induction, expressed as a percentage of the positive control effect, was calculated as follows:

The mRNA expression for each P450 isoform was determined using TaqMan reverse transcriptase-polymerase chain reaction analysis (McGinnity et al., 2009). Threshold cycle (CT) values (the fractional cycle number at which the fluorescence passes the fixed threshold) were first determined. Then the ΔCT of each target gene sample was calculated by subtracting the CT from its corresponding endogenous control, β-actin or glyceraldehyde-3-phosphate dehydrogenase, and the ΔΔCT was determined for the positive control inducer or ticagrelor by subtracting the ΔCT from phosphate-buffered saline. Fold induction was determined by the calculation of 2−ΔΔCT. The extent of mRNA induction, expressed as a percentage of the positive control effect, was calculated as follows:

Results
Identification of Enzymes Responsible for the Metabolism of Ticagrelor.
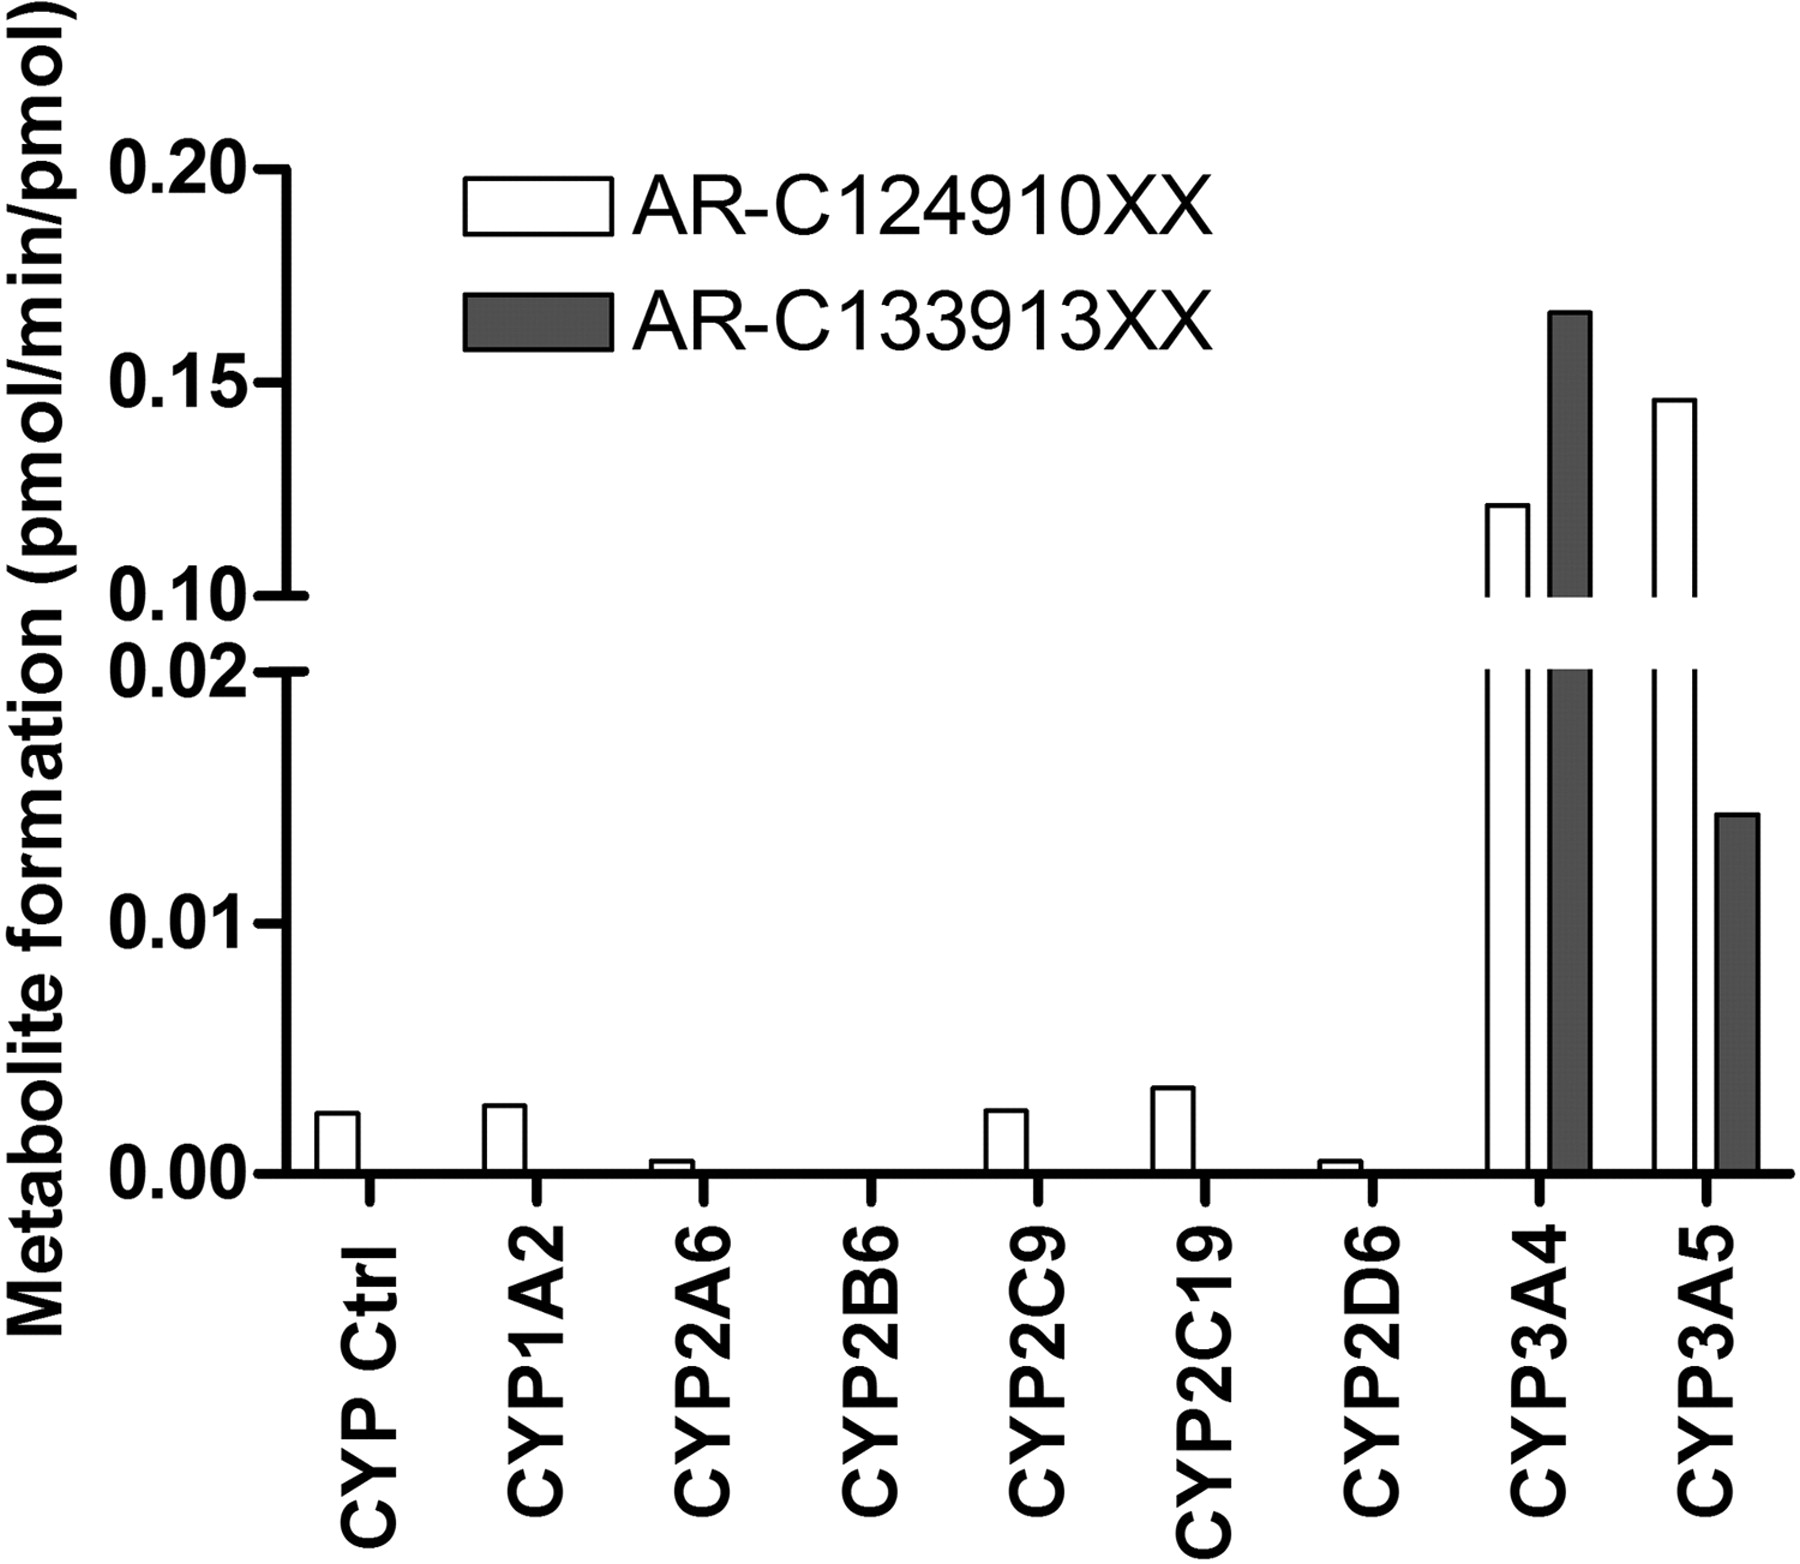
Ticagrelor was incubated with various human recombinant P450 enzymes to assess the contribution of individual enzymes to the metabolism of ticagrelor. The formation of AR-C124910XX and AR-C133913XX is presented in Fig. 2. AR-C133913XX was not detected in the vector control, CYP1A2, CYP2A6, CYP2B6, CYP2C9, CYP2C19, or CYP2D6 incubations. CYP3A5 generated a low amount of AR-C133913XX, whereas the profile in the CYP3A4 incubation showed significant AR-C133913XX formation. Small amounts of AR-C124910XX were detected in the incubations with CYP1A2, CYP2A6, CYP2B6, CYP2C9, CYP2C19, or CYP2D6; however, similar amounts were also detected in vector control incubations, indicating that these P450 enzymes are not likely to be responsible for the metabolism of AR-C124910XX. In contrast, significant amounts of AR-C124910XX were detected in both CYP3A4 and CYP3A5 incubations. In addition, metabolites AR-C124910XX and AR-C133913XX were not observed after ticagrelor incubations with human recombinant CYP2E1 and CYP2C8 (data not shown).

Formation of AR-C124910XX and AR-C133913XX from ticagrelor (3 μM) incubation in individual human recombinant P450 enzymes. Each bar represents the mean activity from duplicate measurements.
The formation of AR-C124910XX and AR-C133913XX from ticagrelor in the presence and absence of selective P450 inhibitors in HLM was also evaluated to confirm the results from recombinant enzymes (Fig. 3). More than 95% of AR-C124910XX and AR-C133913XX formation was inhibited by 1 μM ketoconazole, the selective CYP3A4/5 inhibitor. Other P450 inhibitors, including furafylline for CYP1A2, sulfaphenazole for CYP2C9, and quinidine for CYP2D6, showed little effect on the metabolism of ticagrelor to AR-C124910XX and AR-C133913XX. Omeprazole, a CYP2C19 substrate/inhibitor, exhibited ∼40% inhibition for both metabolites at 50 μM. However, the inhibition may be due to the lack of specificity, because omeprazole has also been shown to inhibit CYP3A4/5-mediated 1′-hydroxymidazolam formation in HLM (Li et al., 2004). When both recombinant enzyme and chemical inhibition results are considered together, it appears that CYP2C19 provides little or no contribution to the metabolism of ticagrelor to AR-C124910XX or AR-C133913XX.
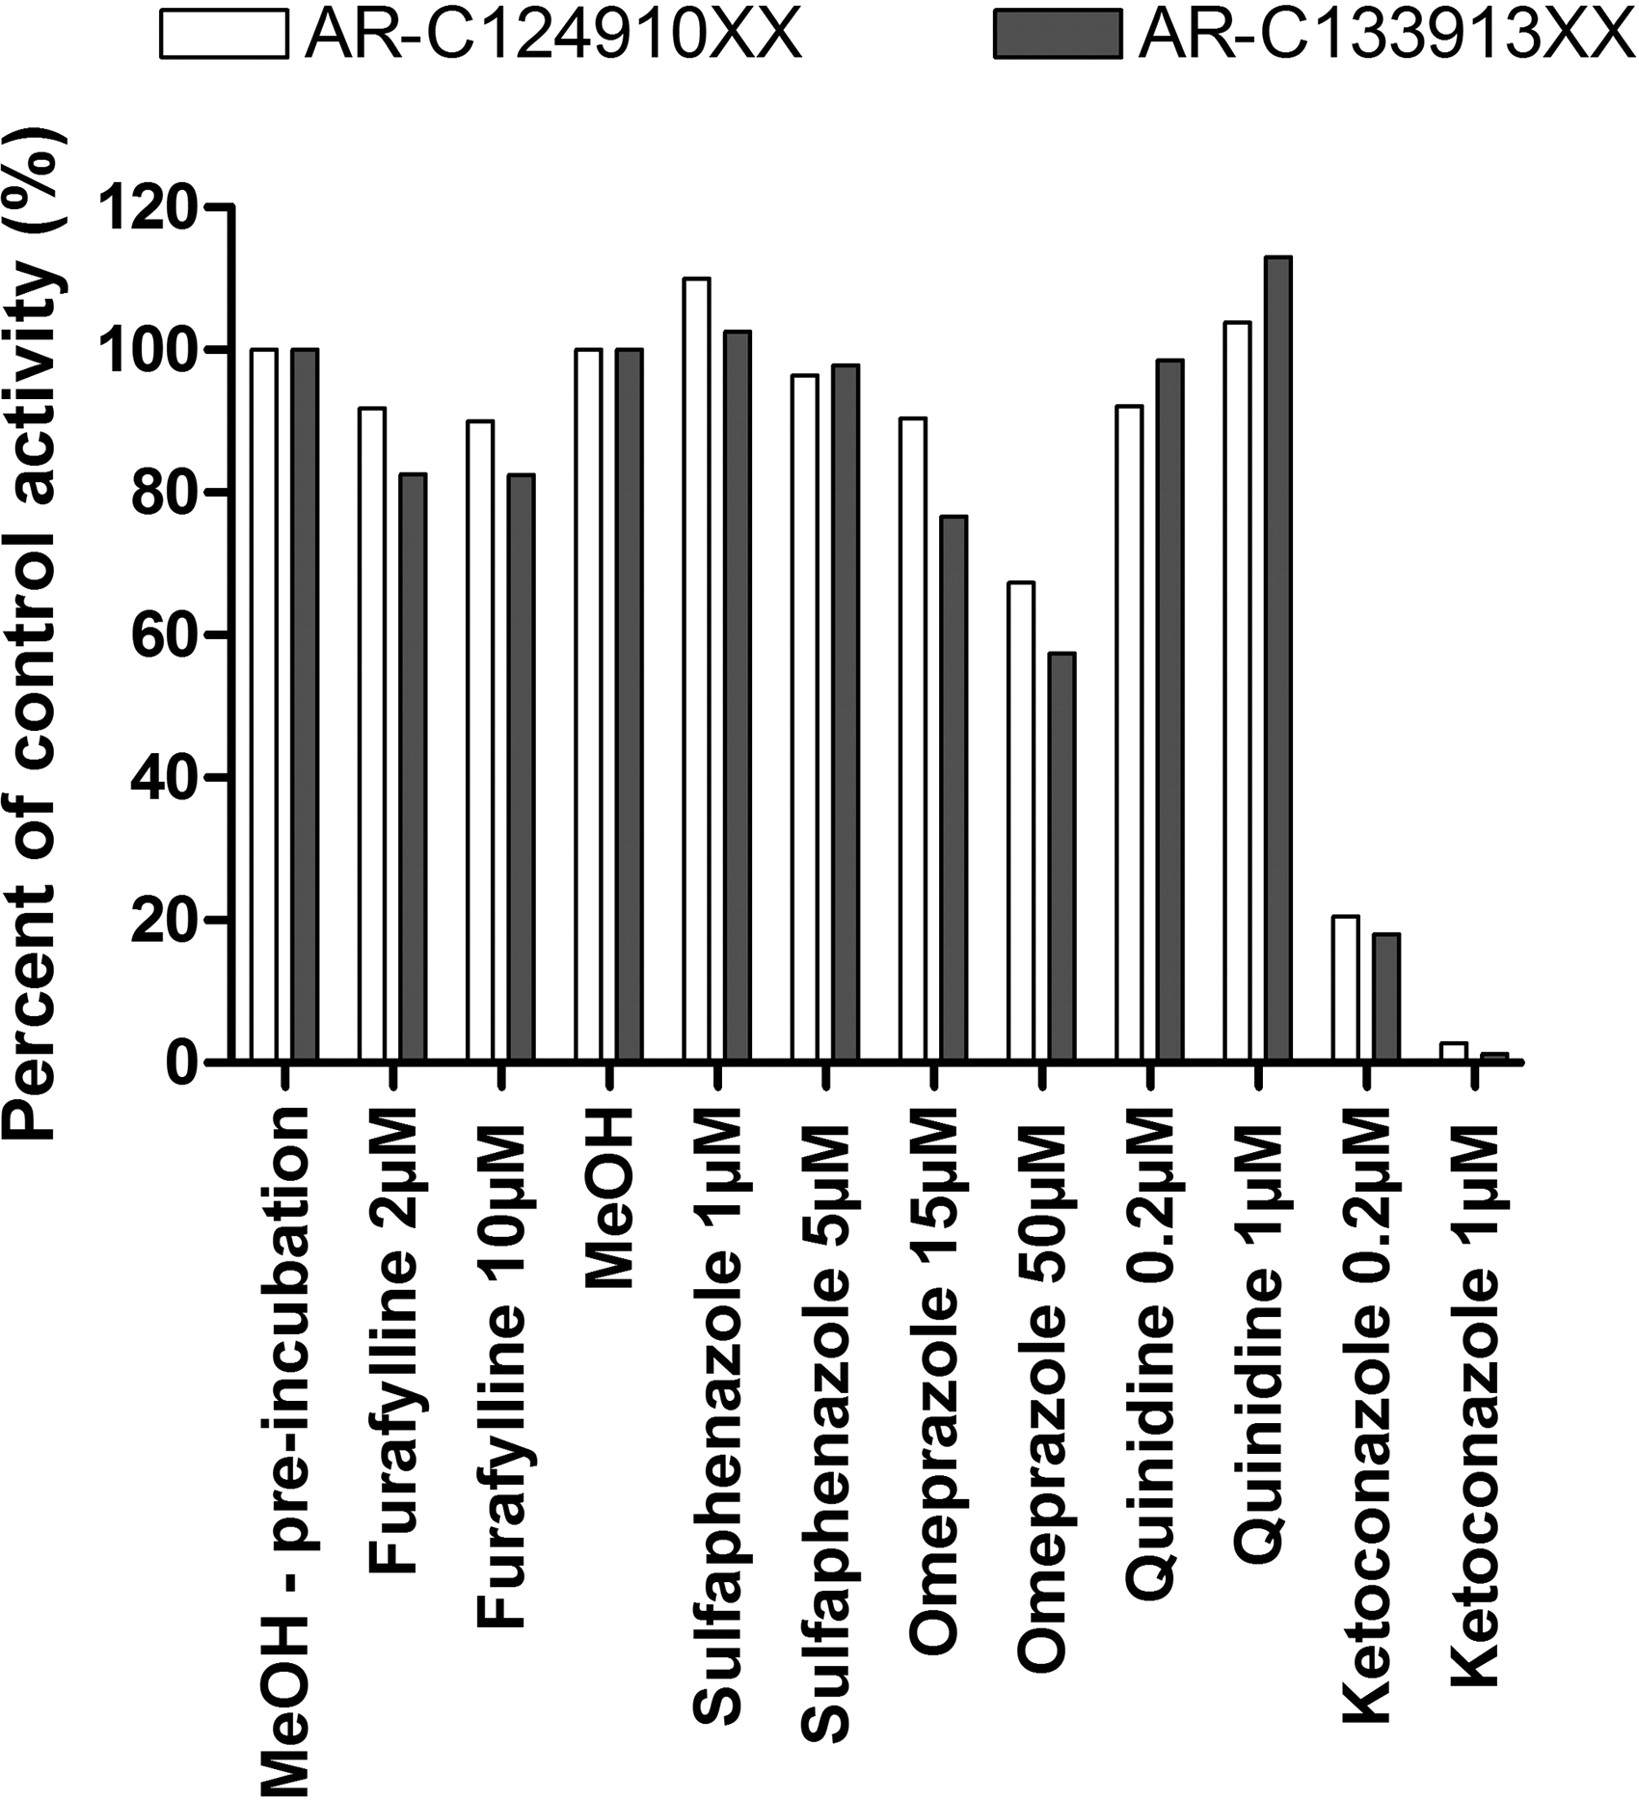
Effect of P450-selective chemical inhibitors on the formation of AR-C124910XX and AR-C133913XX in pooled human liver microsomes. Each bar represents the mean percentage of activity relative to the vehicle control from duplicate measurements. Furafylline was preincubated to increase its inhibitory effect on CYP1A2.
The formation of AR-C124910XX and AR-C133913XX by HLM exhibited Michaelis-Menten kinetics (Fig. 4) with apparent Km values of 27.0 ± 2.5 and 38.8 ± 1.8 μM and Vmax values of 730 ± 34 and 417 ± 11 pmol/min/mg protein, respectively. The in vitro intrinsic clearances (Vmax/Km) for AR-C124910XX and AR-C133913XX by HLM were 27.0 and 10.7 μl/min/mg protein, respectively. The enzyme kinetics of ticagrelor metabolism was further evaluated using human recombinant CYP3A4 and CYP3A5. Sigmoidal kinetics and Michaelis-Menten kinetics were observed for AR-C124910XX formation by CYP3A4 and CYP3A5 with apparent S50 and Km values of 11.0 and 5.36 μM, respectively (Table 2). AR-C133913XX formation by both CYP3A4 and CYP3A5 could be described by Michaelis-Menten kinetics with apparent Km values of 41.3 and >50 μM, respectively (Table 2).

Kinetic analysis of the formation of AR-C124910XX and AR-C133913XX by pooled human liver microsomes. Ticagrelor was incubated at concentrations in the range of 1 to 50 μM in duplicate experiments.
Enzyme kinetics of ticagrelor metabolite formation in recombinant CYP3A4 and CYP3A5 enzymes
P450 Inhibition by Ticagrelor.
The inhibition of human P450 enzymes by ticagrelor was evaluated using HLM and selective P450 probes (Table 1). Ticagrelor at 50 μM, exhibited 0, 38, and 12% inhibition toward CYP1A2, CYP2C8, and CYP2C19 activities, respectively. Ticagrelor weakly inhibited CYP2B6 and CYP2D6 activity with apparent IC50 values of 40.0 and 26.7 μM, respectively. Ticagrelor inhibited CYP2C9 activity with an IC50 of 10.5 μM (Table 3). Because of well documented substrate-dependent interactions, multiple probe substrates were used to evaluate the inhibition of CYP3A4/5 activities. Testosterone 6β-hydroxylation was partially inhibited by ticagrelor, with 23 to 30% inhibition at a concentration range of 5 to 50 μM. Coincubation of ticagrelor with midazolam appeared to activate 1′-hydroxylation and moderately inhibit 4-hydroxylation (Fig. 5) with an apparent IC50 of 8.2 μM. The maximal activation of 1′-hydroxylation (152%) was observed at 5.6 μM ticagrelor in vitro, with some decrease in effect at higher ticagrelor concentrations.
In vitro inhibition of ticagrelor towards P450-selective metabolic pathways and prediction of the in vivo inhibition potential

Effect of ticagrelor on the formation of 1′-hydroxymidazolam and 4-hydroxymidazolam in pooled human liver microsomes. Each data point represents the average activity from duplicate experiments.
Ticagrelor did not cause time-dependent inhibition of 1′-hydroxy midazolam (Fig. 6A) or 4-hydroxy midazolam (data not shown) formation in HLM. Verapamil, a known CYP3A inactivator, demonstrated an inactivation rate of 0.04 min−1 at 10 μM (Fig. 6A). No time-dependent inhibition of CYP2B6 activity by ticagrelor was observed, whereas 1 μM ticlopidine inactivated bupropion hydroxylation at a rate of 0.08 min−1 (Fig. 6B).

Effect of preincubation of ticagrelor with pooled human liver microsomes on the activity of CYP3A4/5 (A) or CYP2B6 (B). Verapamil and ticlopidine were used as positive controls for CYP3A4/5 and CYP2B6 inactivation.
In Vitro Interaction between Ticagrelor and Midazolam.
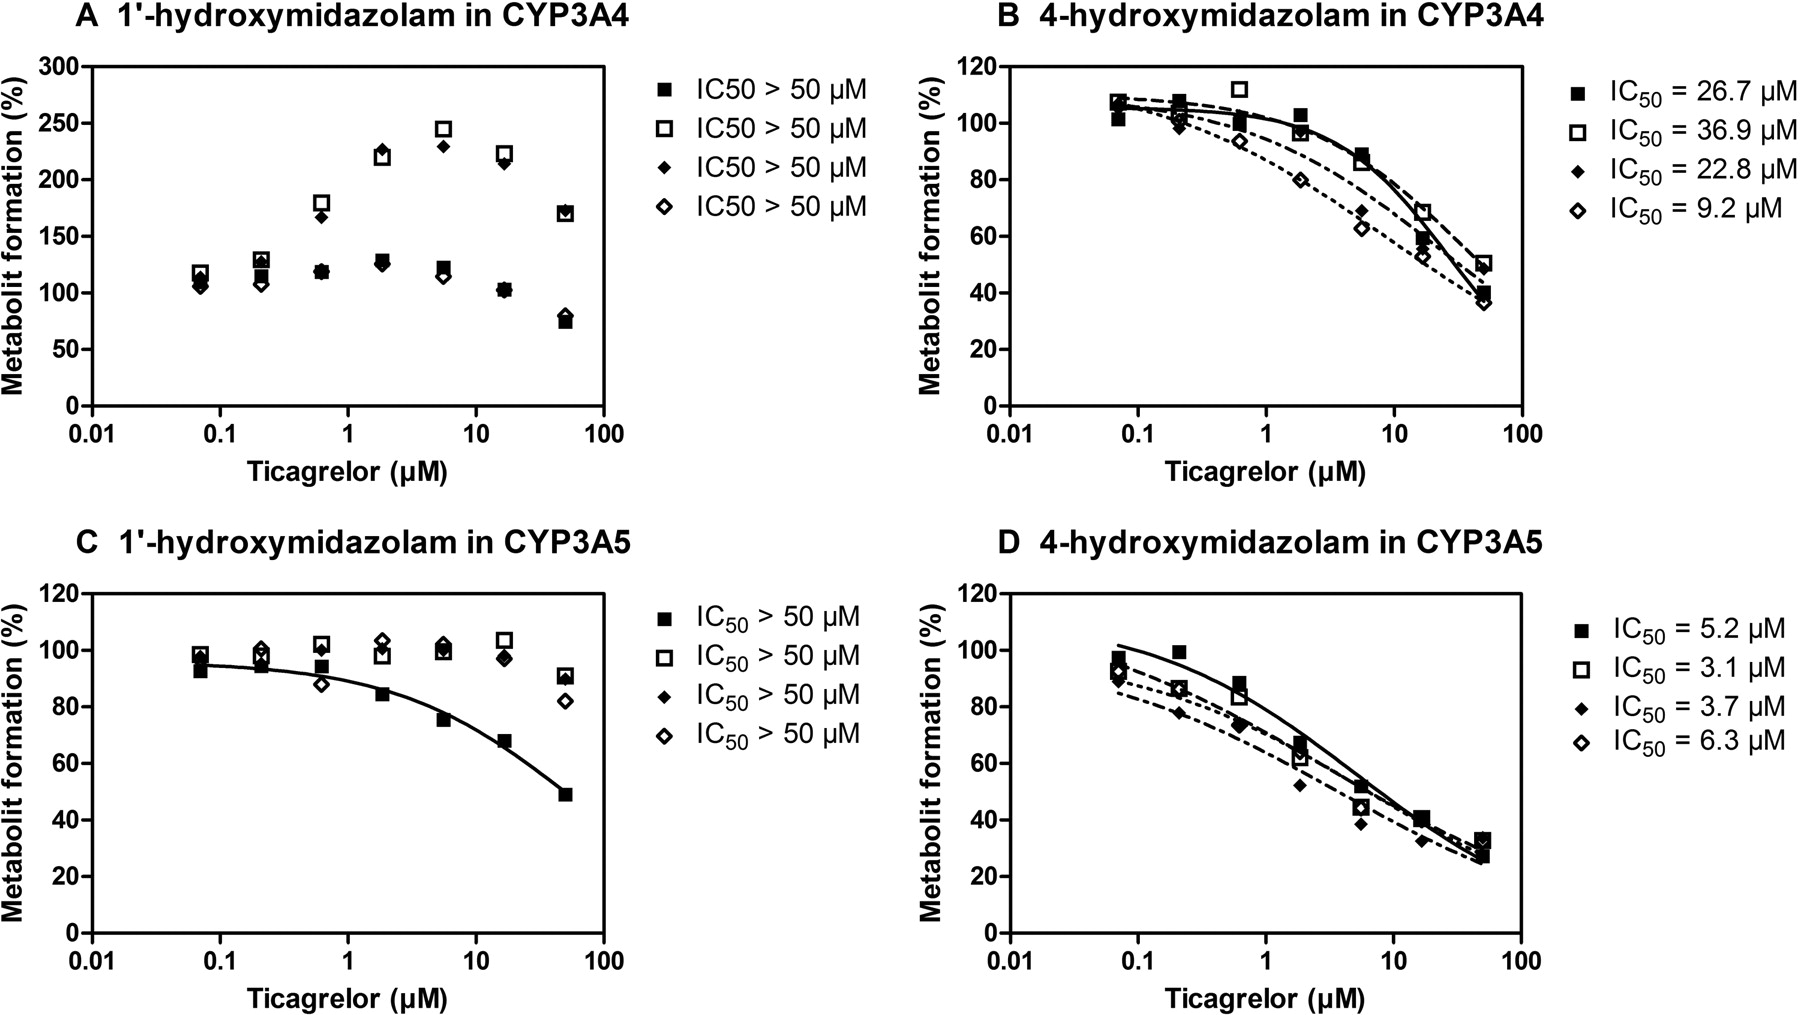
The interactions between ticagrelor and midazolam in CYP3A4 and CYP3A5 were studied using the recombinant enzymes and Cyt b5 addition. In the presence of Cyt b5, the formation of 1′-hydroxymidazolam in CYP3A4 appeared to be activated by ticagrelor. This activation exhibited a maximum increase in metabolism rate at 5.6 μM ticagrelor, the same concentration as observed in HLM (Figs. 5 and 7A). Different ratios of CYP3A4 to Cyt b5 (1:3 versus 1:10) in the incubation did not change the level of activation of 1′-hydroxylation, although this activation was not observed in the absence of Cyt b5 or when denatured Cyt b5 was added to the incubation. The availability of Cyt b5 had little impact on the observed inhibition of midazolam 4-hydroxylation by ticagrelor in recombinant CYP3A4 (Fig. 7B). In addition, no activation of midazolam hydroxylation catalyzed by CYP3A5 was observed under any condition tested. Ticagrelor weakly inhibited 1′-hydroxylation by CYP3A5 with IC50 values greater than 50 μM (Fig. 7C) and moderately inhibited 4-hydroxylation with apparent IC50 values of 3.1 to 6.3 μM in different ratios of CYP3A5 and Cyt b5 (Fig. 7D).

Interactions between ticagrelor and midazolam in CYP3A4 and CYP3A5 in the absence or presence of cytochrome b5. A, 1′-hydroxymidazolam formation in CYP3A4. B, 4-hydroxymidazolam formation in CYP3A4. C, 1′-hydroxymidazolam formation in CYP3A5. D, 4-hydroxymidazolam formation in CYP3A5. ■, CYP3A:Cyt b5(1:0); □, CYP3A:Cyt b5(1:3); ♦, CYP3A:Cyt b5 (1:10); ♦, CY3A:denatured Cyt b5 (1:3). Estimated IC50 values are shown to the right of the panels. Each data point represents the average activity from duplicate experiments.
P450 Induction by Ticagrelor.
The potential of ticagrelor to induce expression of P450 enzymes was evaluated using fresh human hepatocytes. A cytotoxicity assay using the tetrazole 3-(4,5-dimethylthiazol-2-yl)-2,5-diphenyltetrazolium, and visual inspection showed no apparent reduction in hepatocyte viability after treatment with ticagrelor at a concentration up to 20 μM.
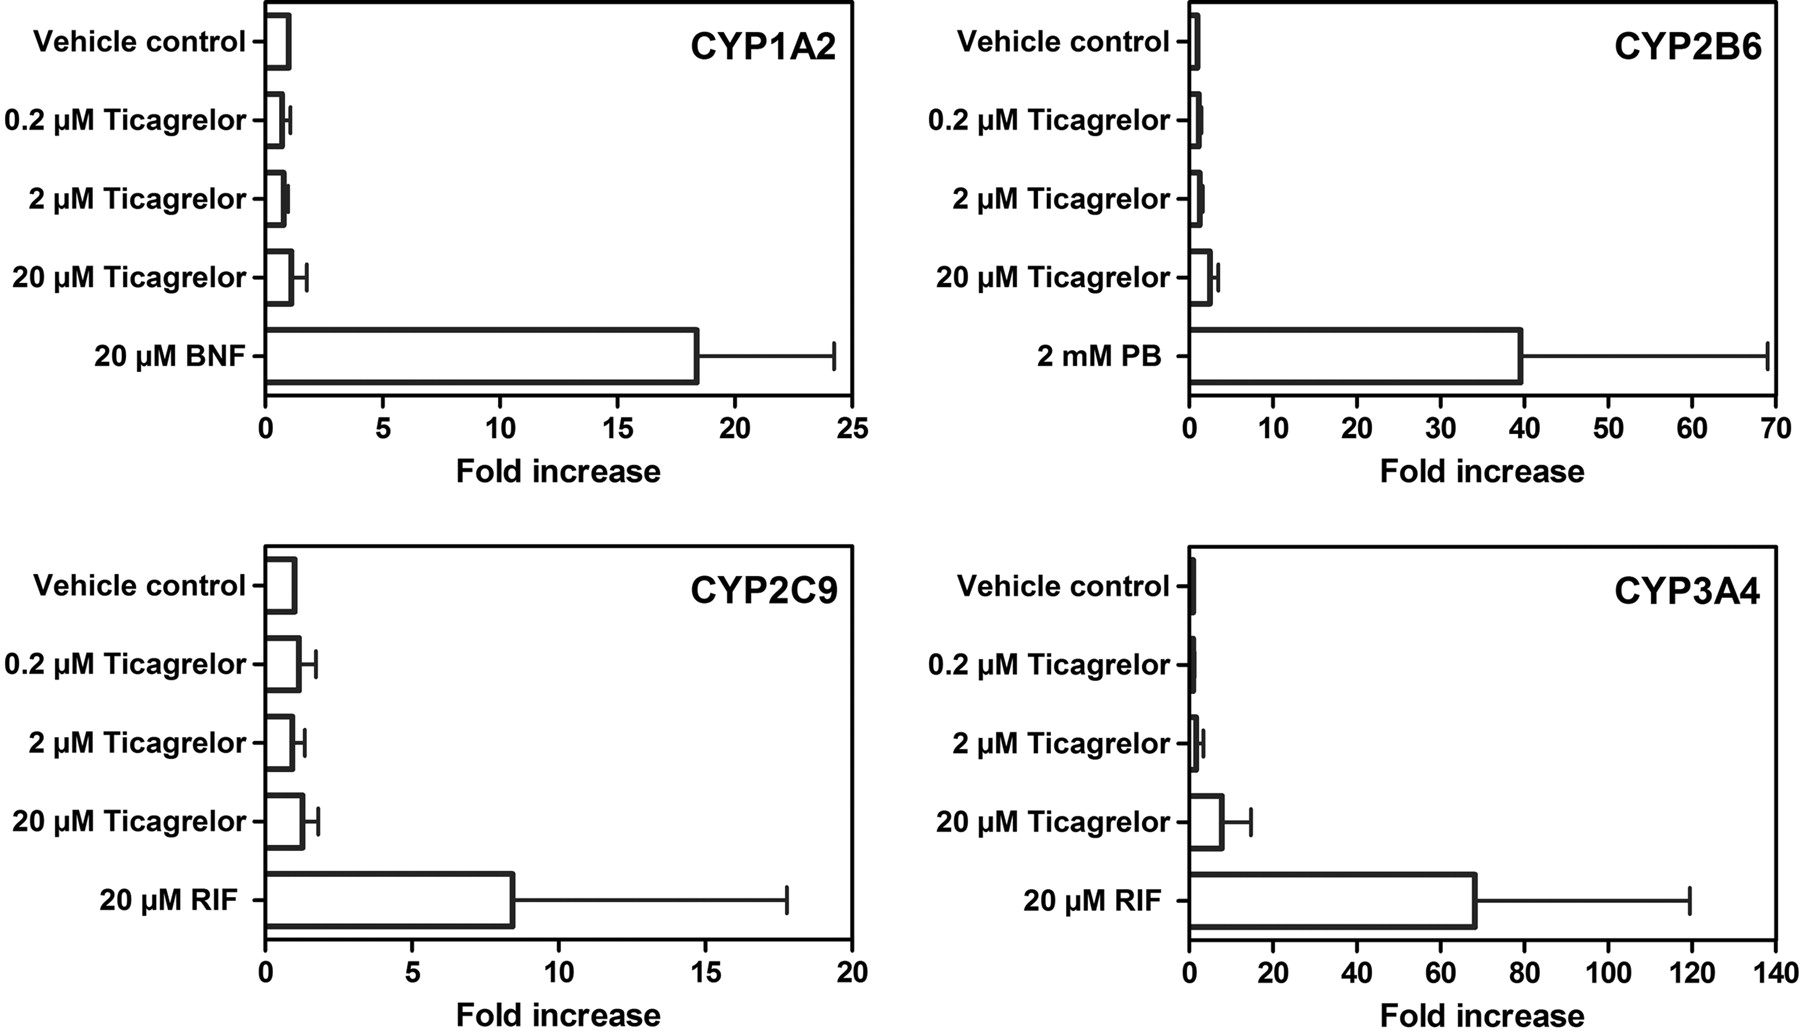
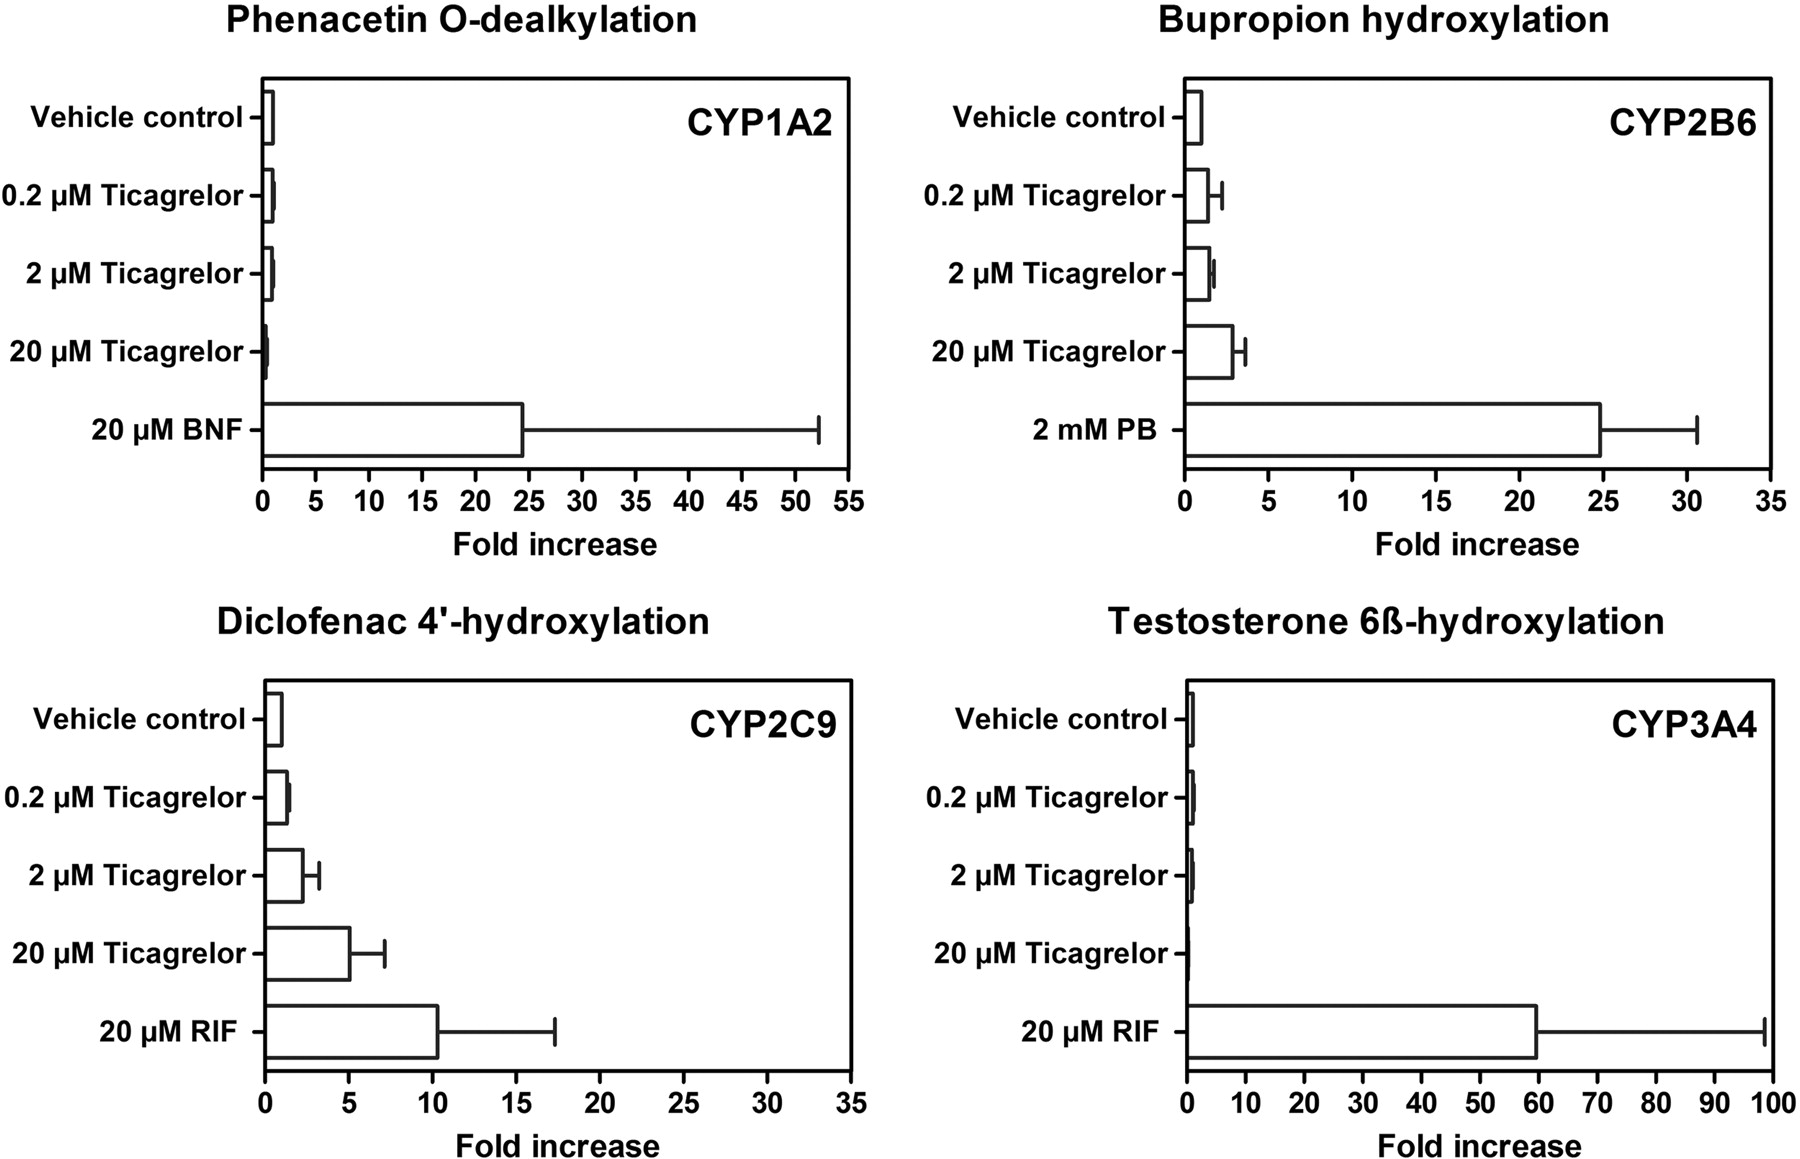
BNF, PB, RIF, and RIF caused marked induction of CYP1A2 activity (5.2- to 56-fold), CYP2B6 activity (19- to 31-fold), CYP2C9 activity (5.0- to 18-fold), and CYP3A4 activity (15- to 84-fold), respectively, in hepatocytes from three individual donors (Fig. 8). No induction of CYP1A2 activity was observed after 0.2, 2, or 20 μM ticagrelor treatment. CYP1A2 activity data correlated reasonably well with those for mRNA (Fig. 9). No induction of CYP1A1 mRNA expression was observed after ticagrelor treatment at any concentration, whereas BNF increased CYP1A1 mRNA levels by 8.9-fold, when evaluated in one of the three donor cells.

Average microsomal enzyme activity of CYP1A2, CYP2B6, CYP2C9, and CYP3A4 in primary human hepatocyte cultures treated with ticagrelor (0.2, 2, and 20 μM) or positive control inducers (20 μM BNF, 2 mM PB, or 20 μM RIF) from three donors using P450-selective probe drugs.
Average CYP1A2, CYP2B6, CYP2C9, and CYP3A4 mRNA expression in primary human hepatocyte cultures treated with ticagrelor (0.2, 2, and 20 μM) or positive control inducers (20 μM BNF, 2 mM PB, or 20 μM RIF) from three donors [CYP3A4 was from two donors because the third donor exhibited an extreme potent positive response (>6000-fold) of CYP3A4 mRNA expression to the positive control rifampicin].
CYP2B6 activity was increased 2.1- to 3.6-fold by 20 μM ticagrelor treatment or an average of 13.4% of the PB response. Less than 3% of the PB-induced CYP2B6 activity was observed after 0.2 and 2 μM ticagrelor treatment (Fig. 8). A less than 3-fold CYP2B6 mRNA expression increase was observed in hepatocyte donors treated with 0.2, 2, or 20 μM ticagrelor or less than 10% of the PB response (Fig. 9), similar to CYP2B6 activity changes. A small concentration-related increase in CYP2C9 activity was observed with 0.2, 2, and 20 μM ticagrelor treatment in all three preparations of human hepatocyte cultures. The responses observed with 20 μM ticagrelor treatment were in the range of 36.5 to 55.9% of the RIF response (Fig. 8). However, no induction of CYP2C9 mRNA expression by treatment with ticagrelor was observed at any concentration tested in any donor (Fig. 9). No induction of CYP3A4 activity was observed in any of the three human hepatocyte preparations after ticagrelor treatment at concentrations up to 20 μM (Fig. 8). CYP3A4 mRNA expression did increase after treatment with ticagrelor but was less than 15% of the RIF response (Fig. 9).
Discussion
Ticagrelor is an orally active antiplatelet agent. AR-C124910XX is the major active metabolite observed in plasma, and AR-C133913XX is an inactive metabolite mainly found in urine. In the current study, the P450 enzymes involved in the conversion of ticagrelor to AR-C124910XX and AR-C133913XX in vitro were identified. Another purpose of this study was to explore the potential of ticagrelor to cause drug-drug interactions resulting from inhibition, inactivation, or induction of the human major P450 enzymes.
CYP3A4 and CYP3A5 appear to be the enzymes mainly responsible for the formation of the active ticagrelor metabolite, AR-C124910XX. CYP3A4 is also likely to be the major enzyme that forms AR-C133913XX, with less contribution from CYP3A5. Other P450 enzymes are likely to be much less important in the metabolism of ticagrelor. CYP3A4 is the predominant human hepatic and intestinal P450 isoform and is responsible for the metabolism of approximately 50% of clinically used drugs (Guengerich, 1999). CYP3A5 is polymorphic, whereas the CYP3A5*3 and CYP3A5*6 alleles are the variants that cause alternative splicing and protein truncation, resulting in the absence of CYP3A5 in certain subjects (Kuehl et al., 2001). CYP3A5 contributes approximately 17% of total hepatic CYP3A content in approximately 10% of Caucasians (Westlind-Johnsson et al., 2003). Drugs that modulate CYP3A4 and CYP3A5 activities (such as ketoconazole and diltiazem) and genetic differences in CYP3A5 expression in human volunteers and patients might affect the clearance of ticagrelor in vivo.
Ticagrelor moderately inhibited only CYP2C9 among the eight P450 enzymes evaluated in this study, with an apparent IC50 of 10.5 μM. The potential for in vivo drug-drug interactions against CYP2C9 substrates was accessed using the [I]/Ki approach according to the U.S. Food and Drug Administration (Draft guidance for industry: drug interaction studies—study design, data analysis and implications for dosing and labeling, 2006, http://www.fda.gov/downloads/Drugs/GuidanceComplianceRegulatoryInformation/Guidances/ucm072101.pdf) where [I] was the maximum concentration of total drug in the systemic circulation at steady-state (Cmax ss) to provide a worst-case prediction. After a 100-mg b.i.d. dose in humans, ticagrelor resulted in a steady-state Cmax concentration of 1.5 μM (Husted et al., 2006). Cmax/Ki was calculated for each P450 enzyme, assuming competitive or noncompetitive inhibition, i.e., Ki = IC50/2 (Table 3). Cmax/Ki is 0.28 for CYP2C9. Because this value is between 0.1 and 1, it is possible for ticagrelor to cause CYP2C9 inhibition in vivo. Therefore, a clinical drug-drug interaction trial was conducted between ticagrelor and the CYP2C9 substrate, tolbutamide. The results of this clinical study demonstrated that there was no significant effect of steady-state ticagrelor on the pharmacokinetics of single-dose tolbutamide or its metabolite, 4-hydroxytolbutamide. Cmax/Ki values were less than 0.1 for CYP1A2, CYP2B6, CYP2C8, CYP2C19, and CYP2E1 and 0.11 for CYP2D6 (Table 3), suggesting that ticagrelor has a low tendency to inhibit these enzymes in vivo.
P450 induction demonstrates significant interspecies differences, and primary human hepatocytes are the preferred model for enzyme induction studies because they relate to prediction of drug-drug interactions (LeCluyse, 2001). The current study demonstrated that ticagrelor is not an inducer of CYP1A2 or CYP3A4. Although ticagrelor caused more than a 2-fold induction in CYP2B6, the relative response did not exceed 15% of the positive control response in any of the three donors, indicating that ticagrelor is a weak inducer of CYP2B6. Even though a concentration-related CYP2C9 activity increase was observed in primary human hepatocyte cultures, only treatment at 20 μM ticagrelor exhibited 35.5 to 55.9% of the rifampicin response, whereas treatment at 0.2 and 2 μM exhibited less than 15% of the positive control response. Considering that 20 μM is approximately 13 times the Cmax concentration in vivo, the potential of ticagrelor at pharmacologically relevant concentrations to cause CYP2C9 or CYP2B6 inductive drug interactions is low.
Current antiplatelet agents, ticlopidine, clopidogrel, and prasugrel, have been reported to be mechanism-based inhibitors of CYP2B6 in vitro (Richter et al., 2004; Nishiya et al., 2009), which was further confirmed with clinical studies. Four days of pretreatment with clopidogrel (75 mg q.d.) increased the area under the curve (AUC) of bupropion by 60% in healthy volunteers, whereas 4 days of pretreatment with ticlopidine (250 mg b.i.d.) increased the AUC of bupropion by 85% (Turpeinen et al., 2005). A clinical study also showed that a 60-mg prasugrel loading dose, followed by a 10-mg daily maintenance dose for a 10 day pretreatment increased the AUC of bupropion by 18% and decreased the AUC of hydroxybupropion by 23% (Farid et al., 2008). Our study showed that ticagrelor was not a mechanism-based inhibitor of CYP2B6 and is not likely to cause interactions with drugs primarily metabolized by CYP2B6 in vivo.
Complex interactions were observed between ticagrelor and different CYP3A4/5 substrates. Ticagrelor exhibited partial inhibition toward testosterone 6β-hydroxylation, activation of 1′-hydroxylation, and inhibition of 4-hydroxylation midazolam in HLM. A similar differential kinetic pattern was observed in recombinant CYP3A4 in the presence of Cyt b5 but not in recombinant CYP3A5. In vitro activation of P450 enzymes is not uncommon (Hummel et al., 2004; Zhang et al., 2004), although regioselective heterotropic cooperativity has mainly been observed for CYP3A4. Testosterone has been reported to inhibit the 1′-hydroxylation of midazolam and stimulate the 4-hydroxylation pathway in HLM and recombinant CYP3A4 (Wang et al., 2000). Similar heterotropic activation/inhibition by testosterone toward midazolam and other benzodiazepines has also been demonstrated in intact human hepatocytes (Hallifax et al., 2008), suggesting that the activation effect of testosterone was not an artifact associated only with microsomes. A number of models including multiple binding domains/sites and multiple conformers (Koley et al., 1995; Ueng et al., 1997; Korzekwa et al., 1998) have been proposed to describe these experimental observations. However, these hypotheses mainly focus on the heterotropic cooperativity characteristics caused by an effector rather than on those by another protein. Cyt b5 usually acts as the source of the second electron in the P450 catalytic cycle, which enhances the activity of cytochrome P450 enzymes (Schenkman and Jansson, 2003). Cyt b5 has also been reported to decrease CYP3A4 substrate inhibition by triazolam (Schrag and Wienkers, 2001) or induce positive cooperativity of CYP3A4 in the metabolism of pyrene (Jushchyshyn et al., 2005). In addition, Cyt b5 has also been demonstrated to modulate a CYP3A4 conformational change to stimulate 7-benzyloxyquinoline metabolism (Kumar et al., 2005). Our study has revealed that the addition of Cyt b5 resulted in CYP3A4 activation of the metabolism of 1′-hydroxymidazolam. However, full appreciation of the complex interaction between ticagrelor and midazolam in CYP3A4 was beyond the scope of the current work.
In summary, the results of the current in vitro studies suggest that ticagrelor is mainly metabolized by CYP3A4 and CYP3A5 and has the possibility to be inhibited when coadministrated with potent CYP3A4/5 inhibitors. Ticagrelor demonstrated little potential to inhibit or induce the major human P450 enzymes except for the observation of a moderate inhibition of CYP2C9 activity in vitro. Based on these in vitro observations, clinical interaction studies between ticagrelor and CYP3A4/5 inhibitors (ketoconazole and diltiazem), inducer (rifampin), substrate (midazolam), or CYP2C9 substrate (tolbutamide) have been conducted in healthy volunteers. The results of these clinical drug-drug interaction studies are generally in good agreement with the in vitro observations obtained in this study but will be reported separately.
Authorship Contributions
Participated in research design: Zhou, Andersson, and Grimm.
Conducted experiments: Zhou.
Performed data analysis: Zhou, Andersson, and Grimm.
Wrote or contributed to the writing of the manuscript: Zhou, Andersson, and Grimm.
Acknowledgments
We thank Sara Schock, Bernard Lanoue, Malin Darnell, Katarina Rubin, Ia Hultman, Constanze Hilgendorf, and Helena Sjöberg for their technical support and George Zhang and colleagues at BD Gentest for the induction assessments.
Footnotes
This work was supported by AstraZeneca.
Article, publication date, and citation information can be found at http://dmd.aspetjournals.org.
doi:10.1124/dmd.110.037143.
-
ABBREVIATIONS:
- P450
- cytochrome P450
- HLM
- human liver microsomes
- Cyt b5
- cytochrome b5
- BNF
- β-naphthoflavone
- PB
- phenobarbital
- RIF
- rifampin
- AUC
- area under the curve
- CT
- threshold cycle.
- Received November 10, 2010.
- Accepted December 22, 2010.
- Copyright © 2011 by The American Society for Pharmacology and Experimental Therapeutics


