


Abstract
There is increasing interest in developing efficient screening platforms to predict drug-induced liver injury. Therefore, we explored a microscope-based analysis to quantitatively evaluate interaction of drugs with multidrug resistance-associated protein 2 (MRP2), essential for hepatic excretion of drugs in sandwich-cultured rat hepatocytes (SCRHs), using 5 (and 6)-carboxy-2′,7′-dichlorofluorescein (CDF) diacetate, which is intracellularly hydrolyzed to the fluorescent substrate CDF. Drug-MRP2 interactions were evaluated by measuring the fluorescence change in bile canaliculi in SCRHs in the presence or absence of MRP2 inhibitors using quantitative time-lapse imaging (QTLI) analysis. Fluorescence was negligible in SCHs from rat (r) Mrp2-deficient Eisai hyperbilirubinemic rat, suggesting that Mrp2 is primarily responsible for CDF accumulation. According to QTLI, rifampicin, cyclosporine, and 3-[[3-[2-(7-chloroquinolin-2-yl)vinyl]phenyl]-(2-dimethylcarbamoylethylsulfanyl)methylsulfanyl] propionic acid (MK-571) attenuated CDF accumulation in a concentration-dependent manner, with IC50 values (IC50, QTLI) of 3.02, 1.63, and 2.87 μM, respectively. The ratios of IC50 values obtained from the biliary excretion index over the IC50, QTLI were 1.34, 1.94, and 1.94, but ratios over IC50 values in CDF uptake by Mrp2-expressing membrane vesicles varied more: 6.69, 3.07, and 2.43 for rifampicin, cyclosporine, and MK-571, respectively. When the IC50, QTLI of rifampicin was corrected for the hepatocyte/medium distribution ratio, the relative ratio of IC50, VES/IC50, QTLI was reduced to 2.25 from 6.69 (20.2/3.02) and was close to the ratio for MK-571 (2.43, 6.96/2.87), which is thought to cross the plasma membrane by passive diffusion. Our results indicate that QTLI is a suitable method to evaluate drug-MRP2 interaction at the bile canalicular membrane, when the hepatocyte/medium distribution ratio in SCRHs is taken into account.
Introduction
The liver is a vital organ, serving to maintain blood sugar and amino acid levels, synthesize proteins, produce biochemicals such as bile salts essential for digestion, and detoxify xenobiotics and drugs. Not only bile salts but also many conjugated drugs are commonly excreted into bile via bile canalicular membrane transporters. Hence, interaction of conjugated drugs with these transporters may compromise bile salt homeostasis and the detoxification systems of the liver, resulting in severe drug-induced liver injury (Fattinger et al., 2001; Funk et al., 2001). Because unexpected drug-induced hepatotoxicity is one of the major reasons for withdrawal of candidate drugs from the market, there is an urgent need to establish evaluation systems to screen interaction of drugs with bile canalicular membrane transporters in liver to predict in vivo drug-induced hepatotoxicity. Furthermore, drug-drug interaction on transporters is of great interest in the clinical development of new drugs (Huang and Woodcock, 2010). However, it is cumbersome to quantitatively evaluate drug-transporter interactions in cytoplasm.
Currently available experimental models to evaluate biliary secretory processes of drugs include liver canalicular membrane vesicles (Tamai and Tsuji, 1987), isolated and cultured hepatocytes (Kukongviriyapan and Stacey, 1990), hepatocyte couplets (Graf et al., 1984), isolated perfused liver (Chandra et al., 2005), and transporter-deficient animal models (Tsuda-Tsukimoto et al., 2006). Use of fresh hepatocytes in culture to assess hepatic transport has gained much support in recent years. Hepatocytes cultured in a sandwich configuration were shown to become repolarized and to provide a good experimental model to assess hepatic functions associated with intact bile canaliculi (LeCluyse et al., 1994). Furthermore, biliary excretion of xenobiotics in long-term sandwich-cultured rat hepatocytes (SCRHs) correlates with in vivo biliary excretion (Liu et al., 1999). Another advantage of sandwich-cultured hepatocytes (SCHs) is that they can be used to evaluate the biliary excretion index (BEI), which is a measure of the excretion of the candidate compound relative to hepatic uptake (Liu et al., 1999). Despite these advantages of SCRHs, the method is unsuitable for simultaneous screening of candidate compounds because of the cumbersome processes required for bioanalysis of substrate drugs. Although interest in predicting possible interaction of drugs with bile canalicular efflux transporters is growing, currently available cell-free methods, such as membrane vesicles, are generally not suitable to predict the affinity of drugs for transporters from the plasma concentration, because the hepatic cell entry process is not taken into account. From this point of the view, SCHs have the advantage of including both the basolateral uptake and bile canalicular efflux transporters. Therefore, we considered that a new microscope-based method to quantitatively analyze drug-transporter interactions using a fluorescent probe specific to each bile canalicular transporter might be effective as the basis for an efficient and high-capacity screening system.
In the present study, we focused on MRP2, whose functional expression in bile canaliculi of both liver tissue and cultured hepatocytes is well established. MRP2 plays an essential role in regulation of the serum bilirubin level by eliminating its conjugate from the liver, because a genetic defect of MRP2 in humans leads to familial conjugated hyperbilirubinemia, known as Dubin-Johnson syndrome (Kartenbeck et al., 1996; Paulusma et al., 1997). In addition, MRP2 mediates efflux transport into bile of many structurally diverse xenobiotics and anticancer drugs in either intact or conjugated forms (Kato et al., 2008). We have shown that MRP2 plays an important role in the hepatobiliary secretion of drugs by using SCRHs (Fukuda et al., 2008, 2010). Therefore, interaction of drugs with MRP2 may cause drug-induced hepatobiliary adverse effects.
Several fluorescent substrates of MRP2, including 5 (and 6)-carboxy-2′,7′-dichlorofluorescein (CDF), have been reported. In hepatocytes, the esterified derivative, 5 (and 6)-carboxy-2′,7′-dichlorofluorescein diacetate (CDFDA), diffuses across basolateral membranes and is intracellularly hydrolyzed to CDF, which is excreted into bile via Mrp2 (Zamek-Gliszczynski et al., 2003). In the present study, a quantitative method to evaluate interaction of drugs with rat Mrp2-mediated CDF transport into the bile canaliculi formed in SCRHs was sought by use of a time-lapse imaging technique. On the basis of our proposed quantitative time-lapse imaging (QTLI)-based analysis, accumulated fluorescence in bile canaliculi was kinetically analyzed in the presence or the absence of an MRP2/Mrp2 inhibitor. The new method was found to permit reliable evaluation of drug-transporter interaction, as validated by comparison with the results for those of established kinetic assays, such as BEI measurement in SCRHs and the use of Mrp2-expressing plasma membrane vesicles.
Materials and Methods
Preparation of SCRHs.
Hepatocytes were isolated from male Wistar, Sprague-Dawley, and Eisai hyperbilirubinemic rats at the age of 7 to 8 weeks by means of the collagenase perfusion method. Animals were purchased from Sankyo Labo Service Corporation, Inc. (Tokyo, Japan). All animal experiments were performed in accordance with the Declaration of Helsinki and the guidelines of Kanazawa University for the care and use of laboratory animals. Rat hepatocytes were isolated and sandwich-cultured as described previously (Fukuda et al., 2008). Isolated hepatocytes were plated on collagen-coated tissue culture plates at a density of 0.89 to 1.06 × 10⁵ cells/cm2. Twenty-four hours later, Matrigel (BD, Franklin Lakes, NJ) was overlaid on the cells, and culture was continued for 3 more days under an atmosphere of 5% CO2 in air at 37°C. At this point, the preparation, which is designated as SCRHs, was used for experiments.
Quantification of CDF Accumulated in Bile Canalicular Spaces in SCRHs.
In general, SCRHs were incubated with transport buffer (125 mM NaCl, 4.8 mM KCl, 5.6 mM d-glucose, 1.2 mM CaCl2, 1.2 mM KH2PO4, 1.2 mM MgSO4, and 25 mM HEPES, adjusted to pH 7.4) containing CDFDA (10 μM). Time-lapse imaging was performed to observe the fluorescence of CDF accumulated in the bile canaliculi for up to 10 min under an automatic fluorescence microscope (BZ-9000; Keyence, Osaka, Japan) with an atmosphere of 5% CO2 in air at 37°C. The fluorescence was visualized by the microscope, using the BZ filter (excitation, 480 ± 30 nm; emission, 510 < nm) at 20× magnification; during QTLI, a fluorescence image was taken every 1 min with an exposure time of 22.2 ms by the attached 12-bit charge-coupled device camera system. Regions of interest (ROIs), where bile canaliculi were present, were identified by phase-contrast microscopy and defined by free-hand drawing in a section with an area of 150 × 150 μm2 within the entire visual field, by means of BZ-II analyzing software (Keyence). After subtraction of background fluorescence, accumulated fluorescence intensity obtained from eight ROIs in each section was added together and then averaged (per pixcel). The mean value from three individual sections was used to quantitate accumulated CDF in bile canaliculi in each image taken. The general method is illustrated in Supplemental Fig. 1. This quantitative time-lapse imaging-based analysis is designated as QTLI in the present study. Interaction of drugs with Mrp2-mediated CDF transport was evaluated by quantifying accumulated fluorescence in bile canaliculi in SCRHs in the presence or the absence of various concentrations of rifampicin, cyclosporine, and 3-[[3-[2-(7-chloroquinolin-2-yl)vinyl]phenyl]-(2-dimethylcarbamoylethylsulfanyl)methylsulfanyl] propionic acid (MK-571), which is a competitive inhibitor of both MRP1 and MRP2.
Measurement of BEI of CDF in SCRHs.
SCRHs were incubated with CDFDA at 37°C for 10 min with (+) or without (−) divalent ions (e.g., Ca2+and Mg2+). CDF was extracted as described previously (Fukuda et al., 2008). To achieve a Ca2+/Mg2+-free condition, both CaCl2 and MgSO4 were removed, and EGTA at the final concentration of 0.5 mM was added to the general transport buffer described above. Uptake was then performed. To quantify CDF accumulation, SCRHs were washed with ice-cold transport buffer at the end of uptake to remove bound CDF and lysed with 1% Triton X-100. The CDF concentration in the lysate was quantified using a microplate reader (ARVO X3; PerkinElmer Japan, Osaka, Japan) with a fluorescence filter for excitation (at 490 ± 10 nm) and for emission (at 535 ± 25 nm). For taurocholate, radioactivity was quantified with a liquid scintillation counter (LSC-5100; Aloka, Tokyo, Japan). BEI (percentage) was obtained as in eq. 1:
 where CDF (+Ca2+) and CDF (−Ca2+) represent apparent uptake in the presence and absence of divalent cations (Ca2+ and Mg2+), respectively.
CDF Uptake by Transporter-Expressing Membrane Vesicles.
Transporter-mediated CDF uptake was studied by using membrane vesicles prepared from insect Sf9 cells expressing rat and human MRP2, rat Bcrp, and rat Bsep (Genomembrane Inc., Yokohama, Japan). In general, membrane vesicles were incubated with reaction buffer (50 mM MOPS, 70 mM KCl, 7.5 mM MgCl2, and 200 mM glutathione, adjusted to pH 7.42) at 37°C for 3 min in the presence of 5 mM AMP (control) or ATP. At the end of uptake, the reaction was stopped by addition of ice-cold buffer (40 mM MOPS and 70 mM KCl), and membrane vesicles were trapped on the filter (HAWP02500; Millipore Corporation, Billerica, MA) by means of a rapid filtration method. To evaluate the direct effect of inhibitor, Mrp2-mediated CDF uptake was measured in the presence or absence of various concentrations of inhibitor in the transport medium. Finally, extracted CDF was quantified with a microplate reader (ARVO X3). ATP-dependent MRP2-mediated transport was expressed as the difference between the intravesicular accumulations of CDF in the presence of AMP and ATP.
Estimation of Intracellular Concentration of Rifampicin in SCRHs.
Intracellular accumulation of rifampicin by SCRHs for 5 min was measured by HPLC. Rifampicin uptake by SCRHs was performed in the absence of divalent ions as described above. Separation was achieved with an analytical column (Cica Mightysil RP-18 GP Aqua, 250 × 4.6 mm; Kanto Kagaku, Tokyo, Japan) equipped with a guard column (Cica Mightysil RP-18 GP Aqua, 50 × 4.6 mm; Kanto Kagaku). Rifampicin was detected by a UV detector at set at 254 nm (Alliance 2690 separation module/2487 dual absorbance detector; Waters, Milford, MA). The mobile phase consisted of methanol and 10 mM phosphate buffer pH 3.0 (60:40; v/v), and the flow rate was 1 ml/min. The intracellular accumulation of rifampicin obtained was divided by cellular volume (per milligram of protein), which was determined by subtracting [14C]inulin uptake (a marker for extracellular fluid) from steady-state [3H]H2O uptake by SCRHs in Ca2+/Mg2+-free buffer. The intracellular concentration of free rifampicin in SCRHs was estimated by measuring the ratio of the bound to unbound form (Cb/Cub) in different concentrations of rat hepatocyte homogenates [10, 20, 30, and 50% (w/v)] by means of an ultrafiltration method using Ultracel YM-30 (Millipore Corporation). The ratio at 100% homogenate was linearly extrapolated from the observed values. The unbound tissue ratio (fT) of rifampicin was obtained as in eq. 2:

Data Analysis.
Student's t test was used to assess the significance of difference between in vitro assay results, with p < 0.05 as the criterion of significance. To estimate IC50 values of inhibitors, the inhibitory effect of inhibitor drugs on substrate drug (indicated as % control) in the SCRH assay and membrane vesicle assay was fitted to eqs. 3 and 4, respectively,
 where Imax, [I], and IC50 are the maximum inhibitory effect of inhibitor, inhibitor concentration, and concentration required to inhibit 50% of the fluorescence accumulation measured by QTLI or BEI, respectively,
 where [I] and IC50 are the inhibitor concentration and the concentration required to inhibit 50% of the CDF uptake by membrane vesicles, respectively.
Results
Visualization of Mrp2 Activity in SCRHs.
When SCRHs were incubated with CDFDA (10 μM), fluorescence per pixel of accumulated CDF in the bile canaliculi was monitored by time-lapse imaging every 1 min for up to 5 min, and the quantity of accumulated CDF was expressed in terms of the fluorescence in the ROIs measured by QTLI after subtraction of background fluorescence from cytoplasm or a blank area in the visual field. The fluorescence accumulated in a time-dependent manner for up to 5 min (Fig. 1). To evaluate the variability of accumulated fluorescence according to location within the entire visual field, the field was divided to 12 sections of 150 × 150 μm2 (no. 1 through 12; Fig. 1, inset), and the fluorescence was determined in each section every 1 min for up to 5 min (Fig. 1). The variability of accumulation obtained from eight ROIs in each section was characterized by the coefficient of variation (CV) at all the time points at which images were taken. The CV was relatively small, ranging from 12.3 to 15.2%, as summarized (with S.D.s) in Table 1, suggesting that the quantification is reliable. Because variation of fluorescence determined by QTLI was not considered to be significant, we chose any three sections within the image to quantify the fluorescence in the following experiments.

CDF accumulation in bile canaliculi in SCRHs in 12 sections of the visual field. The inset shows a typical fluorescence image captured by the BZ-9000 microscope with 12 individual sections. The time course of fluorescence accumulated in bile canaliculi is shown for up to 5 min. The fluorescence was obtained from eight ROIs in each section (QTLI method). Each line represents the time-dependent change of fluorescence in one section (1–12). Each point represents the summation of the fluorescence obtained from eight ROIs in each section. Scale bar, 150 μm.
Variation of fluorescence intensity determined by QTLI from each section
CDF accumulation was visualized in SCHs from Wistar rats. SCRHs were incubated with CDFDA (10 μM) for 5 min at 37°C under 5% CO2 in air, and fluorescence images were taken every 1 min. Row fluorescence values in all 12 sections as shown in Fig. 1 (inset) were analyzed by QTLI as described under Materials and Methods. Each value shows the mean value of fluorescence (per pixel) from 12 sections with the S.D. and CV.
Because CDF is a known substrate of human and rat MRP2, we determined the contribution of Mrp2 to CDF accumulation in bile canaliculi in SCRHs. In the presence of the MRP2-specific inhibitor MK-571, at the concentration of 50 μM, no fluorescence was detectable at the bile canaliculi by means of fluorescence microscopy (Fig. 2A). CDF accumulation was further evaluated in SCHs from EHBRs that were hereditarily defective in Mrp2 function (Ito et al., 1997). CDF accumulation in bile canaliculi of SCH from EHBR was shown to be negligible by fluorescence imaging (Fig. 2B). As shown in Fig. 2C, the quantity of fluorescence in SDR hepatocytes reached a plateau after 5 min and was determined to be 354.3 ± 46 per pixel at 8 min, whereas the fluorescence was only slightly increased to 50.2 ± 23.4 per pixel in EHBR hepatocytes (Fig. 2C). Fluorescence intensity measured by QTLI in SCHs from SDRs and EHBRs corresponded well to the fluorescence images. Because BEI is an established index to evaluate hepatobiliary secretion of drugs, we further examined the effect of Mrp2 deficiency on the BEI of CDF by measuring CDF uptake by SCRHs in the presence or absence of divalent ions. As shown in Fig. 2D, the BEI obtained was 47.5% in SDR hepatocytes, whereas no difference between the uptakes in the presence and absence of divalent ions was observed in EHBR hepatocytes. This result suggested that accumulation of CDF into bile canaliculi is exclusively mediated by Mrp2. We also studied CDF uptake for 3 min by plasma membrane vesicles from Sf9 cells expressing rat bile canalicular membrane transporters, including rat Mrp2, Bsep, and Bcrp and human MRP2 in the presence of ATP or AMP. ATP-dependent uptake by Mrp2 was the greatest among rat ABC transporters and was 16.4-fold higher with ATP than that with AMP. Bcrp- and Bsep-mediated CDF uptakes were 29.0 and 6.9% of the Mrp2-mediated CDF uptake, respectively. Human MRP2-mediated CDF uptake was even greater than the Mrp2-mediated CDF uptake (Fig. 3), implying that this methodology is also applicable to human MRP2 in hepatocytes.

Contribution of Mrp2 to CDF accumulation in bile canaliculi formed in SCRHs. A, the effect of MK-571 on the CDF accumulation was visualized in SCHs from Wistar rats. SCRHs were incubated with CDFDA (10 μM) for 10 min at 37°C under 5% CO2 in air. Arrowheads represent CDF accumulation in the bile canaliculi. The pictures are representative of at least three individual experiments. B, CDF accumulation was measured in SCHs from SDRs and EHBRs for up to 8 min. Each image was taken after incubation with CDFDA (10 μM) for the indicated time at 37°C under 5% CO2 in air. C, time course of the fluorescence obtained by QTLI is shown in SCHs from SDRs (●) and EHBRs (○). Each point represents the mean value of fluorescence obtained from three sections ± S.E.M. D, accumulation of CDF was measured in SCHs from SDRs and EHBRs in the presence (■) or absence (□) of divalent ions. Each column represents the mean ± S.E.M. (n = 3). *, p < 0.05 (+Ca2+ versus −Ca2+, Student's t test).
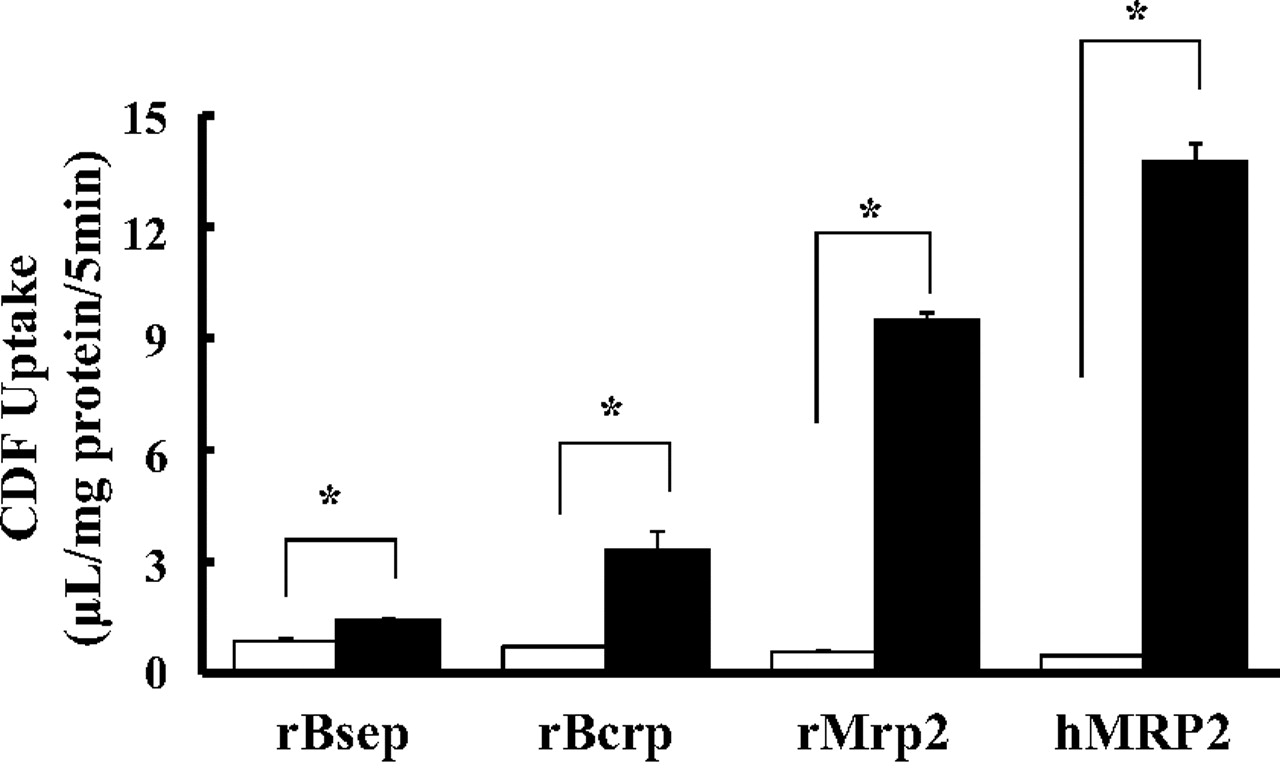
CDF uptake by membrane vesicles prepared from Sf9 cells expressing rat and human MRP2, rBsep, and rBcrp was measured, and then transporter-mediated CDF uptake was determined by subtracting the uptake in the presence of AMP (4 mM, □, as control) from that in the presence of ATP (4 mM, ■). Each column represents the mean ± S.E.M. (n = 3). *, significant difference from the control by Student's t test (p < 0.05).
To evaluate interaction of drugs with Mrp2 transport activity, three known substrates and/or inhibitors of MRP2, rifampicin, cyclosporine, and MK-571, were tested for the ability to inhibit CDF accumulation in the bile canaliculi in SCRHs. QTLI showed that the fluorescence intensity obtained at 3 min was decreased in a concentration-dependent manner in the presence of each inhibitor (Fig. 4, A–C). On the basis of the dose-dependent decrease in fluorescence intensity, the apparent IC50 values for rifampicin, cyclosporine, and MK-571 were estimated to be 3.02, 1.63, and 2.87 μM, respectively (Table 2; Fig. 4, D–F). To validate these IC50 values, we compared them with the IC50 values in the case of BEI. On the basis of the concentration-dependent effect of these inhibitors on the BEI of CDF, the IC50 values for rifampicin, cyclosporine, and MK-571were determined to be 4.06, 3.17, and 5.58 μM, respectively (Table 2). The values of the relative ratio, expressed as IC50, BEI/IC50, QTLI, were 1.34, 1.94, and 1.94, as summarized in Table 2. Differences between IC50, BEI and IC50, QTLI were within 2-fold for all three compounds, suggesting that evaluation based on QTLI is compatible with that using the established BEI method.

Effect of rifampicin (A), cyclosporine (B), and MK-571 (C) on CDF accumulation in bile canaliculi was visualized in SCRHs from Wistar rats. SCRHs were incubated with CDFDA (10 μM) for 3 min at 37°C under 5% CO2 in air. Dose-dependent inhibition of rifampicin (D), cyclosporine (E), and MK-571 (F) on the accumulated CDF fluorescence analyzed by QTLI was fitted to eq. 3 as described under Materials and Methods. SCRHs were incubated with or without the respective inhibitor for 3 min. Each point represents the mean ± S.E.M. (n = 15–21). *, significant difference from the control by Student's t test (p < 0.05).
IC50 values of rifampicin, cyclosporine, and MK-571 for Mrp2-mediated CDF transport obtained by three different methods
The table summarizes all IC50 values obtained by the three methods. The relative ratio was calculated by dividing IC50, VES by IC50, QTLI. Each value represents the mean ± S.E.M.
Effect of Mrp2 Inhibitors on CDF Uptake by Mrp2-Expressing Membrane Vesicles.
Interaction of drugs with transport activity of MRP2 was characterized previously by using membrane vesicles prepared from cultured and isolated hepatocytes. We, therefore, studied the affinity of rifampicin, cyclosporine, and MK-571 for Mrp2-mediated CDF uptake by Sf9 cell-derived membrane vesicles expressing Mrp2. All three inhibitors reduced ATP-dependent Mrp2-mediated CDF uptake in a concentration-dependent manner (Fig. 5, A–C), with IC50 values of 20.2, 5.00, and 6.96 μM, respectively. The values of the relative ratio of IC50, VES/IC50, QTLI for rifampicin, cyclosporine, and MK-571 were calculated to be 6.69, 3.07, and 2.43, respectively (Table 2). The IC50 values tended to be higher than those estimated by the QTLI method. This result may be due to the difference between the intracellular and extracellular concentrations of inhibitors tested.

Effect of rifampicin (A), cyclosporine (B), and MK-571 (C) on the CDF uptake by membrane vesicles from Sf9 cells expressing Mrp2. CDF uptake by Mrp2-expressing membrane vesicles in the presence of various concentrations of Mrp2 inhibitors was measured. The Mrp2-mediated uptake was determined by subtracting the uptake in the presence of AMP from that in the presence of ATP. Dose-dependent inhibition of rifampicin, cyclosporine, and MK-571 on CDF uptake was fitted to eq. 4 as described under Materials and Methods. Data represent the mean ± S.E.M. (n = 3). *, significant difference from the control by Student's t test (p < 0.05).
Estimation of Intracellular Concentration of Rifampicin in SCRH.
Among the three inhibitors tested, we further examined intracellular concentration of rifampicin in SCRHs, because rifampicin was reported to be taken up into the liver by organic anion-transporting polypeptides (OATPs) present at sinusoidal membranes (Tirona et al., 2003). First, the cell volume was evaluated as 2.45 μl/mg based on the uptakes of [3H]H2O and [14C]inulin by SCRHs. Next, the unbound fraction of rifampicin in hepatocytes (fT) was estimated to be 0.153. Finally, the intracellular concentration of rifampicin was quantified by HPLC analysis after incubation of cells with various concentrations of rifampicin (Table 3). The hepatocyte/medium distribution ratio of rifampicin (termed Kp, SCRH) was calculated by dividing intracellular concentration by outer medium concentration, and values of 13.7, 14.8, and 19.4 were obtained at the concentrations of 0.5, 1.0, and 5.0 μM in the medium, respectively. Although Kp, SCRH tended to increase with increasing medium concentration, the concentration of the unbound form of rifampicin could reach 8.96 μM when the highest Kp, SCRH was applied. Taking into account the cellular accumulation and intracellular binding, the relative ratio of rifampicin was reduced to 2.25, i.e., similar to the value (IC50, VES/IC50, QTLI) for MK-571, which is considered to cross the plasma membrane by passive diffusion.
Hepatocyte/medium ratio (Kp, SCRH) and estimated unbound concentration of rifampicin in SCRHs
Kp, SCRH was obtained by dividing rifampicin concentration by the concentration in the medium. Finally, estimated unbound rifampicin concentration was calculated by multiplying Kp, SCRH by the unbound fraction of rifampicin in hepatocytes (0.153).
Discussion
In the present study, we aimed to develop a microscope-based method for quantitative analysis of hepatobiliary transporter activity, which is important because it affects the pharmacokinetics of xenobiotics, and drug-transporter interactions may cause liver injury. With this aim in mind, we focused on MRP2 function, because an established fluorescent substrate, CDF, is available. Through the entire study, we carefully adjusted exposure time with a green filter for CDF so that quantification was not influenced by any color saturation in fluorescence detection. We, therefore, have shown that our QTLI-based analysis method is a reliable tool to characterize the interaction between compounds of interest and Mrp2 present at the bile canalicular membranes, using CDF as a probe substrate in SCRHs. This method is considered to be superior to previous methods, such as BEI measurement and membrane vesicle assay, in the following respects: 1) tedious bioanalysis for the substrate tested (e.g., by HPLC or radioactivity quantification) after extraction from cell homogenate is unnecessary, 2) alteration of fluorescence can be monitored over time in the same cells in a single well, and 3) bile canalicular accumulation of the substrate can be reliably detected independent of intracellular accumulation. Our successful application of the QTLI method here suggests that the method can be easily adopted for use in efficient screening systems and ultimately for high-throughput systems.
The first challenge was to validate the quantification based on bile canaliculi within the visual field, because it was impossible to detect fluorescence accumulated in all bile canaliculi in the preparation. The most comprehensive guiding principles, published in the Conference Report of the Washington Conference on Analytical Methods Validation for Bioavailability, Bioequivalence and Pharmacokinetic Studies, recommend that accuracy and precision for method validation should not exceed 15% CV (Shah et al., 1992). In our QTLI method, the precision for the total fluorescence intensity per pixel in eight ROIs defined on the basis of phase-contrast images of bile canaliculi in any section was approximately 15% at most. Therefore, this method could allow us to successfully average fluorescence accumulated in bile canaliculi distributed throughout the visual field, permitting quantification of CDF accumulation by time-lapse imaging observation. Moreover, our data clearly demonstrate that Mrp2 is exclusively responsible for CDF accumulation in bile canaliculi (Fig. 2). Therefore, we further evaluated the applicability of this method for assessment of drug-drug interaction on Mrp2 in intact hepatocytes.
In mammalian hepatocytes, influx drug transporter proteins present at sinusoidal membranes of hepatocytes include the sodium taurocholate cotransporting polypeptide, organic anion transporters (OATPs), and cation transporters. We have previously shown that several OATP molecules contribute to the hepatic uptake of a wide variety of clinically important drugs (Nakakariya et al., 2008a,b). Thus, OATPs have also been recognized as sites of drug-drug interaction in the liver (Zhang et al., 2006). If we use a fluorescent Mrp2 substrate whose entry is influenced by these transporters, a test inhibitor may disturb the entry of the substrate into hepatocytes, thereby compromising kinetic quantification of the interaction between them. Therefore, in the present study, we used CDFDA, which crosses the plasma membrane predominantly by simple diffusion, because of its high lipophilicity. This feature is favorable for our proposed QTLI, because CDFDA uptake by hepatocytes was assumed to not be affected by the inhibitors tested. In addition, CDFDA is not fluorescent itself, but becomes fluorescent after having been hydrolyzed to CDF by intracellular esterases. This feature is also favorable for a probe for QTLI based on determining fluorescence that is susceptible to inhibitors. In the present study, there is a concern that a compound tested may inhibit the hepatic enzyme responsible for the CDF formation, resulting in decreased accumulation of fluorescence. In a previous study, Vallejo et al. (2006) reported that BSEP-mediated efflux of cholic acid from Xenopus oocytes coexpressing BSEP and carboxylesterase 1 when they were exposed to the methyl ester of cholic acid was inhibited by neither rifampicin (50 μM) nor cyclosporine (10 μM). Therefore, we assumed that no significant interference occurs in formation of CDF in SCRH in the presence of these drugs. MK-571 is an established inhibitor selective for both MRP1 and MRP2, and the present study showed that the IC50, BEI for MK-571 was comparable to the IC50, VES. Because carboxylesterase does not matter, with the affinity obtained from the vesicle study using CDF itself, it was considered that MK-571 does not influence the formation of CDF. Thus, inhibition of CDF accumulation by all three inhibitors was thought to be due to a competitive inhibition of Mrp2. In the future, it may be necessary to develop a way to load fluorescent substrate of a transporter of interest into hepatocytes by endocytosis/pinocytosis to allow us to test compounds without limitation.
CDF was reported to be a substrate of MRP3/Mrp3, so it may be extruded to sinusoidal blood by Mrp3 present at the basolateral membranes of rat hepatocytes (Zamek-Gliszczynski et al., 2003). Hence, it is possible that expression of Mrp3 may affect CDF accumulation in bile canaliculi. Although increased hepatic and renal expression of Mrp3 has been reported in EHBRs (Kuroda et al., 2004), the CDF uptake in the presence of Ca2+ showed no difference between SCHs from SDRs and EHBRs (Fig. 2D), indicating that the contribution of Mrp3-mediated efflux from cells is likely to be small and may have little impact on Mrp2-mediated CDF accumulation in bile canaliculi. In addition, an immunohistochemical study confirmed that MRP3 was not detectable in the canalicular membrane domain in hepatocytes (König et al., 1999). Thus, Mrp3 may make little contribution to CDF efflux involving bile canaliculi. Furthermore, to evaluate the contribution of other bile canalicular ABC transporters to the CDF accumulation, CDF uptake was measured in membrane vesicles expressing Mrp2, Bcrp, or Bsep. CDF uptake mediated by Bsep was significantly less than that by Mrp2, whereas CDF uptake by Bcrp was approximately 29.0% of that by Mrp2, showing that CDF is a substrate of Bcrp (Fig. 3). In the current study, we used membrane vesicles prepared from insect Sf9 cells expressing ABC transporters. Because we have shown that Mrp2 transport activity in the same system corresponded well with its in vivo function (Kato et al., 2008), it was thought that these results reflect physiological function of these transports. Indeed, results obtained from Bcrp-expressing vesicles are consistent with the findings in Bcrp(−/−) mice (Nezasa et al., 2006). Although we were not able to prepare rMdr1-expressing membrane vesicles, so far there has been no report indicating that CDF is a substrate of rat and human MDR1. Therefore, QTLI is a promising approach for the evaluation of drug interaction with Mrp2 present at the bile canalicular membrane. Our reverse transcription-polymerase chain reaction assays indicated that Bcrp expression is much lower than that of Mrp2, Mdr1a/b, or Bsep in SCRHs (data not shown), implying that the contribution of Bcrp-mediated transport to the net fluorescence of CDF would have had only a marginal effect on the QTLI in the current study.
When the IC50 values of MRP2 inhibitors obtained by means of three different methods were compared, there were greater differences in the IC50 values between the QTLI (Fig. 4, D–F) and plasma membrane vesicle methods (Fig. 5, A–C) than between the QTLI and BEI (Table 2) methods. The relative ratio of IC50, VES/IC50, QTLI for rifampicin was 6.69, which was the highest among the three methods. The reason may be the difference between the extra- and intracellular concentrations, because IC50, QTLI was calculated on the basis of the concentration in the incubation medium. Rifampicin is known to be a substrate of hepatic-basolateral organic anion-transporting polypeptides, human OATP1B1 and OATP1B3 and rodent Oatp1b2 (Tirona et al., 2003). Therefore, we measured the intracellular concentration of rifampicin to determine whether it is concentratively accumulated in SCRHs. Indeed, the Kp, SCRH of rifampicin ranged from 13.7 to 19.4, when its concentration in the medium was 0.5 to 5.0 μM (Table 3). Thus, intracellular concentrative accumulation of rifampicin evidently occurs. The IC50 value based on the intracellular concentration of unbound rifampicin was estimated to be at most 8.96 μM, when the concentration of rifampicin in the medium was equivalent to the IC50, QTLI obtained by QTLI (3.02 μM). The ratio of IC50, VES to the corrected IC50, QTLI calculated by considering the intracellular concentration was decreased from 6.69 to 2.25, i.e., to a level similar to the ratio for MK-571 (2.43; Table 2), which is considered to cross membranes by passive diffusion. However, there is still some difference between the IC50 values. This could be a consequence of hepatic distribution from blood, which cannot be detected by plasma membrane vesicle methods, and inaccuracy in the estimation of the intracellular free fraction. Another possible explanation is that Mrp2-mediated CDF accumulation in hepatocytes could be inhibited with different affinity by intact and metabolized rifampicin species, whereas only intact rifampicin interacts with Mrp2 in cell-free assay systems, such as the membrane vesicle uptake assay. Previous studies have established a significant correlation between biliary excretion of xenobiotics in SCRHs and in vivo biliary excretion (Liu et al., 1999); however, such a correlation has not yet been established for hepatic uptake and intracellular enzyme kinetics. To clarify whether the observed disassociation in IC50 values between QTLI and membrane vesicles is explained by the ability of QTLI to reflect the biological functions of hepatocytes, further study is needed to establish the relation between in vitro and in vivo behavior of test inhibitors.
In conclusion, we have shown that QTLI-based analysis in the present study is useful for evaluation of the interaction of drugs with MRP2 transport activity at the bile canalicular membranes, and the results are consistent with those of the BEI and membrane vesicle methods, if the hepatocyte/medium ratio of the inhibitor is taken into account. There is increasing demand for establishment of highly efficient drug-screening systems that can identify unexpected drug-induced liver injury by candidate drugs. Our new microscope-based screening platform presented here is expected to be suitable for large-scale screening and analysis of interactions of candidate drugs with bile canalicular membrane transporter function in intact hepatocytes.
Authorship Contributions
Participated in research design: Nakanishi, Shibue, Fukuyama, Yoshida, Fukuda, Shirasaka, and Tamai.
Conducted experiments: Nakanishi, Shibue, Fukuyama, and Yoshida.
Contributed new reagents or analytic tools: Nakanishi, Shibue, and Fukuyama
Performed data analysis: Nakanishi, Shibue, Fukuyama, Shirasaka, and Tamai.
Wrote or contributed to the writing of the manuscript: Nakanishi, Shibue, and Tamai.
Other: Nakanishi and Tamai acquired funding for the research.
Footnotes
This study was supported by the Uehara Memorial Foundation and Grant-in-Aid for Exploratory Research [Grant 21659038].
Article, publication date, and citation information can be found at http://dmd.aspetjournals.org.
doi:10.1124/dmd.111.038059.
↵
 The online version of this article (available at http://dmd.aspetjournals.org) contains supplemental material.
-
ABBREVIATIONS:
- SCRH
- sandwich-cultured rat hepatocyte
- SCH
- sandwich-cultured hepatocyte
- BEI
- biliary excretion index
- MRP/Mrp
- multidrug resistance-associated protein
- CDF
- 5 (and 6)-carboxy-2′,7′-dichlorofluorescein
- CDFDA
- 5 (and 6)-carboxy-2′,7′-dichlorofluorescein diacetate
- QTLI
- quantitative time-lapse imaging
- ROI
- region of interest
- MK-571
- 3-[[3-[2-(7-chloroquinolin-2-yl)vinyl]phenyl]-(2-dimethylcarbamoylethylsulfanyl)methylsulfanyl] propionic acid
- Bcrp
- breast cancer resistance protein
- BSEP/Bsep
- bile salt efflux pump
- MOPS
- 4-morpholinepropanesulfonic acid
- HPLC
- high-performance liquid chromatography
- CV
- coefficient of variation
- r
- rat
- EHBR
- Eisai hyperbilirubinemic rat
- SDR
- Sprague-Dawley rat
- ABC
- ATP-binding cassette
- OATP
- organic anion-transporting polypeptide
- MDR/Mdr
- multidrug resistance.

- Received January 7, 2011.
- Accepted March 15, 2011.
- Copyright © 2011 by The American Society for Pharmacology and Experimental Therapeutics


