


Abstract
Treatment of rats with the microsomal enzyme inducers pregnenolone-16α-carbonitrile (PCN), 3-methylcholanthrene (3-MC), and Aroclor 1254 [PCB (polychlorinated biphenyl)] has been shown to decrease circulating levels of thyroid hormones as well as increase microsomal glucuronidation of thyroxine (T4). In addition, PCN increases triiodothyronine (T3) uridine diphosphate glucuronosyltransferase (UGT) activity. Members of the UGT1A family are believed to glucuronidate T4, specifically UGT1A1 and UGT1A6, whereas the UGT2 family is believed to glucuronidate T3, namely UGT2B2. The purpose of this study was to determine whether the aforementioned microsomal enzyme inducers increase the mRNAs that encode these and other UGT enzymes in rat liver. Male Sprague-Dawley rats were fed a control diet or a diet containing PCN (1000 ppm), 3-MC (250 ppm), or PCB (100 ppm) for 7 days, at which time livers were collected. Increases in mRNA were detected by QuantiGene branched DNA signal amplification. A 3-fold increase in UGT1A1 mRNA was produced by PCN in addition to increases in UGT1A2 (4-fold) and UGT1A5 (2-fold) mRNA. PCN affected neither UGT2B2 nor any other UGT2B mRNA level. 3-MC and PCB increased UGT1A6 mRNA 6- and 4-fold, respectively. 3-MC and PCB each increased UGT1A7 mRNA 4-fold but did not significantly increase any other UGT mRNAs. These findings suggest that PCN enhances T4 UGT activity by increased expression of UGT1A1 and that 3-MC and PCB enhance T4 UGT activity by increased expression of UGT1A6. These findings also suggest that increased T3 UGT activity produced by PCN is due to a mechanism other than increased transcription of UGT2B2, possibly increased UGT2B2 protein or induction of another UGT enzyme.
Conjugation with glucuronic acid is responsible for deactivation and elimination of a diverse range of lipophilic xenobiotics and endogenous compounds, including drugs, environmental chemicals, carcinogens, vitamins, bilirubin, steroid hormones, thyroid hormones, and glycolipids (Dutton, 1980; Clarke and Burchell, 1997). This broad range of glucuronidation activity involving numerous structurally unrelated compounds can be attributed, in part, to heterogeneity of the UDP-glucuronosyltransferase (UGT1) enzymes that catalyze the reaction (Meech and Mackenzie, 1997). Although not fully characterized, differences in tissue distribution, ontogeny, and chemical inducibility of the various UGTs appear to be the result of independent regulation of individual UGT expression (Marie and Cresteil, 1989; Haque et al., 1991; Emi et al., 1995; Clarke and Burchell, 1997; Gueraud et al., 1997; Hansen et al., 1998; Vargas et al., 1998; Grams et al., 2000; Metz et al., 2000).
UGTs have been separated into two major families in rodents and humans based on their gene organization and percent identity (Mackenzie et al., 1997). Members of family 1 are products of a single gene (Emi et al., 1995), whereas members of family 2 are products of distinct genes (Mackenzie and Rodbourn, 1990; Haque et al., 1991). Currently, 16 rat and 19 human UGTs have been identified (including pseudogenes) that exhibit unique yet overlapping substrate specificity (Mackenzie et al., 1997; Tukey and Strassburg, 2000). The ceramide UDP-galactosyltransferase, UGT8, has also been cloned in rat and human. Substrate specificity for thyroid hormones triiodothyronine (T3) and thyroxine (T4) has been studied utilizing the Gunn rat, which possesses a mutation resulting in the loss of all UGT1A enzymes, and the Wistar LA rat that specifically lacks UGT2B2, the enzyme responsible for androsterone glucuronidation (Corser et al., 1987; Iyanagi, 1991). Impairment in T4 glucuronidation was observed in the Gunn rat with no effect on T3 glucuronidation (Visser et al., 1993b). However, T3 UGT activity in the Wistar LA rat was severely reduced, whereas T4activity was unaffected (Beetstra et al., 1991; Visser et al., 1993b). These data suggest that T3 and T4 are likely glucuronidated by different UGT enzymes: T4 by a member or members of the UGT1A subfamily and T3 by a member of the 2B subfamily, likely UGT2B2. Studies using V79 cells transfected with cDNA of UGT1-encoded human enzymes have shown a significant glucuronidation of iodothyronines by human bilirubin UGT (1A1) and phenol UGT (1A9), with rT3 and T4 preferred over T3 (Visser et al., 1993a). Investigation of T3 as a substrate for human androsterone UGT, UGT2B7, has not been reported.
Further studies evaluating microsomal enzyme inducers have demonstrated that the magnitude of enhanced T4 UGT activity varies with specific inducer treatment and that effects on T3 versus T4glucuronidation are differential (Barter and Klaassen, 1992; Hood and Klaassen, 2000). Clofibrate and pregnenolone-16α-carbonitrile (PCN), which increase bilirubin glucuronidation, and polychlorinated biphenyl (PCB), 2,3,7,8-tetrachlorodibenzo-p-dioxin, and 3-methylcholanthrene (3-MC), inducers of phenol glucuronidation, have been shown to increase T4 glucuronidation in rats (Barter and Klaassen, 1992; Visser et al., 1993c; Liu et al., 1995;Schuur et al., 1997). Of these, only PCN increased T3 glucuronidation (Hood and Klaassen, 2000). In the absence of purified or expressed enzyme studies clearly demonstrating which rat UGTs glucuronidate T3 and T4, the aforementioned studies strongly suggest that bilirubin UGT (UGT1A1) and phenol UGT (UGT1A6) glucuronidate T4 and that androsterone UGT (UGT2B2) glucuronidates T3. As such, the purpose of this study was to determine whether differential effects of enzyme inducers on thyroid hormone glucuronidation are due to differing effects on these UGT mRNAs by inducers of T4 glucuronidation (PCN, 3-MC, and PCB) versus inducers of T3glucuronidation (PCN).
Recently, a sensitive, specific, and reliable assay for measurement of mRNA has been reported, including the application of this assay in detecting differential expression of drug-metabolizing enzymes in rat liver, namely cytochromes P450 (Hartley and Klaassen, 2000). In this study, we utilize the QuantiGene branched DNA (bDNA) signal amplification assay for the measurement of UGT mRNAs. Because no thorough examination of the effect of PCN on known UGT mRNAs has been reported and because the identity of the UGTs responsible for glucuronidating T3 and T4has yet to be conclusively defined, the effect of PCN, 3-MC, and PCB on all UGT1A and UGT2B subfamily members in rat liver was measured.
Materials and Methods
Chemicals and Reagents.
16-Dehydropregnenolone, 3-MC, and Aroclor 1254 (PCB) were obtained from Steraloids, Inc. (Newport, RI), Sigma Chemical Co. (St. Louis, MO), and Chem Service, Inc. (West Chester, PA), respectively. PCN was synthesized from 16-dehydropregnenolone as previously described (Sonderfan and Parkinson, 1988). RNAzol B was obtained from Tel Test B (Friendswood, TX). All other reagents were obtained from Sigma or Fisher Scientific (Pittsburgh, PA).
Animals and Treatments.
Male Sprague-Dawley rats (Sasco, Wilmington, MA) weighing 150 to 200 g were randomly assigned to one of four groups of 12 animals each. Following a 1-week acclimation period, animals were placed on either a control diet or a diet containing one of the following inducers: PCN (1000 ppm), 3-MC (250 ppm), or PCB (100 ppm). Rats were allowed ad libitum access to food and water. On day 7, animals were decapitated, and livers removed and snap-frozen for RNA isolation.
Preparation of Total RNA.
Total RNA was isolated by RNAzol B reagent per the manufacturer's protocol and resuspended in diethyl pyrocarbonate-treated water. The concentration of total RNA in each sample was determined by ultraviolet absorbance at 260 nm. Each RNA sample was analyzed by formaldehyde-agarose (1.2% agarose, 2.1 M formaldehyde in 1× 4-MOPS, and 0.5 μg/mg ethidium bromide) gel electrophoresis. RNA integrity was verified by intact 18S and 28S rRNA visualized under ultraviolet light.
Development of Specific Oligonucleotide Probe Sets for bDNA Analysis of UGT mRNAs.
Two sets of oligonucleotide probes were designed for the 13 UGTs of interest and are denoted capture extenders and label extenders based on their function in the assay (Hartley and Klaassen, 2000). The UGT cDNA sequences utilized for the generation of specific oligonucleotide probe sets were obtained from the GenBank accession numbers listed in Table1, although multiple GenBank accession numbers exist for the same or portions of the same coding sequence for any given UGT gene. For UGT1A family members, the unique exon 1 region for each enzyme was utilized as the target region for probe design. For UGT2B family members, the entire coding region was utilized for probe design due to the high homology between these sequences. cDNA sequences were analyzed by ProbeDesigner Software version 1.0 (Bayer Diagnostics, formerly Chiron Diagnostics Corp., Emeryville, CA and East Walpole, MA). The number and type of probe produced for each enzyme were a function of the degree of dissimilarity between that sequence and other UGT sequences and were designed to be specific to only one UGT transcript. Blocker probes were eliminated due to the inability to generate multiple probes to continuous sequences of mRNA. To ensure minimal cross-reactivity with other rat sequences, every candidate probe was submitted to the National Center for Biotechnological Information for nucleotide comparison by the basic logarithmic alignment search tool [BLASTn; (Altschul et al., 1990)]. Oligonucleotides with a high degree of similarity (>80%) to other rat gene transcripts were eliminated from the design. The final number and complementary gene sequence location of the probes are listed in Table 1. Each oligonucleotide probe was designed with aTm of approximately 63°C to allow constant hybridization conditions of 53°C. Selected probes were synthesized on a 50-nmol synthesis scale by Operon Technologies (Alameda, CA) and obtained desalted and lyophilized. Probes were diluted in 1.0 ml of 10 mM Tris-HCl, pH 8.0, with 1 mM EDTA, and stored at −20°C. Prior to use in this study, probes were validated by examination of differential tissue expression in our laboratory. In addition, results obtained utilizing UGT1A1, UGT1A6, and UGT2B2 probe sets were validated by Northern blot analyses.
UGT gene, GenBank accession number, nucleotide target, and probe function for specific oligonucleotide probe sets
QuantiGene Assay.
The premise for this assay has been extensively described by Hartley and Klaassen (2000). Briefly, capture and label extender probe sets for each specific UGT were combined and diluted to 50 and 200 fmol/μl, respectively, in the lysis buffer supplied in the QuantiGene bDNA Signal Amplification Kit (Bayer Diagnostics, East Walpole, MA); the components of these reagents were published previously (Wang et al., 1997). All reagents for analysis (i.e., lysis buffer, capture hybridization buffer, amplifier/label probe buffer, washes A and D, and substrate solution) were supplied in the QuantiGene bDNA Signal Amplification Kit. Total RNA (10 μg) was added to each well of a 96-well plate with 100 μl of capture hybridization buffer and 100 μl of each diluted probe set. RNA was allowed to hybridize for at least 16 h at 53°C. Plates were then cooled to room temperature for 10 min and rinsed with wash A (400 μl). Samples hybridized with the bDNA amplifier molecules (50 μl/well) were diluted in amplifier/label probe buffer (1:100) for 30 min at 53°C. Plates were again cooled to room temperature and rinsed with wash A. Label probe (1:100 in amplifier/label probe buffer) was added to each well (50 ml/well) and hybridized to the bDNA-RNA complex for 15 min at 53°C. Plates were again cooled to room temperature and rinsed with wash A followed by wash D. Alkaline phosphatase-mediated luminescence was triggered by the addition of a dioxetane substrate solution (50 ml/well). The enzymatic reaction was allowed to proceed for 30 min at 37°C, and luminescence was measured with the Quantiplex 320 bDNA Luminometer (Bayer Diagnostics) interfaced with Quantiplex Data Management Software version 5.02 (Bayer Diagnostics) for analysis of luminescence from 96-well plates.
Data Analysis.
All values are reported in relative light units (RLU) and are expressed as the mean ± S.E. for n = 5 animals. Means were compared by one-way analysis of variance followed by Duncan's multiple range test. Statistical significance is reported at thep < 0.05 level.
Results
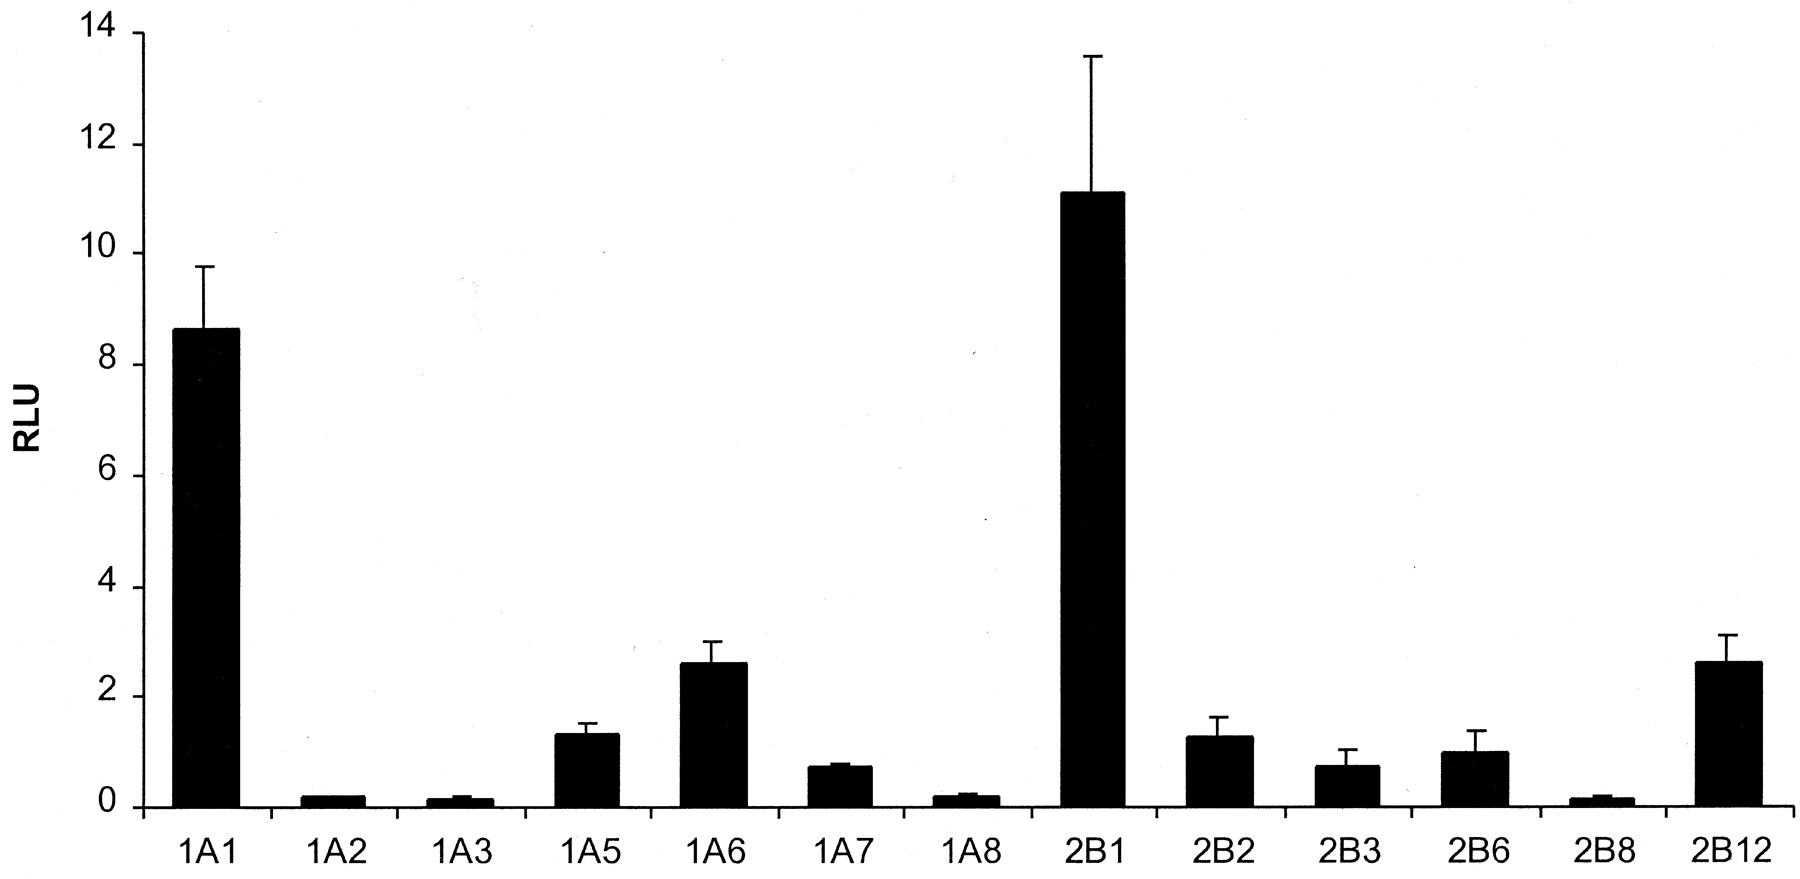
The comparative expression of control animal mRNA for 13 UGTs in rat liver is depicted in Fig. 1. In control animals, transcripts for nine UGTs were detected considerably above the probe background readings, which were on average between 0.1 and 0.2 RLU. These mRNAs were, in order of descending detection magnitude, UGT2B1, UGT1A1, UGT1A6, UGT2B12, UGT1A5, UGT2B2, UGT2B6, UGT1A7, and UGT2B3. Detection of UGT1A8, UGT1A2, UGT2B8, and UGT1A3 was at the lower limits for the assay in control animals. The magnitude of RLU detection of transcripts was not a function of the number of capture extender probes (R2= 0.1315; linear regression not shown) or label extender probes (R2 = 0.0248) in the probe set and is in agreement with what has been previously reported. Significant increases in mRNA following PCN, 3-MC, or PCB treatment were observed for five UGT enzymes, and are depicted in the subsequent Figs.2 through4. Differential expression of cytochrome P450 1A1, 2B2, and 3A1 mRNAs served as a positive control for chemical treatments (data not shown).

Relative expression of UGT isoform transcripts in control liver.
Messenger RNA levels are expressed as RLU. Values are the mean ± S.E.

Effect of PCN, 3-MC, and Aroclor 1254 (PCB) on mRNA expression of the UGTs that glucuronidate thyroid hormones: UGT1A1 (left panel), UGT1A6 (middle panel), and UGT2B2 (right panel).
Messenger RNA levels are expressed as RLU. Values are the mean ± S.E. ★, significantly different from control (p< 0.05).
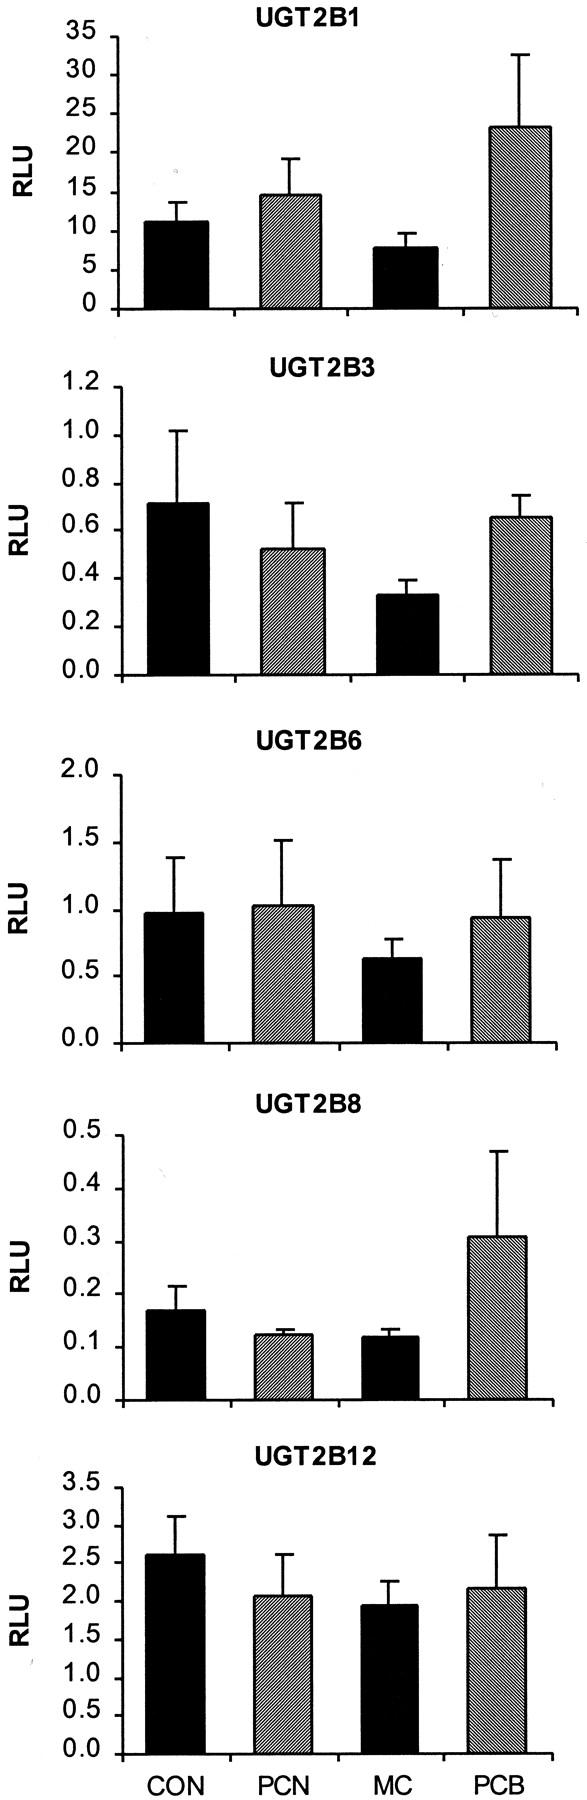
Effect of PCN, 3-MC, and Aroclor 1254 (PCB) on the mRNA expression of five UGT2B isoforms in rat liver.
UGT expression is depicted from top to bottom: UGT2B1, UGT2B3, UGT2B6, UGT2B8, and UGT2B12. Messenger RNA levels are expressed as RLU. Values are the mean ± S.E. ★, significantly different from control (p < 0.05).
The effect of enzyme inducer treatment on the three UGTs proposed to glucuronidate T4 (UGT1A1 and UGT1A6) and T3 (UGT2B2) is shown in Fig. 2. PCN produced a significant increase in UGT1A1 mRNA (3-fold), whereas neither 3-MC nor PCB had any effect. UGT1A6 mRNA was increased 6- and 4-fold by 3-MC and PCB treatments, respectively. UGT2B2 mRNA levels, in contrast, were not affected by treatment with any of the microsomal enzyme inducers, including PCN.
Figure 3 depicts the mRNA levels of the five remaining UGT1A subfamily members: UGT1A2, UGT1A3, UGT1A5, UGT1A7, and UGT1A8. UGT1A3 (Fig. 3, second from the top) and UGT1A8 (Fig. 3, bottom) mRNA were not detected in liver to any appreciable extent even following inducer treatment, although PCN treatment did appear to slightly increase UGT1A3 mRNA (<2-fold). Expression of UGT1A2 (Fig. 3, top), although negligible in control animal liver, was induced 4-fold following PCN treatment. UGT1A5 mRNA (Fig. 3, middle) was slightly increased by PCN treatment (2-fold). Although 3-MC and PCB had no effect on these transcripts, both treatments increased the expression of UGT1A7 in liver by 4-fold above control levels. PCN had no effect on UGT1A7 mRNA.
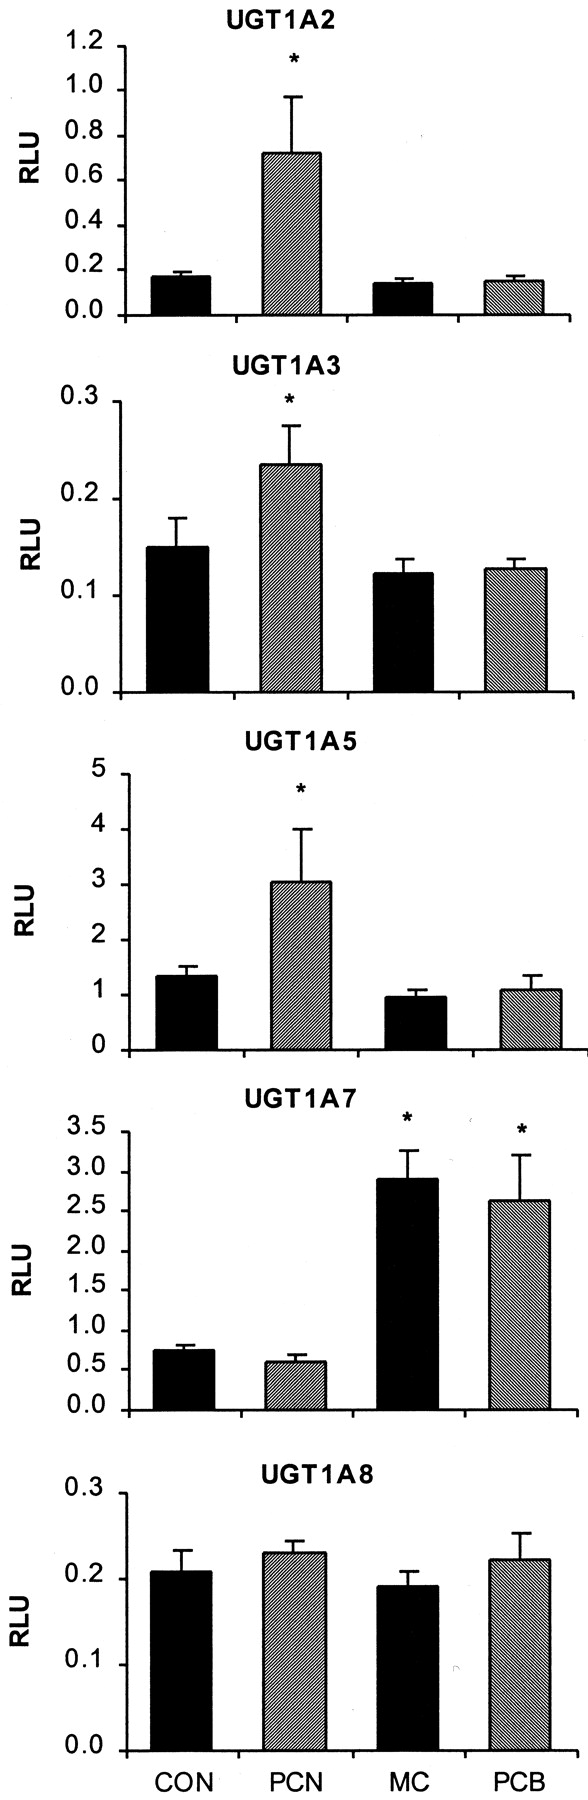
Effect of PCN, 3-MC, and Aroclor 1254 (PCB) on the mRNA expression of five UGT1A enzymes in rat liver.
Messenger RNA levels are expressed as RLU and are depicted from top to bottom: UGT1A2, UGT1A5, UGT1A6, UGT1A7, and UGT1A8. Values are the mean ± S.E. ★, significantly different from control (p < 0.05).
The effect of inducer treatment on transcripts of remaining UGT2B subfamily members (Fig. 4) was relatively minor. No significant elevation of any UGT2B mRNA was evident, although PCB tended to increase the expression of UGT2B1 (Fig. 4, top) and UGT2B8 (Fig. 4, second from bottom).
Discussion
The differential expression of UGT in rat liver has been the subject of repeated investigation. To date, seven UGTs have been shown to be inducible to varying degrees in rat liver: UGT1A1, UGT1A2, and UGT1A5 by glucocorticoids and fibrates (Emi et al., 1995; Masmoudi et al., 1996); UGT1A6 and UGT1A7 by polycyclic aromatic hydrocarbons and antioxidants (Buetler et al., 1995; Emi et al., 1995; Grove et al., 1997); and UGT2B1 and UGT2B12 by phenobarbital (Mackenzie et al., 1984;Green et al., 1995; Ishii et al., 1997). The present study demonstrates a novel approach for detecting differential expression of all rat UGTs in liver, namely QuantiGene branched DNA signal amplification (bDNA assay). Using this assay, it was shown that PCN increases the level of UGT1A1, UGT1A2, and UGT1A5 mRNA, whereas 3-MC and PCB increase the level of UGT1A6 and UGT1A7 mRNA. We have also demonstrated that no UGT2B subfamily member appears to be inducible by PCN, 3-MC, or PCB.
Functionally, these effects are likely to be most significant for UGT1A1 and UGT1A6, which, in addition to UGT2B1, were the highest expressed UGTs in untreated control (Fig. 1) or induced liver (Figs. 2and 4). UGT1A1 and UGT1A6 are reported to be two of the most constitutively and inducibly expressed UGTs in liver, respectively (Emi et al., 1995; Grams et al., 2000), which the data presented herein support. It is also true that UGT1A1 and UGT1A6 are the two UGT1A enzymes that are least homologous with other subfamily members. With the assay used, the possibility exists that the detection of mRNA may be a function of the quality of that designed probe set, which in turn is a function of the homology of that UGT gene with other family members. However, in addition to UGT1A1 and UGT1A6, the detection of other UGT1A mRNAs by the bDNA assay also agrees with previous reports.Emi et al. (1995) reported a lack of UGT1A3 and UGT1A8 in liver, a finding the present study also supports. Their investigation also reported no constitutive expression of UGT1A2, UGT1A5, and UGT1A7 in liver, although each of these UGTs was modestly inducible by dexamethasone, clofibrate, and 3-MC, respectively. Unlike Emi et al. (1995), our assay detected UGT1A5 and UGT1A7 in rat liver above background values as well as differential increases in these UGTs.Grams et al. (2000) recently detected the expression of UGT1A5 and UGT1A7 in rat liver using reverse transcriptase-polymerase chain reaction and Northern blotting. By bDNA signal amplification, UGT1A2 was also increased 4-fold by PCN, a novel finding. In addition, no correlation between the magnitude of the RLU detected and the number of probes included in the probe set was observed. The data presented demonstrate that we have established a sensitive and specific assay for UGT expression, capable of detecting differential expression of low-abundance transcripts.
The findings presented herein are relevant to thyroid hormone glucuronidation in a number of ways. T4 is a purported substrate for two rat UGTs, UGT1A1 and UGT1A6, determined by comparative studies using known substrates for these enzymes (Visser et al., 1993b,c). Based on the present findings, it may be reasoned that the increases in T4 glucuronidation following PCN treatment are due to an increase in UGT1A1 mRNA, whereas increases in T4 glucuronidation following 3-MC and PCB treatment are due to increases in UGT1A6 mRNA. 3-MC and PCB also increased UGT1A7, whereas UGT1A2 and UGT1A5 were increased by PCN. There are no reports indicating whether any thyroid hormones are substrates for these rat UGTs; UGT1A7 has been characterized as glucuronidating bulky planar substrates, including metabolites of benzo[a]pyrene (Grove et al., 1997). UGT1A2 and UGT1A5 substrates have not been well characterized, although UGT1A2 has been shown to glucuronidate bilirubin, albeit less so than UGT1A1 (Sato et al., 1990). Based on the predominate expression of UGT1A1 and UGT1A6, the assumption can be made that these are the relatively more important UGTs for T4 glucuronidation.
T3 is purported to be glucuronidated by UGT2B2 (Beetstra et al., 1991; van Raaij et al., 1993; Visser et al., 1993b). This activity is increased by PCN (Hood and Klaassen, 2000); however, no elevation of UGT2B2 mRNA by PCN was demonstrated in this study. This was not completely surprising, as previous examinations of UGT2B2 expression have reported no apparent induction following treatment with other classical microsomal enzyme inducers (Mackenzie, 1986). This finding has at least two possible implications. First, PCN could act to increase UGT2B2 by a mechanism other than increased gene transcription, such as protein stabilization. PCN has recently been shown to induce transcription of cytochrome P450 CYP3A in rats by binding to the pregnane-X-receptor (PXR) and activating transcription through binding to response elements located on these genes (Quattrochi et al., 1995; Huss and Kasper, 1998; Kliewer et al., 1998). To date, no PXR response elements have been located on UGT genes. Mechanisms for the action of PCN on genes other than cytochromes P450 have not been characterized. The potential for PCN to increase UGTs by a PXR-independent, posttranslational mechanism, in favor of or in addition to PXR response element activation, requires further investigation.
A second interpretation of the present findings is that another UGT enzyme glucuronidates T3, and that PCN-induced transcription of this UGT mRNA is responsible for the increase in T3 glucuronidation produced by PCN. According to our study, there are presently three remaining candidates: UGT1A1, UGT1A2, and UGT1A5. However, if T3 is glucuronidated by any of these three UGTs in vivo, the Gunn rat, which lacks all UGT1A enzymes, should have impaired T3-UGT activity. This is not the case (Visser et al., 1993b,c). It may be possible that elevation of one of these UGTs results in a measurable increase in T3glucuronidation that exceeds the constitutive level of T3 activity by UGT2B2. This possibility will need to be explored in vitro by examining the substrate specificity of T3 and T4 glucuronidation utilizing cDNA-expressed UGT enzymes. It is interesting to note that T3 is not the only substrate for which discrepancies exist between increases in UGT activity and induction of UGT mRNA. Glucuronidation of digitoxigenin-monodigitoxoside, a derivative of digitoxin, is reportedly increased 13-fold by PCN treatment (Watkins et al., 1982). However, PCN does not elicit that magnitude of response from any UGT mRNA. Furthermore, the UGT responsible for digitoxigenin-monodigitoxoside glucuronidation has yet to be identified, and may represent the induction of an uncloned UGT. Similarly, induction of T3 glucuronidation by PCN may be the result of an effect on an uncloned UGT2B enzyme.
Aroclor 1254, or PCB, is a mixture of polychlorinated biphenyls that possess both 3-MC-like and phenobarbital (PB)-like cytochrome P450 induction abilities (Parkinson et al., 1983). The current study demonstrates a 3-MC-like pattern of UGT mRNA elevation for PCB (increased UGT1A6 and UGT1A7 mRNA) but no apparent increase in PB-inducible UGTs (UGT1A1, UGT2B1, and UGT2B12). The mechanism of induction of UGT1A6 by 3-MC has been well described. A xenobiotic response element (XRE) on UGT1A6, responsible for transcriptional activation by polycyclic aromatic hydrocarbons, mediates de novo transcription of this gene (Emi et al., 1996; Masmoudi et al., 1997). Other mechanisms regulating chemical-mediated increases in UGT mRNA have been indirectly described (Marie and Cresteil, 1989; Roy et al., 1991) or are yet to be resolved (Vargas et al., 1998; Metz et al., 2000). This is the case for UGT1A7. Expression of liver UGT1A7 mRNA is increased following treatment with 3-MC and oltipraz, similar to UGT1A6 mRNA in response to these chemicals. However, no analogous XRE or transcriptional elements mediating the regulation of UGT1A7 by 3-MC or oltipraz have been identified in the upstream promoter region (Metz and Ritter, 1998). It is possible that UGT1A7 is under the regulation of the XRE in the UGT1A6 promoter. Nonetheless, the factors that underlie increases in UGT1A7 mRNA following 3-MC and PCB treatment, as well as the ability of PCB to exert dual 3-MC-like and PB-like effects on cytochrome P450 genes but a sole 3-MC-like effect on UGTs, remain to be determined.
A proposed consequence of increased liver UGT activity is the enhanced biliary excretion of iodothyronine glucuronides and subsequent reduction of circulating levels of thyroid hormone (McClain et al., 1988; Semler et al., 1989). Certain microsomal enzyme inducers may thereby produce prolonged elevations in serum thyroid-stimulating hormone, which may promote thyroid tumors in rodents (Hill et al., 1989; Capen, 1997). Although chemically mediated increases in thyroid hormone metabolism and reduction of serum hormone have been reported in humans (Fichsel and Knopfle, 1978; Ohnhaus and Studer, 1983; Curran and DeGroot, 1991), humans appear to be less susceptible than rodents to developing cancer from perturbations in thyroid-pituitary status (reviewed in U.S. Environmental Protection Agency, 1998). The differing sensitivities of rodents and humans to thyroid disturbances are likely derived from a number of their physiological differences, and species variation in glucuronidation is one suggested reason (Capen, 1997). Human UGTs 1A1, 1A9, and 2B7 are each inducible (Munzel et al., 1999;Ritter et al., 1999), but induction of these specific UGTs in the context of thyroid hormone glucuronidation has yet to be investigated. Further determination of mechanistic differences between rodent models and humans, and establishment of biomarkers such as individual UGT enzymes, will help to define chemical tumor-promoting capacities in rodents that do not exist in humans.
In conclusion, this study indicates that PCN and 3-MC increase rat UGT1A1 and UGT1A6 mRNAs, respectively. This further implies that increased T4 glucuronidation resulting from these inducers is due to increased transcription of these genes. Furthermore, our results also indicate that PCN does not increase T3 glucuronidation by transcriptional activation of UGT2B2.
Acknowledgments
We acknowledge Dr. Dylan Hartley for technical supervision of this project.
Footnotes
-
This study was supported by National Institutes of Health Grant ES-08156; Nichole R. Vansell was supported by National Institutes of Health Training Grant ES-07079.
- Abbreviations used are::
- UGT
- uridine diphosphate glucuronosyltransferase
- T4
- thyroxine
- T3
- triiodothyronine
- PCN
- pregnenolone-16α-carbonitrile
- 3-MC
- 3-methylcholanthrene
- PCB
- polychlorinated biphenyl
- bDNA
- branched DNA
- RLU
- relative luminescence units
- PXR
- pregnane-X-receptor
- XRE
- xenobiotic response element
- PB
- phenobarbital
- MOPS
- 4-morpholinepropanesulfonic acid
- Received July 31, 2001.
- Accepted November 27, 2001.
- The American Society for Pharmacology and Experimental Therapeutics


