


Abstract
We have tested a panel of 29 cDNA-expressed rat and human enzymes with 9 fluorometric substrates to determine the P450 isoform selectivity in the catalysis of the substrates to fluorescent products. The substrates examined were dibenzyl fluorescein, 7-benzyloxyquinoline (BQ), 3-cyano-7-ethoxycoumarin, 3-cyano-7-methoxycoumarin, 7-methoxy-4-trifluoromethylcoumarin, 3-[2-(N,N-diethyl-N-methylamino)ethyl]-7-methoxy-4-methylcoumarin (AMMC), 3-[2-(N,N-diethyl-N-methylamino)ethyl]-7-methoxy-4-trifluoromethylcoumarin, 7-benzyloxyresorufin, and 7-benzyloxy-4-trifluoromethylcoumarin (BFC). For most substrates, multiple cDNA-expressed cytochrome P450 isoforms were found to catalyze the formation of the fluorescent product. However, among the combinations tested, rat CYP2D2 displayed high selectivity for AMMC demethylation (a substrate selective for CYP2D6 in human liver microsomes). AMMC demethylation activity was 15-fold lower in microsomes isolated from female Dark Agouti rats, a model known to have a low abundance of CYP2D2, and apparentKM values were similar for cDNA-expressed CYP2D2 and male Sprague-Dawley liver microsomes. BFC dealkylation and BQ dealkylation were selective but not exclusive for human CYP3A4. A small role for CYP1A2 could be demonstrated. The CYP3A4 selectivity in hepatic microsomes was supported by studies using chemical and antibody inhibitors and a correlation analysis within a panel of liver microsomes from individual donors. BQ demonstrated a higher degree of selectivity for and higher rates of metabolism by CYP3A than BFC. However, per unit enzyme the fluorescent signal is lower for BQ than BFC. AMMC, BQ, and BFC should find uses as enzyme-selective probe substrates.
Cytochrome P450 (P4501) enzymes are the principal enzymes that catalyze the metabolism of drugs and other xenobiotics. Analysis of drug metabolism by the cytochrome P450 system has become an important part of the drug discovery/development process, and numerous assay methodologies have been developed. Cytochrome P450 activity assays which have fluorometric endpoints are advantageous in that they offer high sensitivity and are often direct and homogeneous assays. These properties enable testing larger numbers of experimental conditions with cost effective, higher-throughput methodologies. Indeed, fluorometric P450 substrates have been used for many applications in toxicology and drug discovery and development (Ullrich and Weber, 1972; Burke et al., 1985; DeLuca et al., 1988; White, 1988;Mayer et al., 1990; Buters et al., 1993; Kennedy and Jones, 1994;Crespi et al., 1997; Onderwater et al., 1999; Price et al., 2000;Renwick et al., 2000).
Some fluorometric probes have been reported to be selective for various P450 isoforms in liver microsomes, including 7-methoxyresorufin and 7-ethoxyresorufin for CYP1A2 (Burke et al., 1994), 3-(3,4,-difluorobenzyloxy)-5,5-dimethyl-4-(4-methyl-sulfonylphenyl)-5H-furan-2-one for CYP3A4/5 (Chauret et al., 1999), and 2,5-bis(trifluoromethyl)-7-benzyloxy-4-trifluoromethylcoumarin for CYP3A4 (Renwick et al., 2001). However, there are many enzymes for which selective substrates have not yet been identified. This limitation has been addressed in some applications by the use of individual cDNA-expressed enzyme preparations.
We have examined nine fluorometric substrates for their capacity to serve as cytochrome P450 form-selective probe substrates in a panel of 29 rat and human cytochrome P450 enzymes. Three of these substrates were found to be suitable for use as P450 isoform-selective probes in both rat liver microsomes (RLM) and human liver microsomes (HLM).
Materials and Methods
Chemicals, Enzymes, and Antibodies.
Microsomes were obtained from BD Gentest from baculovirus-infected insect cells (Supersomes) or from metabolically competent human B-lymphoblastoid cell lines that stably express rat CYP2E1 or rat CYP2A1. Liver microsomes from humans and SD rats were obtained from BD Gentest. Liver microsomes from female Dark Agouti (DA) rats were a kind gift of Dr. Elizabeth Laurenzana (University of Arkansas for Medical Sciences, Little Rock, AR). The substrates dibenzyl fluorescein (DBF), 7-benzyloxyquinoline (BQ), 3-[2-(N,N-diethyl-N-methylamino)ethyl]-7-methoxy-4-methylcoumarin (AMMC), 3-[2-(N,N-diethyl-N-methylamino)ethyl]-7-methoxy-4-trifluoromethylcoumarin (MeAMFC), 7-benzyloxy-4-trifluoromethylcoumarin (BFC), and metabolites hydroxyquinoline, 3-[2-(N,N-diethyl-N-methylamino)ethyl]-7-hydroxy-4-methylcoumarin, 3-[2-(N,N-diethyl-N-methylamino)ethyl]-7-hydroxy-4-trifluoromethylcoumarin were obtained from BD Gentest. The substrates 3-cyano-7-ethoxycoumarin (CEC), 3-cyano-7-methoxycoumarin (CMC), 7-methoxy-4-trifluoromethylcoumarin (MFC), resorufin benzyl ether (BzRes); metabolites 7-hydroxy-4-trifluoromethylcoumarin, 3-cyano-7-hydroxycoumarin; and inhibitors furafylline, ketoconazole, and sulfaphenazole were obtained from Ultrafine Chemicals (Manchester, UK). Fluorescein, quinidine, and α-naphthoflavone were obtained from Sigma-Aldrich (St. Louis, MO) and resorufin was obtained from Molecular Probes (Eugene, OR). All other chemicals (reagent grade) were obtained from Sigma-Aldrich. Monoclonal antibodies inhibitory to CYP1A2 (catalog no. 458312) and CYP3A4 (catalog no. 458334) were obtained from BD Gentest.
Incubations with cDNA-Expressed Enzymes and Liver Microsomes.
Assays were conducted in 96-well microplates. Potassium phosphate buffer (0.1 ml) containing an NADPH-regenerating system [final concentrations were 1.3 mM NADP+ (or 0.008 mM for AMMC only), 3.3 mM glucose 6-phosphate, 0.4 U/ml glucose-6-phosphate dehydrogenase] was added to each well. The plate was then warmed to 37°C and the reaction initiated by the addition of prewarmed enzyme/substrate (E/S) mix. For experiments using cDNA-expressed enzymes, the E/S mix contained buffer, P450 enzyme (2.5–87 pmol/ml final), control microsomal protein prepared from insect cells infected with wild-type baculovirus (to standardize protein to approximately 0.25 mg/ml final) and substrate (1.0–50 μM final). For experiments with liver microsomes, the E/S mix was the same except that liver microsomal protein concentration was 0.5 mg/ml. Reactions were terminated after 5 to 45 min by addition of 75 μl 80:20 acetonitrile:0.5 M Tris base or, for DBF only, 2 N NaOH. Specific parameters are provided in Tables 2through 4 (bottom). Previous work with some of these enzyme/substrate pairs (Crespi et al., 1997, 1998; Stresser et al., 2000; Chauret et al., 2001) and preliminary experiments were used to optimize experimental conditions (incubation times, buffer, protein, and substrate concentrations) for the major human drug-metabolizing enzymes (e.g., cDNA-expressed CYP1A2, CYP2C9, CYP2C19, CYP2D6, and CYP3A4) and liver microsomes. The substrate concentrations chosen were at or near the apparent KM for one of the enzymes, and the conditions of where metabolite production was linear with time and protein. Similar conditions were used with the other enzymes and rat P450s. However, because of the number of enzyme/substrate pairs tested (n = 247), incubation times, protein concentrations, and substrate concentrations were not individually optimized. Fluorescence signal was measured using a FLUOstar model 403 fluorescence plate reader (BMG Labtechnologies Inc., Durham, NC) and the metabolite quantified by standard curves of the metabolite. The wavelengths used for analysis are shown in Table1.
Turnover numbers for Rat P450 enzymes with fluorometric substrates2-a
Catalytic activity of human and animal liver microsomes with fluorometric substrates4-a
Fluorometric substrates and their metabolite excitation and emission wavelengths
Incubations of Substrates with Single Donor Human Liver Microsomes.
Assays were conducted in 96-well microplates in a 200-μl volume as described above. Substrate concentrations were 50 μM BFC and 40 μM BQ. The final concentration of microsomal protein was 0.025 mg/ml for incubations with BFC and 0.1 mg/ml for incubations with BQ. Reactions were terminated after 15 min (BFC) or 30 min (BQ) by addition of 75 μl 80:20 acetonitrile:0.5 M Tris base. Fluorescence signal was measured using a FLUOstar model 403 fluorescence plate reader.
Enzyme Kinetics Analysis.
Kinetic analyses of metabolite formation was initially assessed by visual examination of Eadie-Hofstee plot. A singleKM (rectangular hyperbolic) model was suggested by presence of a straight-line plot. When the plot deviated from linearity (e.g., “L”-shaped or curvelinear), a multipleKM or allosteric mechanism was suggested. The Hill equation was invoked when a pure allosteric model was indicated (Segel, 1993). For the HLM/BQ and HLM/BFC plots, a multiple KM and allosteric mechanism was suggested. In those cases, the following equation was applied:
Incubations of Liver Microsomes with Enzyme-Selective Chemical Inhibitors.
Assays were conducted in 96-well microplates in a 200-μl volume as described above. Potassium phosphate buffer (0.1 ml) containing an NADPH-regenerating system [final concentrations were 200 mM potassium phosphate, 1.3 mM NADP+, 3.3 mM glucose 6-phosphate, 0.4 U/ml glucose-6-phosphate dehydrogenase] was added to each well, except the first well in each row, to which 0.144 ml was added. Chemical inhibitors dissolved in acetonitrile were added in a volume of 6 μl to the first well in each row of the plate and serially diluted at a ratio of 1:3 through well 8. The final 50 μl was discarded. Wells 9 and 10 contained no inhibitor, and wells 11 and 12 were used as blanks (stop solution added before E/S mix). The final concentration of acetonitrile was 2%. Reactions (except those with furafylline) were initiated by the addition of prewarmed E/S mix. The E/S mix contained liver microsomal protein (final concentration was 0.025 mg/ml for BFC and 0.1 mg/ml for BQ) and substrate (final concentration was 40 μM BQ or 50 μM BFC). For experiments with furafylline, a preincubation step was included to allow NADPH-dependent complexation to occur and maximize inhibitory potential (Bourrie et al., 1996). In those experiments, all components except substrate were incubated at 37°C for 10 min in a volume of 150 μl prior to the addition of BFC or BQ in a volume of 50 μl. Reactions were terminated after 15 min (BFC) or 30 min (BQ) by addition of 75-μl 80:20 acetonitrile:0.5 M Tris base. Fluorescence signal was measured using a FLUOstar model 403 fluorescence plate reader. Fluorescence signal from the blanks was subtracted from signal in all wells.
Incubations of Liver Microsomes with Immunoinhibitory Monoclonal Antibodies.
Monoclonal antibodies inhibitory to CYP1A2 and CYP3A4 were used as described in the product insert. Antibody and 25 mM Tris (pH 7.5) were mixed at various ratios in a small volume. Liver microsomes [5 μl (100 μg) for BQ; 1.25 μl (25 μg) for BFC] were added to the antibody-Tris mixture and incubated on ice for 15 min (CYP3A4) or 20 min (CYP1A2). A substrate/NADPH-regenerating system reaction mix was then added to bring the volume to 1 ml. Substrate concentrations were 50 μM BFC and 40 μM BQ. Reactions were terminated after 15 min (BFC) or 30 min (BQ) by addition of 375 μl 80:20 acetonitrile:0.5 M Tris base. Fluorescence signal was measured using a FLUOstar model 403 fluorescence plate reader.
Results
Fluorescent Substrate Metabolism by cDNA-Expressed Enzymes.
Using the panels of cDNA-expressed enzymes, AMMC was observed to be highly selective for rat CYP2D2 and human CYP2D6, whereas BQ and BFC were selective for human CYP3A4 (Tables 2and 3). Overall, BQ exhibited the highest turnover of all substrates tested. However, the low yield of fluorescence per unit metabolite limited the signal to noise ratio with this substrate. CEC was selective for human CYP1A forms and showed a preference for CYP1A1 relative to CYP1A2 in both the human and the rat. The profile for CMC generally tracked that of CEC. In both the rat and human, CYP2E1 metabolized CMC about 6 times more rapidly than CEC. MFC was a substrate for most enzymes with the notable exceptions of both human and rat CYP3A enzymes. MFC showed some preference for CYP2B6 in the human and CYP2C6 in the rat. DBF was also relatively nonselective among both rat and human P450s. CYP1A1 was the most active enzyme in both the rat and the human. Human CYP3A enzymes were more efficient at metabolizing DBF relative to their rat orthologs. BzRes was most rapidly metabolized by CYP1B1 and CYP1A1 in the human and CYP1A1, CYP1A2, and CYP2B1 in the rat. MeAMFC was relatively selective for CYP2D6 in the human. However, the low yield of fluorescence from the metabolite and the low apparent KM for CYP2D6 limits the usefulness of this substrate due to substrate depletion. MeAMFC was not tested with the rat cytochrome P450 panel.
Turnover numbers of Human P450 enzymes with fluorometric substrates3-a
All enzymes could dealkylate at least one substrate with the exceptions of rat CYP2A1 and human CYP4A11; however, the catalytic profiles for each substrate and enzyme were relatively distinct. Human CYP2C8 and rat CYP2C12 were active for only two substrates whereas rat and human CYP2E1 were active for three substrates. CYP1A1 (both human and rat) was active toward all substrates examined except AMMC.
Based on these observations, the selectivities of BFC, BQ, and AMMC were further evaluated in pooled human and animal liver microsomes, characterized HLM from single donors, and cDNA-expressed enzymes. These results follow.
Characterization of Product Formation in Liver Microsomes.
All substrates were actively metabolized in pooled RLM or HLM (Table4). Catalytic activity levels were generally similar across species. However, SD RLM exhibited 30- to 100-fold greater AMMC and MeAMFC demethylase activity levels compared with human. In contrast, female DA rats exhibited catalytic activity level 15-fold lower than female SD rats and comparable to that found in HLM. BQ and BzRes (and to a lesser extent MeAMFC and DBF) are preferentially metabolized by male SD RLM relative to female.
The kinetics of metabolism were examined for BFC and BQ in HLM and for AMMC in male SD liver microsomes (Fig.1). BQ and BFC product formation was linear with time and protein over the ranges tested, except that product formation for BQ became nonlinear after 30 min. In the substrate concentration-dependence analysis, sigmoidal kinetics were observed with both BFC and BQ but not at low substrate concentrations. Accordingly, a “hook” (mirror-image letter “C”) was observed in the Eadie-Hofstee plots over the substrate concentration range 10 to 320 μM (BQ) or 5 to 160 μM (BFC). With BQ, a multiple KM model incorporating a single rectangular hyperbolic (Michaelis-Menten) model with the Hill equation (eq. 1) provided plausible estimates of the kinetic parameters (KM = 28 μM,S50 = 70 μM) but with large standard errors. Fitting the low S portion (0 to 5 μM) to a hyperbolic model yielded a KM estimate of 6.7 μM but again with a large standard error (Table 5). Fitting the high S range to the Hill equation yielded an estimate for S50 of 62 μM and a Hill coefficient (n − number of sites bound by activator) of 1.8. Sigmoidal enzyme kinetics were observed for BQ with cDNA-expressed CYP3A4 (S50 = 22 μM;n = 1.9) and CYP3A5 (S50 = 52 μM; n = 1.5); data fit best to a hyperbolic model with CYP1A2 (KM = 53 μM). TheVmax for CYP3A4 was ∼2.6-fold higher than CYP3A5 and 6-fold higher than CYP1A2. With HLM and BFC, sigmoidal kinetics were observed from 5 to 160 μM (S50 = 23 μM; n = 1.4). Activity within the 0 to 2.5 μM range exhibited hyperbolic behavior (KM = 3.8 μM). Attempts to fit eq. 1 to the HLM/BFC data did not yield meaningful data. Sigmoidal enzyme kinetics were observed for BFC with CYP3A4 (S50 = 40 μM; n = 1.3) and CYP3A5 (S50 = 33 μM;n = 1.5), whereas hyperbolic kinetics were observed with CYP1A2 (KM = 18 μM) and CYP2C19 (KM = 26 μM). Rates of metabolism could not be determined at substrate concentrations above 160 μM due to the limited solubility of BFC. TheVmax for CYP3A4 was more than an order of magnitude higher than the other cDNA-expressed enzymes. With AMMC, product formation was linear with protein concentration only at low protein concentrations (below 100 μg/ml). Product formation was linear with time up to 30 min of incubation. AMMC demethylation exhibited hyperbolic kinetics in RLM. For AMMC, the apparentKm values were 8 and 4.6 μM for RLM and cDNA-expressed CYP2D2, respectively.

Effect of substrate concentration on product formation in HLM (BQ, top row; BFC, middle row) or RLM (AMMC, bottom).
Eadie-Hofstee plots are shown at right.
Kinetic parameters for product formation from BFC, BQ, and AMMC in HLM, RLM, or cDNA-expressed P450s
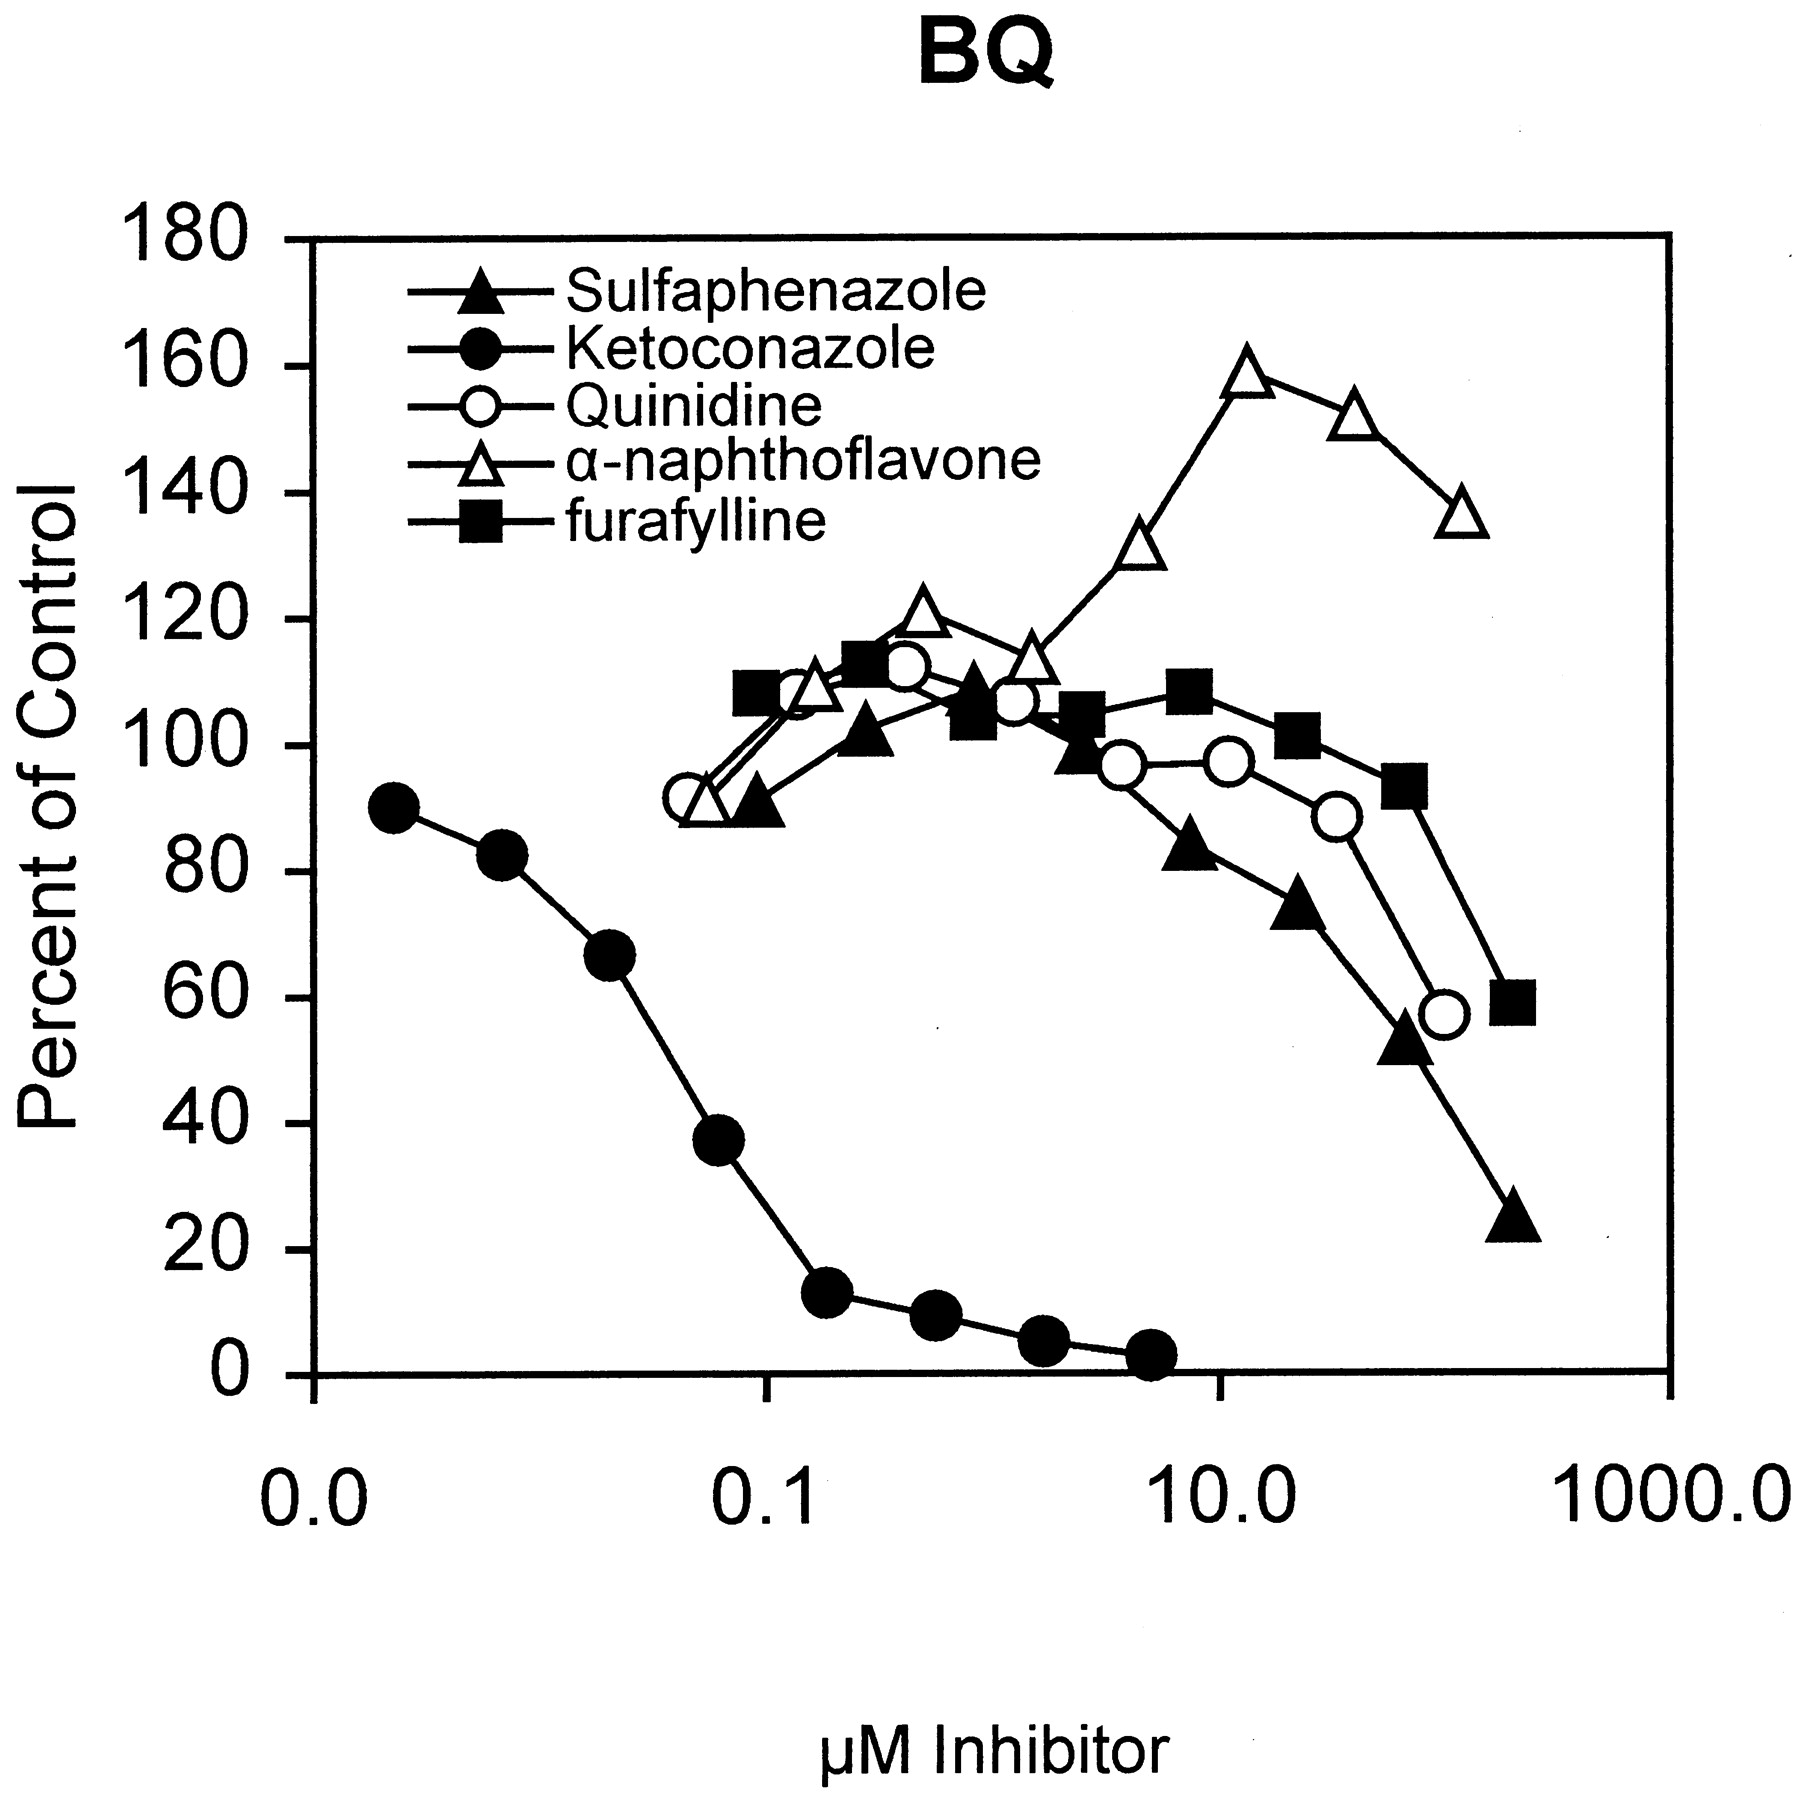
Enzyme-selective Chemical Inhibitors.
The effect of the P450 enzyme-selective chemical inhibitors furafylline (for CYP1A2), sulfaphenazole (for CYP2C9), ketoconazole (for CYP3A4), quinidine (for CYP2D6), and α-naphthoflavone (for CYP1A2) on the dealkylation of BFC and BQ by pooled HLM are shown in Figs.2 and 3, respectively. With BQ, a low concentration of 2 μM ketoconazole inhibited BQ dealkylation more than 90% whereas inhibition was low or absent with other inhibitors used at concentration ranges generally considered enzyme-selective (e.g., 10–20 μM). α-Naphthoflavone stimulated metabolism up to 60% above activity observed in control wells. A similar pattern was observed with BFC. A low concentration of 0.5 μM ketoconazole inhibited BFC dealkylation more than 90%, and low concentrations of the other inhibitors did not inhibit BFC dealkylase activity substantially. α-Naphthoflavone activated BFC metabolism up to 100% above control. These observations are consistent with CYP3A4 being the major enzyme involved in BFC and BQ dealkylation and do not support a significant role for CYP1A2, CYP2D6, and CYP2C9.

Effect of P450 isoform-selective chemical inhibitor on BFC dealkylase activity in HLM.

Effect of P450 isoform-selective chemical inhibitor on BQ dealkylase activity in HLM.
Immunoinhibition Experiments.
Monoclonal antibodies inhibitory to CYP1A2 and CYP3A4 were used to further discern the relative contributions by these enzymes to BFC and BQ metabolism (Fig. 4). Using pooled HLM, up to 63% of BQ metabolism was inhibited by anti-CYP3A4 MAB whereas 81% of CYP3A4-catalyzed testosterone 6β-hydroxylation was inhibited by same ratio of antibody to HLM protein. Donor livers high in CYP3A4 and low in CYP1A2 were affected least by anti-CYP3A4 MAB whereas donors exhibiting high levels of CYP1A2 but low- to mid-level CYP3A4 were intermediate. Antibodies inhibitory to CYP1A2 exhibited 10 to 20% inhibition of BQ metabolism regardless of the HLM enzyme sources, whereas CYP1A2-catalyzed phenacetin O-deethylation was inhibited up to 82%. Relative to BQ metabolism, BFC dealkylation was inhibited less by anti-CYP3A4 MAB. Pooled HLM metabolism was inhibited most except at highest MAB/HLM ratios in which donor with highest CYP3A4 was most susceptible to inhibition (68%). The donor having high CYP1A2 and low- to mid-level CYP3A4 was affected least (up to 29% inhibition) by anti-CYP3A4 MAB. Relative to BQ, BFC metabolism was inhibited to a greater extent by anti-CYP1A2 MAB (17–35%, depending on HLM enzyme source).

Effect of CYP1A2 and CYP3A4 immunoinhibitory on BFC and BQ dealkylase activity in pooled HLM and donors possessing differing CYP1A2/CYP3A4 ratios.
BQ metabolism is shown in the left two panels, and BFC metabolism is shown in the right two panels.
Catalytic Activity Profiles in a Panel of Liver Microsomes from Human Donors.
A panel of liver microsomes prepared from twelve-characterized individual donors was assessed for AMMC, BFC, and BQ dealkylase activities. Dealkylase activity for BFC and BQ significantly correlated with CYP3A4- and CYP2B6-marker catalytic activities as well as total P450 content (Table 6). Dealkylase activities of these two substrates also correlated well with each other (r = 0.87, P < 0.01). When the same tests were run in the presence of 0.5 μM ketoconazole, which selectively inhibits CYP3A4, BFC dealkylase activity was inhibited an average of 84% across the panel. Residual activity correlated significantly (r = 0.87, p < 0.01) with CYP1A2 catalytic activity. This observation suggests a minor role for CYP1A2. In a similar experiment with BQ, 0.5 μM ketoconazole inhibited activity 99%.
Correlation coefficients for dealkylation of the fluorometric probe and P450 isoform selective catalytic activities in a panel of human donors
As observed earlier (Chauret et al., 2001), AMMC demethylation is well correlated with CYP2D6-catalytic activity at low substrate concentrations (1.5 μM, r = 0.93, p< 0.01). At higher AMMC concentrations, the correlation is weaker (25 μM, r = 0.72, p < 0.01) implying a significant role for other enzyme(s). The residual activity measured in the presence of 0.5 μM quinidine, a selective CYP2D6 inhibitor, did not correlate with any of the marker activities.
Discussion
In this study, we used a panel of 29 cDNA-expressed P450s from rat and human, as well as liver microsomes from rat and human, to test a panel of nine fluorometric substrates to determine their enzyme selectivities. Based on these results, three enzyme/substrate pairs (AMMC/CYP2D2, BFC/CYP3A4, and BQ/CYP3A4) were selected for more detailed follow-up studies to assess enzyme selectivity.
In the present study, cDNA-expressed CYP2D2 but not CYP2D1 catalyzed AMMC-demethylation to a fluorescent product. The selectivity of AMMC for CYP2D2 in RLM was confirmed by comparing catalytic activity in RLM from female DA rats and SD rats. The AMMC-demethylase activity in male and female SD rats was found to be at least 15-fold greater than in female DA rats. In contrast, MFC demethylase activity, catalyzed primarily by CYP2C isoforms, was comparable between the two strains. Thus, AMMC can be used as a selective probe for CYP2D2.
Unlike humans, which express a single CYP2D enzyme (CYP2D6), six CYP2D isoforms (CYP2D1/2/3/4/5/18) have been identified in rats (Gonzalez et al., 1987; Matsunaga et al., 1989, 1990; Kawashima et al., 1996). Dark agouti rats exhibit a debrisoquine 4-hydroxylase poor metabolizer phenotype, which is linked to the low abundance of CYP2D2, particularly in female rats (Yamamoto et al., 1998; Schulz-Utermoehl et al., 1999).
The characterization of AMMC as a selective probe for CYP2D6 in HLM has been published elsewhere by us and others (Chauret et al., 2001). This observation was confirmed herein. An initial attempt to identify the enzyme(s) which contribute to overall activity at high AMMC concentrations did not yield conclusive results. Further investigation would be required to determine whether AMMC can be used as a general probe for CYP2D in other preclinical model species [e.g., CYP2D15, the CYP2D6 ortholog in dog (Roussel et al., 1998)].
In the initial cDNA-expressed enzyme panel, we found that BFC was metabolized by CYP1A1, CYP1B1, CYP2C19, CYP3A4, and CYP3A7, with predominant activity observed with CYP3A4. This determination was based on a criterion of metabolite signal to background ratio of 1.5 or greater. Activities by CYP1A2 and CYP3A5 initially were just below the cutoff but were detected in subsequent experiments. ApparentKm orS50 values were similar for HLM, cDNA-expressed CYP1A2, CYP2C19, CYP3A4, and CYP3A5 (CYP1A1 and CYP1B1 were not examined further as these enzymes are extrahepatic). However, there seems to be a high-affinity/low-capacity enzyme contributing in HLM which was not one for which a KMor S50 was determined. This is because the apparent KM of 3.8 μM is too low. Our Km orS50 parameter values for BFC dealkylation are in agreement with the rank orderKM values for CYP3A4 > HLM > CYP1A2 determined by Renwick et al. (2000); however, our value for CYP1A2 was 4.5-fold higher. The reason for this is unclear but may be due to differences in experimental methods or enzyme kinetic model applied.
Our evidence indicates that CYP3A4 is the major enzyme catalyzing BFC dealkylation in HLM but that it is not the sole enzyme involved. Support for a predominant role of CYP3A4 is based on the high correlation of BFC dealkylation with the CYP3A4-marker activity testosterone 6β-hydroxylase activity and the near complete inhibition of activity in HLM by low concentrations of ketoconazole (while other inhibitors were not active). Based on the relative activities of the individual CYP3A forms, we anticipate that CYP3A4 accounts for the majority of activity, but this has not been proved, as CYP3A form-selective inhibitors are not available. The enzymatic activity not inhibited by ketoconazole (on average 14% of the total in the single donor panel) correlated with phenacetin O-deethylase activity, a CYP1A2 marker. Activity by CYP2C19 activity failed to correlate significantly (r = 0.29), and cDNA-expressed CYP2C19 was less active on a unit enzyme basis. This observation coupled with the low abundance of CYP2C19 relative to CYP3A4 in HLM suggests a very minor role for CYP2C19. The correlation with CYP2B6 is coincidental as CYP2B6 and CYP3A-marker activities are correlated in the panel of HLM, and cDNA-expressed CYP2B6 was not active for BFC dealkylation. Moreover, at 0.5 μM ketoconazole, CYP2B6-catalyzed 7-ethoxy-4-trifluoromethylcoumarin O-dealkylase activity is inhibited by <10% (D. M. Stresser, unpublished observations). Experiments with immunoinhibitory antibodies and donors containing different ratios of CYP1A2 and CYP3A4 suggest a predominant but not exclusive role for CYP3A4 in BFC-dealkylation. Certainly, a portion of this activity is catalyzed by CYP1A2 within HLM.
In the aggregate, our data suggest that it is possible to use BFC as a CYP3A4 inhibition probe in HLM. However, for this approach to be robust, care must be taken to select donors (or pools) which are rich in CYP3A4 content and not rich in CYP1A2.
In the initial screen of BQ metabolism with the human cDNA-expressed enzyme panel, CYP3A4 was catalytically most active. In our experiments, CYP1A1 (extrahepatic), CYP1A2, and CYP3A5 were also found to metabolize BQ. As with BFC, BQ dealkylase activity was potently inhibited by ketoconazole, other inhibitors are not active, and BQ dealkylase activity correlated with a CYP3A-marker activity in a panel of HLM. No correlation with the CYP1A2 marker was observed, and the correlation with a CYP2B6 was not supported by data from cDNA-expressed CYP2B6 or chemical inhibition experiments. In contrast to the experiment with BFC in which there was no detectable “residual” activity, 0.5 μM ketoconazole eliminated 99% of BQ dealkylase activity in the single donor HLM. As with BFC, a role for other CYP3A forms could not be defined in HLM. Both HLM and cDNA-expressed CYP3A4 and CYP3A5 displayed sigmoidal kinetics with BQ, a trait commonly observed with other substrates for these enzymes (Houston and Kenworthy, 2000). With HLM, the data also suggested a high-affinity hyperbolic enzyme component. This seems to be an enzyme other than CYP1A2, as theKM estimates for the cDNA-expressed enzyme did not agree well with those found in HLM. Experiments with immunoinhibitory antibodies and donors containing different ratios of CYP1A2 and CYP3A4 suggest a predominant but not exclusive role for CYP3A4 in BQ-dealkylation. The CYP1A2 MAB data are consistent with a minor role for CYP1A2. The CYP3A4 MAB data are more difficult to interpret because the MAB is not as quantitative in its inhibition. Relative to BFC, a much smaller portion of activity is catalyzed by CYP1A2 within HLM. However, it certainly seems that both BFC and BQ are less selective than testosterone 6β-hydroxylase as a CYP3A4 probe substrate. Together, these results suggest that CYP3A4 is the major catalyst involved in the metabolism of BQ within HLM under the conditions examined here and that BQ may be used to monitor CYP3A catalytic activity in HLM including inhibition analysis. However, because there are other P450s that contribute to BQ (and BFC) activity in HLM, IC50 values obtained in HLM will be higher than those with expressed CYP3A4.
A total of 247 enzyme substrate pairs were examined and significant level of hepatic P450 isoform selectivity was observed among only four enzyme/substrate pairs. However, there were a number of observations from the initial screen that suggest utility of these fluorescent probes for other applications. For example, it was apparent that MFC may be used as a general substrate for detecting activities of multiple nonCYP3A rat and human P450. Coincubation of MFC and CYP3A-selective BFC may offer a simple, broad coverage assay (yield common 7-hydroxy-4-trifluoromethylcoumarin metabolite) for cytochrome P450 activity in both RLM and HLM and thus be an appropriate test for the quality of a particular tissue for drug metabolism analyses.
We observed that BzRes displayed a striking specificity for human CYP1B1, the only other substantial contributor being CYP1A1, which was found to be ∼1/3 less active. This suggests that conditions might be identified (e.g., salt and substrate concentrations) where BzRes is capable of monitoring CYP1B1 activity with good selectivity.
Finally, many substrates were identified that can be used to develop cytochrome P450 inhibition assays with cDNA-expressed enzymes as a source of single enzymes. The key to the development of these assays is not only turnover number but also quantum yield of the metabolite. All enzyme-substrate pairs in Tables 2 and 3 that exhibit a signal/background ratio >3 should be useful in these assays. This value corresponds to approximately 4 times the detection cut-off values listed in footnote “b” of each table. In addition, it may be possible to optimize conditions (e.g., substrate and enzyme concentration, incubation time) to achieve a 3-fold signal/background ratio for other enzyme/substrate pairs not meeting this criteria in the screen.
In this study, we have investigated human and rat P450 isoform catalytic selectivity among a panel of fluorescent substrates. For most substrates, multiple cDNA-expressed cytochrome P450 isoforms were found to catalyze the formation of the fluorescent product. However, among the isoforms tested, rat CYP2D2 and human CYP2D6 displayed complete selectivity with low concentrations of AMMC, and BFC and BQ were relatively selective for CYP3A, with a little activity contributed from CYP1A2 or extrahepatic enzymes. Additional studies using chemical and antibody inhibitors and a correlation analysis within a panel of liver microsomes from individual donors confirmed the relative selectivity of these probe substrates. These substrates are expected to be useful for studies in heterogeneous systems (e.g., liver microsomes) that require a rapid assessment of P450 isoform content or catalytic activity.
Acknowledgments
We thank Dr. Elizabeth Laurenzana of the University of Arkansas for Medical Sciences, Little Rock, Arkansas for providing the liver microsomes from Dark Agouti rats.
Footnotes
-
A portion of this work was presented at the 6th International Society for the Study of Xenobiotics meeting; 2001 Oct 7–11; Munich, Germany.
- Abbreviations used are::
- P450
- cytochrome P450
- RLM
- rat liver microsomes
- HLM
- human liver microsomes
- SD
- Sprague-Dawley
- DA
- Dark Agouti
- DBF
- dibenzyl fluorescein
- BQ
- 7-benzyloxyquinoline
- AMMC
- 3-[2-(N,N-diethyl-N-methylamino) ethyl]-7-methoxy-4-methylcoumarin
- MeAMFC
- 3-[2-(N,N-diethyl-N-methylamino) ethyl]-7-methoxy-4-trifluoromethylcoumarin
- BFC
- 7-benzyloxy-4-trifluoromethylcoumarin
- CEC
- 7-ethoxy-3-cyanocoumarin
- CMC
- 7-methoxy-3-cyanocoumarin
- MFC
- 7-methoxy-4-trifluoromethylcoumarin
- BzRes
- 7-benzyloxyresorufin
- E/S
- enzyme-substrate
- MAB
- monoclonal antibody
- Received November 1, 2001.
- Accepted April 11, 2002.
- The American Society for Pharmacology and Experimental Therapeutics


