


Abstract
Signal transducer and activator of transcription (Stat), a family of transcriptional factors, has been demonstrated to play a critical role in gene regulation in response to inflammatory cytokines, such as interferon and interleukin-6. Inflammatory cytokines and bacterial endotoxin are known to suppress, in most of cases, the constitutive or induced cytochromes P450 (P450) in animals and humans. However, it is not clear if the suppression of P450 by cytokines is through the Stat-signaling pathway. In the present study, we determined whether Stat1 is involved in lipopolysaccharide (LPS)-mediated modulation of P450 in mouse liver. In both Stat1+/+ (wild type) and Stat1−/− (null) mice, a single dose of LPS treatment (1 mg/kg of body weight, i.p.) significantly reduced the expression of CYP3A11, 2C29, and 1A2 mRNA to 8 to 40% of the control levels as determined by real-time quantitative reverse transcription-polymerase chain reaction. The reduction was supported by Western blot analysis. In contrast, LPS significantly induced the level of CYP4A10 mRNA in both Stat1+/+ (338% of control) and Stat1−/− mice (264% of control). Although suppression of mRNA levels of CYP2E1, and 2D9 was not observed in either LPS-treated Stat1 null or wild-type animals, LPS treatment resulted in a reduction of CYP2E1 protein content, which was more significant in Stat1+/+ (23% of control) than in Stat1−/−mice (67% of control). Consistent with this result, the chlorzoxazone 6-hydroxylase and lauric acid 11-hydroxylase activities, as CYP2E1 representative activities, were reduced markedly by LPS in Stat1+/+ but not in Stat1−/− mice. The ethoxyresorufin O-deethylase activity, as a representative CYP1A activity, was also reduced significantly only in LPS-treated Stat1+/+ mice. These data clearly demonstrate that LPS-mediated modulation of CYP3A11, 2B10, 2C29, 1A2, and 4A10 in mouse liver is Stat1-independent. However, the significant difference between the LPS-treated Stat1+/+ and Stat1−/− mice in the levels of CYP2E1 protein and activity as well as in the activity level of CYP1A suggests that Stat1 may be indirectly involved in the post-transcriptional modulation of these two mouse P450 enzymes.
Cytochromes P450 (P4502) are an enzyme superfamily that catalyzes the metabolism of a variety of endogenous and exogenous compounds. The expression of P450 genes can be regulated extensively by a number of factors including xenobiotics. This regulation is largely at the transcriptional level, resulting in an alteration of the steady-state level of specific mRNAs (Gonzalez, 1989). However, regulation of P450s can also occur at the post-transcriptional level. For example, ethanol, pyridine, and fasting have been shown to regulate CYP2E1 by stabilizing its mRNA or increasing its protein synthesis (Hong et al., 1987; Pan et al., 1992; Kim et al., 2001). Previous studies indicated that LPS-induced suppression of P450 activity was due to endogenously released inflammatory cytokines, such as IL-6, interferon, tumor necrosis factor-α, and IL-1 (Ruff-Jamison et al., 1994; Morgan, 1997; Panesar et al., 1999; Siewert et al., 2000). The suppression of P450-mediated metabolism of endogenous and exogenous substances under inflammatory conditions is an important consideration for drug efficacy and drug-drug interactions (Sheldlofsky et al., 1994; Liu et al., 2000).
Although the modulation of hepatic P450 enzymes by LPS and cytokines has been documented (Warren et al., 1999; Morgan, 2001), the molecular mechanism(s) by which cytokines regulate the expression of P450 genes are not fully understood. The Jak-Stat pathway is one of the important signaling pathways downstream of cytokine receptors in several cellular systems, such as the hematopoietic and immuno systems (Heim et al., 1995; Ihle and Kerr, 1995). It has been demonstrated that the Stat proteins are essential for gene regulation in response to a number of cytokines and LPS (Watanabe and Arai, 1996; Kobierski et al., 2000). Upon stimulation with cytokines, they become activated by tyrosine phosphorylation followed by hetero- or homo-dimerization, and translocation to the nucleus where they recognize specific binding sites on the regulatory sequences in DNA. The Stat proteins can then modulate the expression of the target genes. So far, seven Stat proteins have been identified including Stat1, Stat2, Stat3, Stat4, Stat5a, Stat5b, and Stat6. The contribution of Stat proteins to specificity of cytokine signaling has been studied in various knockout mice. For example, Stat1-deficient mice exhibit a selective defect signaling in response to both type I and type II interferons and were extremely susceptible to viral disease (Durbin et al., 1996; Meraz et al., 1996). Stat3 is activated mainly in response to the IL-6 family of cytokines. Targeted disruption of the mouse Stat3 gene leads to early embryonic death (Takeda et al., 1997), whereas mice lacking Stat5b exhibit defective growth (Udy et al., 1997). The role of the Stat-signaling pathway in cytokine-mediated modulation of P450 enzymes is largely unknown. Recently, it has been reported that CYP2C12 expression was down-regulated by growth hormone-activated Stat5b (Delesque-Touchard et al., 2000). In the present study, we used the Stat1 knockout mice to examine the potential role of Stat1 protein in the LPS-mediated modulation of hepatic P450 enzymes. After the treatment with the bacterial endotoxin LPS, the hepatic levels of mRNA, protein, and activity of seven P450 enzymes between the Stat1+/+ and Stat1−/−mice were compared.
Materials and Methods
Animals.
Male Stat1+/+ and Stat1−/− mice were provided by Dr. David E. Levy (New York University, NY). The generation of Stat1−/− mice by gene disruption was described by Durbin et al. (1996). Stat1−/− animals were then mated to CD1 strain females, and Stat1+/+and Stat1−/− progenies were derived by brother-sister heterozygous matings. The mice were allowed for free access to food and water at all times. Twenty mice (five mice per group) were injected once intraperitoneally with LPS (1 mg/kg) or vehicle (0.1% BSA in 0.9% NaCl). The animals were sacrificed 24 h after injection by cervical dislocation. The livers were immediately frozen in dry ice and stored at −80°C prior to the preparation of microsomes and total RNA.
Materials
Chromatographically purified Escherichia coli LPS (serotype 0127:B8) was purchased from Sigma-Aldrich (St. Louis, MO). TaqMan probes were synthesized by BioSource International (Camarillo, CA). TRIzol reagents, P450 primers, SuperscriptII, and RNase inhibitor were obtained from Invitrogen (Carlsbad, CA). TaqMan PCR Core reagent kit and TaqMan ribosomal RNA control reagent kit were purchased from Applied Biosystems (Foster city, CA). Hybond-ECL nitrocellulose, Hyperfilm-ECL X-ray film, and ECL Western blotting detection kit were purchased from Amersham Pharmacia Biotech Inc. (Piscataway, NY). Bio-Rad protein assay kit and Tris-buffered saline (TBS, 10 mM Tris/HCl and 50 mM NaCl, pH 8.2) were from Bio-Rad Laboratories (Hercules, CA). Antibodies against Stat1 p84/p91(E-23), Stat3 (C-20), Stat5b (C-17), and horseradish peroxidase-conjugated anti-rabbit and anti-mouse IgG were purchased from Santa Cruz Biotechnology, Inc. (Santa Cruz, CA). Monoclonal antibodies against rat CYP1A1/2 and 2B1/2 were kindly provided by Dr. Paul Thomas (Rutgers University, Piscataway, NJ), and polyclonal antibodies against mouse CYP2D9 were provided by Dr. Masahiko Negishi (National Institute of Environmental Health Sciences, Research Triangle Park, NC). Antibodies against rat CYP2E1, 3A2, and 4A1 were purchased from BD Gentest (Woburn, MA).
Microsome Preparation and P450 Content Determination.
Mouse liver microsomes were prepared by differential centrifugation as previously described (Hong et al., 1987). Cytosol fractions were obtained during the microsome preparation. Cytochrome P450 content was determined by a method previously described (Omura and Sato, 1964). Protein concentrations were determined using the Bio-Rad DC protein assay kit with BSA as a standard (Bradford, 1976).
Immunoblot Analysis.
Immunoblotting was carried out as previously described (Pan et al., 1996). Liver cytosolic proteins (for Stat proteins) and microsomal proteins (for P450 enzymes) were separated by 10% SDS-polyacrylamide gel electrophoresis and transferred to a nitrocellulose filter. The filter was blocked with 5% nonfat milk in 0.1% Tween-20 in TBS buffer for 1 h and incubated overnight at 4°C with specific antibodies. After washing in 0.1% Tween-20 in TBS buffer, the filter was incubated with the horseradish peroxidase-conjugated anti-rabbit or mouse IgG, washed again, and visualized by the ECL method (Amersham Pharmacia Biotech Inc). The intensity of the bands was scanned by a calibrated densitometer (BioRad GS-800).
Quantitative RT-PCR.
Total RNA was prepared from frozen livers using TRIzol reagent according to manufacturer's protocol. The ratio of A260 nm to A280 nm (>1.8) was used to determine the purity and concentration of total RNA. Reverse transcription (RT) and PCR were conducted in one step in the model 7700 Sequence Detector (Applied Biosystems) as previously described (Pan et al., 2000). Quantitative RT-PCR data for target templates was normalized to 18S rRNA. RT-PCR primers and fluorogenic probes for all target genes were designed using PrimerExpress software from Applied Biosystems and subsequently synthesized and purified by HPLC. The sequences of CYP1A1, 2C29, and 4A10 were obtained from the GenBank (accession numbers Y00071, D17674, and X69296, respectively) and were used for the design of PCR primers and probes (Table1). The sequences of the other P450 primers and probes were previously published (Pan et al., 2000). The specificity of P450 primers and probes was confirmed by an electrophoretic mobility assay (Fig. 1) and DNA sequencing (conducted by MWG-Biotech, High Point, NC) for each P450 amplicon.
Sequence of the primers and probes for the detection of mouse P450 mRNA

Specificity validation of the P450 primers and probes.
The RT-PCR products were electrophoresized on 5% agarose gel, and the bands were visualized under UV-light after ethidium bromide staining. The expected size of each P450 amplicon and the DNA size maker are indicated.
Enzyme Activity Assays.
Testosterone 6β- and 16α-hydroxylase activities were assayed in an incubation mixture containing testosterone (100 μM), NADPH (1 mM), and microsome proteins (1 mg) in a final volume of 1 ml for 5 min at 37°C. The reaction was initiated by addition of NADPH and terminated by 6 ml of dichloromethane. Following addition of an internal standard (15 μl of 0.4 M corticosterone), the sample was extracted and analyzed for the testosterone hydroxylation products by HPLC using a Supelcosil LC-18 (150 × 46 mm, 5 μm) reverse phase column as described (Van der Hoeven, 1984). The mobile phase consisted of water and methanol. The sample (60 μl) was separated using a gradient HPLC system at a flow rate of 1.5 ml/min. The column effluent was monitored at A247 nm using a Waters 486 Tunable Absorbance detector. Metabolites were quantitated by comparison of their peak heights with those of the standards.
The O-dealkylation of 7-ethoxyresorufin (EROD) and 7-pentoxyresorufin (PROD) assays were conducted by the method of Burke et al. (1985).
Chlorzoxazone 6-hydroxylase activity was determined as described byCourt et al. (1997). Lauric acid 11- and 12-hydroxylase activities were determined according to Bacher and Gibson (1988). Briefly, mouse liver microsome protein (500 μg, approximately 200 pmol P450) were preincubated for 2 min in 100 mM KH2PO4 (pH 7.4), 10 mM MgCl2, and 20 μM14C-lauric acid in a 0.5-ml final volume. Reaction was initiated by the addition of 10 μl of 50 mM NADPH and terminated after 10 min by adding 100 μl of 3N HCl. The metabolites were extracted with 0.5 ml of HCl, and 50 μl of the supernatant was used for HPLC analysis, using a Supelcosil LC-C8 column (150 × 46 mm, 5 μm). The metabolites were eluted with 50% methanol/50% of 0.1% acetic acid (pH 4.5) at a flow rate of 1 ml/min. The effluent was monitored using an UV detector set at A215 nm and a radioactive flow detector to detect the 11- and 12-hydroxylated14C-lauric acid.
Statistical Analysis.
All the values were expressed as mean ± S.E. Statistical significance (P < 0.05) between the groups was determined by unpaired two-way t test.
Results
Stat1−/− Mice and the Effect of LPS Treatment on Stat Protein Expression.
Stat1−/− mice have been reported to be highly susceptible to viral and certain types of bacterial infections (Durbin et al., 1996, Takeda et al., 1997). In our study, all Stat1+/+ and Stat1−/−mice survived with normal appearance during the entire experiment period. The expression level of Stat1, Stat3, and Stat5 proteins in the livers of Stat1+/+ and Stat1−/− mice, with or without LPS treatment, is shown in Fig. 2. As expected, the protein bands of Stat1α (p91) and Stat1β (p84) were absent in the Stat1 null mice. They were significantly induced at 24 h after LPS treatment in Stat1+/+ mice. The level of Stat3 protein was increased by LPS treatment in both Stat1−/− and Stat1+/+mice. Although the level of Stat5b proteins appeared to be induced by LPS in the Stat1−/− mice, the difference was not statistically significant.

Effects of LPS on Stat1, Stat3, and Stat5b protein expression in mouse liver.
Mice were injected intraperitoneally with either LPS (1 mg/kg of body weight) or vehicle (0.1% BSA in 0.9% NaCl) and sacrificed at 24 h. Liver cytosolic protein (15 μg) prepared from control or LPS-treated Stat1+/+ and Stat1−/− mice were electrophoresed, transferred to a nitrocellulose paper, and immunoblotted sequentially, after membrane stripping, with the antibodies against Stat1, Stat3, and Stat5b.
LPS-mediated P450 Modulation in Stat1+/+ and Stat1−/− Mice.
P450 mRNA level
To investigate whether Stat1 is involved in cytokine-mediated modulation of P450 mRNA, we used real-time RT-PCR method to quantitate the mRNA level of eight major P450s in the livers of Stat1+/+ and Stat1−/−male mice with or without LPS treatment. CYP1A1 mRNA was not detectable in all mouse liver samples. Table 2 shows that the mRNA level of CYP3A11, 2C29, and 1A2 was significantly reduced to 8 to 40% of the control levels by LPS treatment in both Stat1+/+ and Stat1−/−mice. The level of CYP2B10 mRNA appeared to be decreased by LPS in both Stat1+/+ and Stat1−/−mice, however, the difference was not statistically significant due to the large variations among individual samples. There was no decrease in the mRNA level of CYP2E1 and 2D9 in LPS-treated Stat1+/+ and Stat1−/−animals. In contrast to the above findings, the level of CYP4A10 mRNA was significantly induced by LPS to 338 and 264% of the control, respectively, in the livers of Stat1+/+ and Stat1−/− mice. There were no statistically significant differences in the mRNA level for all the P450 studied between Stat1+/+ and Stat1−/− mice either with or without the LPS treatment. The above described mRNA expression patterns of CYP1A2, 2B10, 2E1, 3A11, and 4A10 were confirmed by our recent mouse genechip studies (data not shown).
Effect of LPS on the hepatic level of CYP mRNA in Stat1+/+ and Stat1−/−mice
P450 protein level.
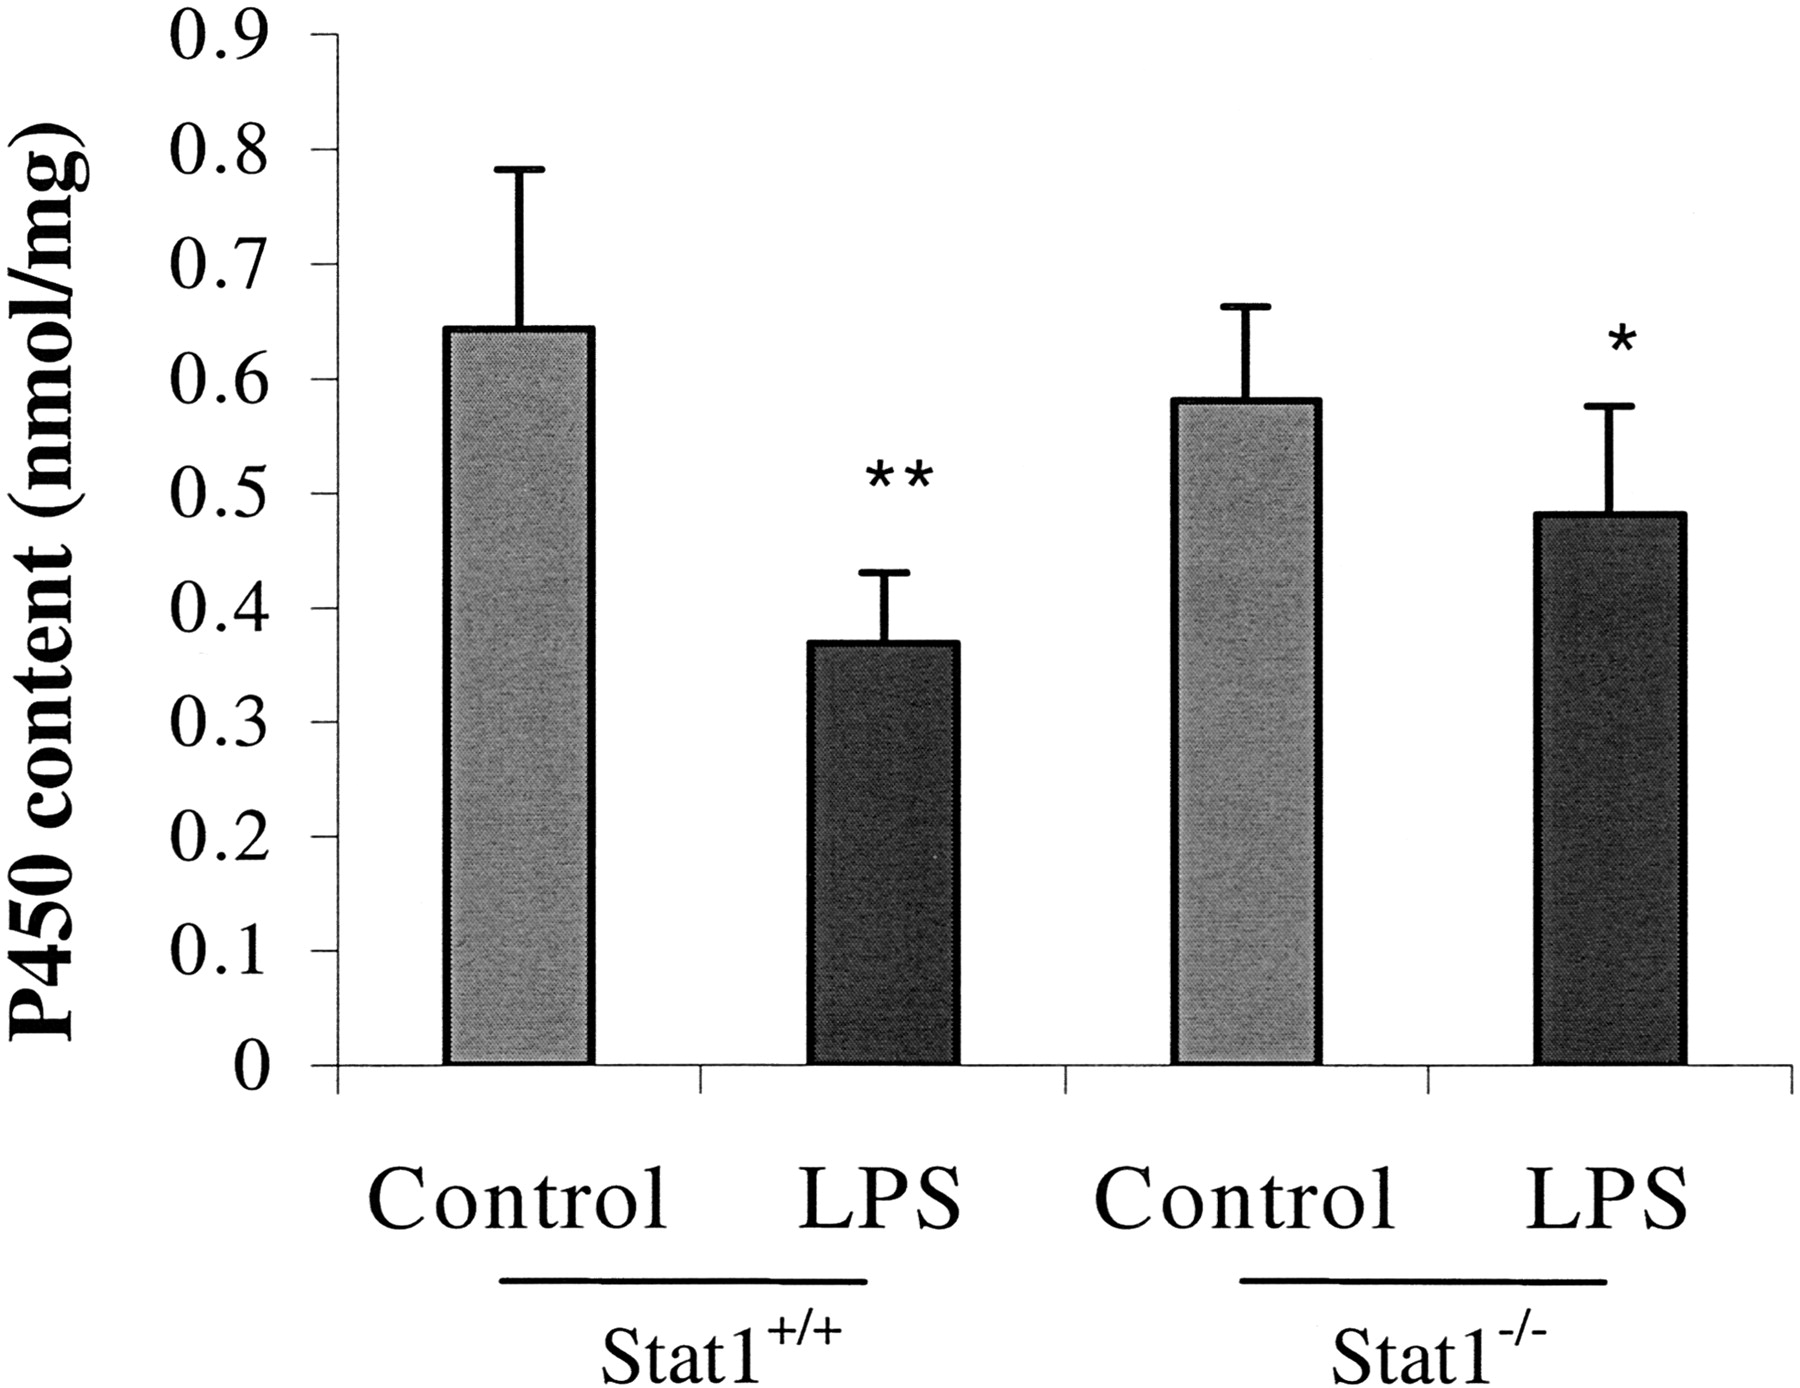
After 24 h of the LPS treatment, there was a significant difference (P < 0.05) in the liver microsomal P450 content between the Stat1+/+ (0.37 ± 0.06 nmol/mg) and Stat1−/− (0.48 ± 0.10 nmol/mg) mice (Fig. 3). Compared with their corresponding controls, the total microsomal P450 content was decreased by 43 and 17%, respectively, in Stat1+/+ and Stat1−/−mice. Except for the antibodies against mouse CYP2D9, antibodies against rat P450 enzymes were used in Western blot analysis. As shown in Fig. 4, in general, the level of the immunoreactive proteins correlated well with the P450 mRNA level for most of the P450 enzymes studied. In the LPS-treated mice, although the CYP2E1 mRNA level was not decreased, the CYP2E1 protein content was reduced to 23% of the control (P < 0.01) in Stat1+/+ mice. The reduction of CYP2E1 protein content was, however, attenuated to 67% of the control value (P < 0.05) in LPS-treated Stat1−/− mice. Statistical analysis showed that the difference in CYP2E1 protein content between the LPS-treated Stat1+/+ and Stat1−/−mice was significant. Such an attenuation of the LPS-induced reduction was not observed for CYP1A-, 2C-, 3A-, and 4A-like proteins in Stat1−/− mice. The level of CYP2D9 protein appeared to be decreased in the LPS-treated mice, however, we were unable to quantitate the content by scanning due to the interference of nonspecific bands. Although the level of 4A10 mRNA was induced by LPS, the level of the immunoreactive proteins, as detected by the anti-rat CYP4A1 antibody, was decreased in both Stat1+/+and Stat1−/− mice. This inconsistency could be due to the poor antibody specificity or to the involvement of other CYP4A isozymes. The cross-species specificity of the antibody against rat CYP1A1/2 used in this study has been previously demonstrated (Thomas et al., 1984). The LPS-induced reduction in CYP1A protein content corresponded well with the decrease in the mRNA level of CYP1A2. Although the specificity of the antibody against rat CYP3A2 was not previously validated in mouse microsomes, our results of the Western blot analysis are consistent with the data of both mRNA and probe substrate activity determinations. The protein content of CYP2B was reduced by LPS in Stat1+/+ male mice, however, the decrease was not statistically significant due to the large sample-to-sample variations.

Effect of LPS on total P450 content in male Stat1+/+ and Stat1−/− mice.
Mice were injected intraperitoneally with either LPS (1 mg/kg of body weight) or vehicle (0.1% BSA in 0.9% NaCl) and sacrificed at 24 h. Liver microsomes were prepared and the P450 content was determined as described under Materials and Methods. Results are expressed as the mean ± S.E. (n = 5 per group). Comparing to the corresponding controls, LPS treatment caused a statistically significant decrease in P450 content in both Stat1+/+ mice (★★, P < 0.01) and Stat1−/− mice (★, P < 0.05). In addition, the difference between the LPS-treated Stat1+/+and Stat1−/− mice was statistically significant (P < 0.05).
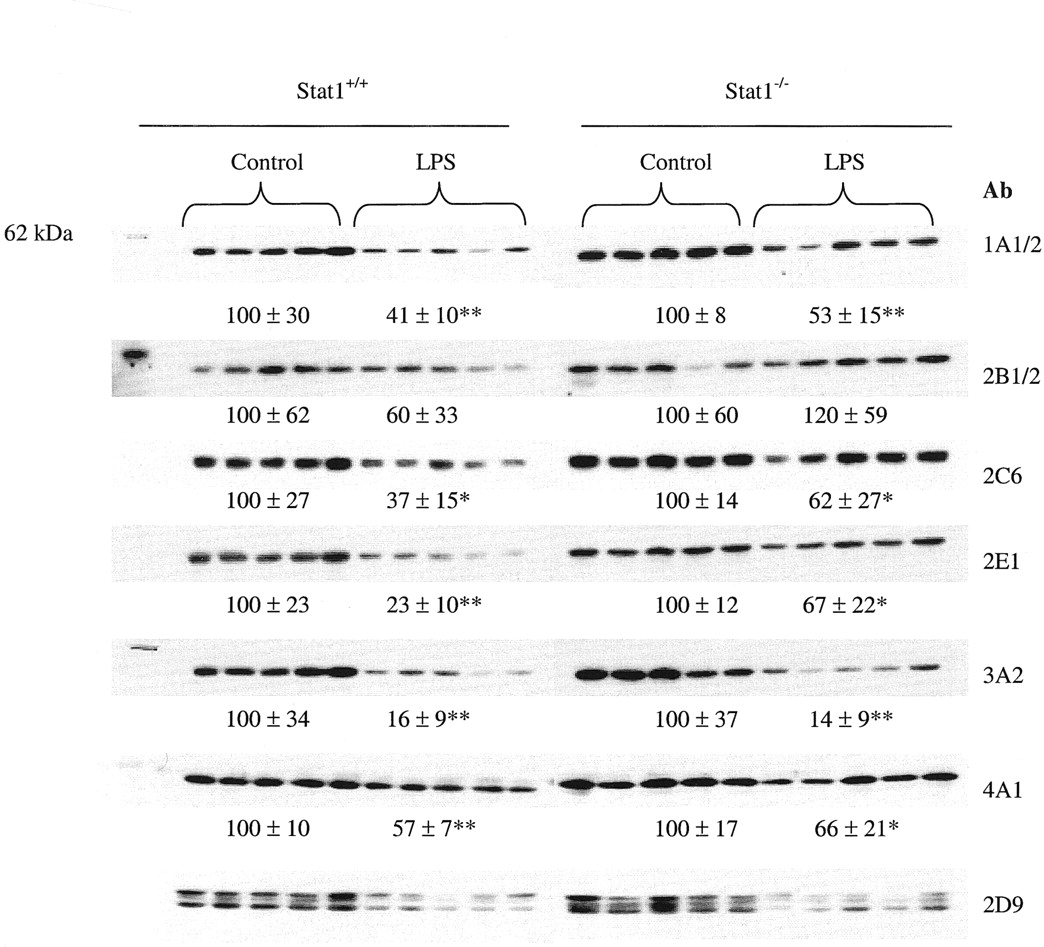
Effect of LPS on the level of P450 proteins in male Stat1+/+ and Stat1−/−mice.
Mice were injected intraperitoneally with either LPS (1 mg/kg of body weight) or vehicle (0.1% BSA in 0.9% NaCl) and sacrificed at 24 h. Microsomal proteins (20 μg) from each individual mouse liver (n = 5 per group) were separated by SDS-polyacrylamide gel electrophoresis and immunoblotted sequentially with antibodies against rat CYP1A1/2, 2B1/2, 2C6, 2E1, 3A2, 4A1, and mouse CYP2D9 after membrane stripping. Between the LPS-treated mice and their corresponding untreated controls, differences with statistical significance were indicated by ∗(P < 0.05) or ∗∗(P < 0.01). Among the difference in P450 protein levels between the LPS-treated Stat1+/+ and Stat1−/− mice, the only difference for CYP2E1 is statistically significant (P < 0.05).
P450 enzyme activities.
The activity of testosterone 6β-hydroxylase, mainly represented by CYP3A, was significantly decreased by LPS in both Stat1+/+ and Stat1−/−mice, which correlated well with the mRNA and protein results (Table3). Although the CYP2D9 protein level appeared to be reduced by LPS in Stat1+/+ and Stat1−/− mice, the decrease in testosterone 16α-hydroxylation activity was statistically significant only in LPS-treated Stat1−/− mice but not in Stat1+/+ mice. Compared with their corresponding controls, LPS treatment caused a statistically significant decrease in CYP2B activity, measured as pentoxyresorufin O-dealkylase (PROD), in both Stat1+/+ and Stat1−/− mice. This result is consistent with the trend of reduction in CYP2B10 mRNA level in the LPS-treated Stat1+/+ and Stat1−/−mice as well as in the level of CYP2B-like proteins in LPS-treated Stat1+/+ mice.
Effect of LPS on hepatic P450 activities in Stat+/+ and Stat1−/−mice
EROD activity was decreased to 73% of the control (P< 0.05) by LPS in Stat1+/+ mice, but no decrease was observed in LPS-treated Stat1−/− mice. This result is consistent with the LPS-induced changes in the level of CYP1A protein but not in the level of CYP1A2 mRNA. Although both CYP1A1 and 1A2 can catalyze the ethoxyresorufin O-deethylation, CYP1A1 is essentially an extrahepatic P450 in human and mouse (Guengerich, 1995). This was confirmed by our study in which there was no detectable amount of CYP1A1 mRNA in all the liver samples (data not shown). Therefore, the EROD activity determined in our study would involve CYP1A2 and/or other P450 enzymes but not CYP1A1. The activities of chlorzoxazone 6-hydroxylase and lauric acid 11-hydroxylase, which represent CYP2E1, were decreased only in LPS-treated Stat1+/+ mice, but not in LPS-treated Stat1−/− mice. The activity of lauric acid 12-hydroxylase was reduced by LPS in Stat1+/+ and Stat1−/− mice, which is consistent with the LPS-induced changes in the level of CYP4A-like protein but not in the 4A10 mRNA level.
Discussion
The purpose of the present study is to comprehensively characterize the constitutive expression and the inflammation–mediated regulation of major P450 enzymes in mouse liver at levels of mRNA, protein, and enzyme activity and to explore the mechanism by which LPS modulates P450 enzymes using the Stat1 null mice. The expression level of eight P450 mRNAs was determined in the mouse liver by quantitative real-time RT-PCR. The level of constitutive expression of all P450s studied was not significant different between Stat1+/+ and Stat1−/−mice. The mRNA levels of CYP1A2, 2C29, and 3A11 were significantly decreased at 24 h after LPS treatment in both Stat1+/+ and Stat1−/−mouse livers. The reduction of these mRNAs correlated with the decrease in the levels of CYP1A-, 2C-, and 3A-like proteins as analyzed by immunoblot analysis using antibodies against rat P450 enzymes. Furthermore, the activity of CYP3A11, assayed as testosterone 6β-hydroxylase, was significantly decreased by LPS treatment in both Stat1+/+ and Stat1−/−mice. The consistency of the CYP3A11 down-regulation by LPS at mRNA, protein, and activity levels in both Stat1+/+ and Stat1−/− mice indicates that the LPS-mediated suppression of CYP3A11 is Stat1 protein independent. Recently, Pascussi et al. (2000) reported that IL-6 markedly decreased the expression of pregnane X receptor (PXR) and constitutive androstane receptor (CAR) mRNA. It has also been reported that the reduction in CYP2B10 and 3A11 expression was associated with the repression of CAR and PXR in mouse liver after LPS administration (Beigneux et al., 2002). Our results on the LPS-mediated suppression of CYP3A11 and 2B10 in Stat1+/+ and Stat1−/−mice suggests that Stat1 may not directly be involved in the reported association between PXR/CAR and the expression of these two mouse P450 enzymes.
Although the CYP2E1 mRNA level was not changed by LPS treatment in both Stat1+/+ and Stat1−/−mice, the level of CYP2E1 protein was decreased by 77% in Stat1+/+ mice and by only 23% in Stat1−/− mice. This is consistent with the result that the lauric acid 11-hydroxylase and chlorzoxazone 6-hydroxylase activities, both assayed as CYP2E1 activity, were significantly decreased only in LPS-treated Stat1+/+ mice. These data suggest that LPS may down-regulate mouse CYP2E1 at post-transcriptional level and Stat1 may be involved in this process since the LPS-induced reduction of CYP2E1 protein content was significantly greater in Stat1+/+ mice than in Stat1−/− mice. Similarly, the reduction of EROD activity by LPS was observed only in LPS-treated Stat1+/+ mice. It has been reported that the reduction of P450 expression by inflammatory stimuli or cytokines was accompanied by the induction of hepatic inducible nitric oxide synthase (iNOS) activity and the production of NO (Khatsenko et al., 1997). Recently, Stat1 has been demonstrated to be required for the induction of LPS-stimulated iNOS gene expression (Meraz et al., 1996; Ohmori and Hamilton, 2001; Samardzic et al., 2001). Our study with the Stat1 null mice indicates that iNOS is not involved in the LPS-mediated modulation of mRNA levels in CYP1A2, 2B10, 2C29, 3A11, and 4A10. This result is consistent with the observation by Sewer et al. (1998). Using iNOS knockout mice, they demonstrated that NO was not involved in the down-regulation of P450 protein and mRNA but may be related to the decreases in the activities of some P450 enzymes. The expression of iNOS and NO production in LPS-treated Stat1−/−mouse liver as well as their potential role in LPS-induced suppression of CYP2E1 and CYP1A activities remain to be studied.
In contrast to the general suppression of several major mouse P450s, LPS treatment induced the level of hepatic CYP4A10 mRNA. Stat1 was apparently not involved in this modulation, as the induction occurred in both LPS-treated Stat1+/+ and Stat1−/− mice. Previously, the mRNA level of CYP4A10 was reported to be suppressed by LPS in homozygous F5 Sv/129 mice (Barclay et al., 1999). The difference between their report and our data may be attributed to the different mouse genetic background (F5 Sv/129 versus CD1/C57BL/129). It has been noticed that although the CYP4A10 mRNA level was induced by LPS, the level of the CYP4A-like protein, as analyzed by Western blot using the antibody against rat CYP4A1, and the CYP4A activity, as determined by lauric acid 12-hydroxylase activity, were reduced by LPS in both Stat1+/+ and Stat1−/− mice. This difference between the levels of mRNA and protein/activity could be due to the presence of other CYP4A enzyme(s), such as CYP4A12 and 4A14, in the mouse liver, which may cross-react with the probe antibodies and/or contribute to the lauric acid 12-hydroxylase activity. A similar disparate effect was reported in the livers of LPS-treated F344 rats in which the mRNA expression of CYP4A subfamily was induced, but the level of protein expression was decreased (Sewer et al., 1996).
LPS administration has been widely used as a model in vivo to study the modulation of P450 by inflammatory stimuli and the mechanisms involved (Shedlofsky et al., 1994; Morgan, 2001). The LPS-induced inflammation involves the subsequent release of cytokines, such as IL-6, interferon, tumor necrosis factor, and IL-1, and consequently the stimulation of multiple pathways by these cytokines (Ruff-Jamison et al., 1994). LPS-related cytokines and growth factors are known to activate Stat1 and Stat3 by tyrosine phosphorylation. Our previous experiments using rat primary hepatocytes showed that Stat3 was activated by tyrosine phosphorylation after a short-term exposure to the LPS-related cytokines IL-6, interferon-γ, and growth hormone (J. Pan, unpublished result), indicating that the JaK-Stat signaling transduction pathway is functionally operative in the hepatocytes. In the present study, LPS treatment significantly induced the levels of Stat1 protein in the liver of Stat1+/+ mice, and Stat3 protein in both Stat1+/+ and Stat1−/− mice, but had no effect on the level of Stat5 protein. Further studies are needed to explore the role of Stat3 and other Stat proteins in the LPS-mediated regulation of P450 enzymes.
In summary, the present study examined the constitutive expression and LPS-mediated regulation of eight P450 mRNA (CYP1A1, 1A2, 2B10, 2C29, 2D9, 2E1, 3A11, and 4A10) in the mouse livers. Among them the mRNA expression level of 1A2, 2B10, 2C29, 3A11, and 4A10 was modulated significantly by LPS. The LPS-mediated regulation of these P450 mRNAs appears to be Stat1-independent since a similar level of the up- or down-regulations was observed in both Stat1+/+and Stat1−/− mice. However, Stat1 may be indirectly involved in the LPS-mediated down-regulation of CYP2E1 and 1A activities.
Acknowledgments
We thank Dr. Anthony Y. H. Lu (Rutgers University, Piscataway, NJ) for invaluable advice on this manuscript, Hongshan Li and Dr. Matthew Hoffmann (Wyeth Research, Collegeville, PA) for technical assistance in HPLC analysis, and Dr. K. Gajaraj (University of Medicine and Dentistry of New Jersey, NJ) for assistance in manuscript preparation.
Footnotes
-
↵1 Current address: Pfizer Global R&D, Ann Arbor, MI 48105.
- Abbreviations used are::
- P450
- cytochromes P450
- LPS
- lipopolysaccharide
- IL-6
- interleukin 6
- BSA
- bovine serum albumin
- ECL
- enhanced chemiluminescence
- TBS
- Tris-buffered saline
- RT-PCR
- reverse transcription-polymerase chain reaction
- PXR
- pregnane X receptor
- CAR
- constitutive androstane receptor
- iNOS
- inducible nitric oxide synthase
- HPLC
- high performance liquid chromotography
- PROD
- pentoxyresorufin O-dealkylase
- EROD
- ethoxyresorufinO-deethylase
- Stat
- signal transducer and activator of transcription
- Received July 11, 2002.
- Accepted December 18, 2002.
- The American Society for Pharmacology and Experimental Therapeutics


