


Abstract
(−)-Epigallocatechin gallate (EGCG) and (−)-epigallocatechin (EGC) are major green tea catechins with antioxidant and anticancer activities. In this study, we characterized the glucuronidation of EGCG and EGC in human, mouse, and rat microsomes and by nine different human UGT 1A and 2B isozymes expressed in insect cells. Six EGCG and EGC glucuronides were biosynthesized, and their structures were identified for the first time. (−)-EGCG-4"-O-glucuronide was the major EGCG glucuronide formed in all incubations. The catalytic efficiency (Vmax/Km) for (−)-EGCG-4"-O-glucuronide formation followed the order: mouse intestine > mouse liver > human liver > rat liver ≫ rat small intestine. The UGT-catalyzed glucuronidation of EGC was much lower than that of EGCG. TheVmax/Km for (−)-EGC-3′-O-glucuronide followed the following order: mouse liver > human liver > rat liver > rat and mouse small intestine. Human UGT1A1, 1A8, and 1A9 had high activities with EGCG. UGT1A8, an intestine-specific UGT, had the highestVmax/Km for EGCG but low activity with EGC. Mice appeared to be more similar to humans than rats to humans in the glucuronidation of EGCG and EGC. Some of these catechin glucuronides retained the activities of their parent compounds in radical scavenging and in inhibiting the release of arachidonic acid from HT-29 human colon cancer cells. These results provide foundations for understanding the biotransformation and biological activities of tea catechins.
Green tea has been suggested to have activities in the prevention of cancer and cardiovascular disease (Yang and Landau, 2000; Yang et al., 2002). (−)-Epigallocatechin gallate (EGCG1) and (−)-epigallocatechin (EGC) are major green tea polyphenols (catechins) with significant antioxidative and biological activities. The blood, tissue, and urine levels of EGCG, EGC, and other tea catechin derivatives have been studied in animals and humans (Chen et al., 1997;Chow et al., 2001), but the biotransformation of EGCG and EGC is not well understood. After oral absorption, EGC and (−)-epicatechin undergo extensive methylation, glucuronidation, and sulfation (Li et al., 2001; Meng et al., 2001). Using liquid chromatography/electrospray ionization-mass spectrometry, we identified several EGC-O-monoglucuronides in human and mouse urine after ingestion of green tea (Li et al., 2001). We also detected significant urinary excretion of EGCG conjugates in mice (Meng et al., 2002). After oral ingestion of green tea catechins, most of the EGCG existed in the free form, but most of the EGC was in conjugate form in the human plasma (Chow et al., 2001). EGCG metabolites were predominantly excreted through bile, but large amounts of EGC metabolites were found in urine (Chen et al., 1997; Kida et al., 2000; Kim et al., 2000; Chow et al., 2001; Li et al., 2001). After oral administration of 100 mg of EGCG to rats, sulfates/glucuronides were the predominant forms (97.4%) of EGCG secreted into the bile (Kida et al., 2000). These data suggest that EGCG and EGC differ significantly in their metabolism and elimination; first-pass metabolism of EGCG may play an important role in determining the bioavailability of EGCG. Further studies on the metabolism of catechins and the biological activities of the metabolites are vital for understanding the biological activities of catechins.
UDP-glucuronosyltransferase (UGT)-catalyzed glucuronidation is a major pathway in Phase II metabolism. At present, 15 human UGTs have been cloned. UGT1A1 catalyzes the glucuronidation of bilirubin, phenols, flavonoids, anthraquinones, and certain estrogens (King et al., 1996). UGT1A3 glucuronidates certain estrogens, flavonoids, coumarins, amines, and anthraquinones (Green et al., 1998). UGT1A6 catalyzes the glucuronidation of planar phenols, whereas UGT1A9 glucuronidates bulky phenols, flavonoids, anthraquinones, and many drugs of varied structure (Ebner and Burchell, 1993). Human UGT1A8, an intestine-specific isoform, has high activity with flavonoids like quercetin, chrysin, naringenin, and genistein (Cheng et al., 1999); this enzyme may be important in governing the bioavailability of these dietary compounds. Recently, there is increasing interest in the intestinal glucuronidation of steroid hormones and xenobiotics (Cheng et al., 1999; Boersma et al., 2002).
Glucuronides are generally considered to be pharmacologically inactive and targeted for excretion. Some pharmacologically active drug glucuronides, however, have been recognized (Kroemer and Klotz, 1992); the most prominent example is morphine-6-glucuronide, which has more potent analgesic action than morphine. The transport of glucuronides across cellular membranes is mediated by uptake transporters (e.g., organic anion transporting polypeptides OATP1, OATP2) and ATP-dependent efflux transporters (e.g., multidrug resistant associated protein MRP1, MRP2, MRP3). MRP2 is expressed on the canalicular membrane of hepatocytes and brush border membrane of intestinal cells, pumping out its substrate into bile or intestinal lumen (Van Aubel et al., 2000). Glucuronides formed in the liver may be secreted into the blood circulation via MRP3 on the sinusoidal membrane followed by elimination through renal filtration (Kusuhara and Sugiyama, 2002). Glucuronides are not always rapidly excreted and can accumulate during chronic therapy. The hydrolysis of glucuronides is catalyzed by β-glucuronidase, an enzyme expressed in many tissues and body fluids. Cleavage of glucuronides in specific tissues could be a mechanism for delivering the parent compound to specific sites. Therefore, conjugation and deconjugation may influence the disposition and concentrations of endogenous compounds and xenobiotics (Sperker et al., 1997).
Glucuronidation has been shown to be a major metabolic pathway for flavonoids such as chrysin, galangin, and quercetin (Otake et al., 2002). Significant species difference between humans and rats in the glucuronidation and sulfation of (−)-epicatechin has recently been demonstrated (Vaidyanathan and Walle, 2002). To understand the glucuronidation of EGCG and EGC, we systematically characterized the enzymology of this reaction in hepatic and intestinal microsomes from humans, mice, and rats, as well as in systems containing different human UGT isozymes. The structures of the major glucuronides were identified. The results demonstrated species differences and isozyme selectivity in the glucuronidation of EGCG and EGC. Some of these glucuronides had radical scavenging activity and inhibited arachidonic acid release.
Materials and Methods
Chemicals and Reagents.
EGCG was a gift from Unilever-Bestfoods (Englewood Cliffs, NJ). EGC and (−)-epicatechin gallate were isolated and purified in our laboratory. 4′-O-Methyl-EGC (4′-MeEGC), 4"-O-methyl-EGCG (4"-MeEGCG), and 4′,4"-di-O-methyl-EGCG (4′,4"-DiMeEGCG) were chemically synthesized and purified in our laboratory (Meng et al., 2002). (−)-EGCG-7-O-glucuronide (EGCG-7-Gluc), EGCG-3′-Gluc, EGCG-3"-Gluc, EGCG-4"-Gluc, EGC-3′-Gluc, and EGC-7-Gluc were biosynthesized and purified with HPLC (purity >99%) in our laboratory. Pooled human liver microsomes and microsomes from baculovirus-infected insect cells (BTI-TN-5B1–4) transiently expressing human UGTs 1A1, 1A3, 1A4, 1A6, 1A8, 1A9, 1A10, 2B7, and 2B15 were prepared by BD Biosciences (San Jose, CA), and their activities were verified with standard substrates. The protein levels of UGT1A isozymes in BTI-TN-5B1–4 microsomes were determined by a semiquantitative Western blot method using an antibody (No. A410; BD Gentest, Woburn, MA) specific for the conserved C-terminal region of all UGT1A isoforms. [5,6,8,9,11,12,14,15-3H(N)] Arachidonic acid was obtained from PerkinElmer Life Sciences (Boston, MA). (−)-Epicatechin, uridine 5′-diphosphoglucuronic acid (UDPGA), Escherichia coliβ-d-glucuronidase (G-7896), 1,1-diphenyl-2-picrylhydrazyl (DPPH), and saccharic acid-1,4-lactone were purchased from Sigma-Aldrich (St. Louis, MO). The protein assay kit was obtained from Bio-Rad Labs (Hercules, CA). Alamethicin, other reagents, and HPLC-grade solvents were purchased from VWR Scientific (South Plainfield, NJ).
Preparation of Tissue Microsomes.
Eight-week-old female CF-1 mice and male Sprague-Dawley rats were purchased from Jackson Lab (Bar Harbor, ME). All mice and rats were fed the Purina Laboratory Chow 5001 diet and allowed 1-week acclimation (Purina, St. Louis, MO). Eight female CF-1 mice and five male Sprague-Dawley rats were sacrificed thereafter. The liver and intestine were promptly removed, washed with ice-cold saline, and the samples were pooled for preparation of microsomes and cytosol by differential ultracentrifugation (Hong et al., 1989). The protein content was assayed according to the instruction of the Bio-Rad protein assay kit.
Glucuronidation of Catechins in Microsomes from Tissues and UGT-BTI-TN-5B1–4 Cells.
The mixture consisted of 0.2 mg of microsomal protein, different concentrations of catechins or methylated catechins, 1 mM UDPGA, 0.15 mM ascorbic acid, 2 mM magnesium chloride, 0.02% Triton-X-100, 1 mM saccharic acid-1,4-lactone, and 40 mM Tris-HCl buffer (pH 7.5) in a final volume of 100 μl. EGCG and 4"-MeEGCG remained chemically stable during the reaction due to the presence of ascorbic acid. After incubation for 30 min at 37°C, the reaction was stopped by adding 100 μl of ice-cold methanol containing 1% ascorbic acid. After centrifugation at 10,000g for 10 min, 160 μl of the supernatant was vortexed with 200 μl of methylene chloride to remove Triton-X-100 and some lipids. After centrifugation, the supernatant (10 μl) was analyzed by LC/MS/MS. A similar method was used for human UGT isozyme-catalyzed glucuronidation using 0.05 mg of microsomal protein and 2.5 μg of alamethicin with 15-min incubation, and the samples were analyzed by LC/MS/MS without methylene chloride treatment.
LC/MS/MS Analysis of Glucuronidation Products.
The LC/MS/MS system consisted of a Thermo Finnigan SpectraSystem separation module equipped with a AS3000 autosampler, a P4000 gradient pump, and a UV6000LP photodiode array V/Vis detector, followed by a Thermo Finnigan LCQ-DECA ion-trap mass detector (San Jose, CA) fitted with an electrospray ionization source. The HPLC conditions were similar to our previous method with modifications (Li et al., 2001). A Supelco HS C18 column (75 mm × 2.1 mm i.d., 3 μm) was used in a binary gradient elution with solution A (methanol/water/acetic acid, 5:494:1, v/v) and solution B (methanol/water/acetic acid, 250:249:1, v/v). The total flow rate was maintained at 0.2 ml/min throughout the run. The elution cycle consisted of an initial 5-min of 90% solution A and then linear gradient by increasing solution B to 54% at 28 min and then immediately to 100% B and maintained for 4 min. Then it was immediately changed back to 90% A and maintained for 12 min. The divert valve was set to introduce the eluate flow during 6.0 to 32.0 min to the mass detector with the other eluate flows to waste. The mass detector was operated in negative ion polarity mode. EGCG-7-Gluc and EGC-7-Gluc were used for the tune-up to select optimal settings for the mass detector to detect EGCG and EGC glucuronides, respectively. The deprotonated molecules exhibiting the same molecular mass as the target catechin conjugates were selected with an isolation width ofm/z 2.0 and stored in the mass analyzer. These parent ions were dissociated with 30% relative collision energy to produce fragment ions. The chemical identity of the catechin glucuronides was determined by comparing their retention time and fragment patterns with those of the standards. The deprotonated aglycone ions for glucuronidated EGCG, EGC, 4′-MeEGC, and 4"-MeEGCG were atm/z 457, 305, 319, and 471, respectively. EGCG and EGC glucuronides were quantified with standard curves of these compounds (detection limits 5–10 pmol, r = 0.990–0.998).
HPLC Analysis of Glucuronides of Methylated EGCG.
The glucuronides of 4"-MeEGCG were analyzed using our previous method (Lee et al., 2000) with modifications. A Supelcosil C18 reversed-phase column (150 mm x 4.6 mm i.d.; 5 μm) was used in a binary gradient elution with solution A (100 mM sodium phosphate buffer containing 1.75% acetonitrile and 0.12% tetrahydrofuran at pH 4.0) and solution B (15 mM sodium phosphate buffer containing 58.5% acetonitrile and 12.5% tetrahydrofuran at pH 4.0). The total flow rate was maintained at 1.0 ml/min throughout the run. The elution cycle consisted of an initial 5 min of 100% solution A and then linear gradients by increasing solution B to 20% at 13 min, 35% at 25 min, and 100% at 26 min. It was maintained at 100% B from 26 to 32 min and finally changed back to 100% A at 32 min. The eluate was monitored by a coulochem electrode array system with potential settings at −90, 100, 300, and 500 mV, and four chromatograms were obtained simultaneously. The formation of 4"-MeEGCG glucuronides was calculated from the decrease of 4"-MeEGCG, which was done by subtracting the remaining levels of 4"-MeEGCG after enzymatic reaction from levels of 4"-MeEGCG in incubations without UDPGA.
DPPH Radical Scavenging Activity.
An aqueous solution of catechins or catechin glucuronides (2–10 μl) was added to a 15 μM DPPH solution in methanol (1.4 ml) with catechin/DPPH molar ratios ranging from 0.025 to 0.4. The absorbance change of the reaction mixture at 505 nm was recorded on a spectrophotometer (Brand-Williams et al., 1995).
Release of Arachidonic Acid and Metabolites from HT-29 Cells.
Human colon cancer HT-29 cells were maintained in McCoy 5A media containing 10% fetal bovine serum and 1% penicillin and streptomycin (growth media). Cells were plated into a 24-well plate at 2.5 × 10⁵ cells in growth media. After 36-h culture, the media was removed and replaced with 1 ml of serum-free Ham′s F-12 media containing 0.1 μCi/ml [5,6,8,9,11,12,14,15-3H(N)] arachidonic acid. After overnight incubation, cells were washed two times with phosphate-buffered saline containing 0.1% bovine serum albumin and incubated with serum-free Ham′s F-12 media for 30 min. Cells were then incubated with 1 ml of serum-free Ham′s F-12 media containing tea polyphenols for 8 h. The extracellular fluid was removed and centrifuged at 10,000g for 10 min. The resultant supernatant was counted with a scintillation counter to quantify the released3H-arachidonic acid and its metabolites.
Data Analysis.
The kinetic parameters (Km andVmax) were calculated with GraphPad Prism 3.0 (GraphPad Software, San Diego, CA). The values obtained represent the best-fit values ± standard error. Two-way analysis of variance were performed with the Microsoft Excel software (Microsoft, Redmond, WA) for evaluating statistical differences between different groups of data. Differences were considered significant whenP < 0.05.
Results
Preparation and Structure Identification of Catechin Glucuronides.
Upon incubation of EGCG with RLM and UDPGA, four EGCG glucuronides were produced, as shown by the four peaks (P7, P3", P3′, and P4") in LC/MS/MS as monitored by the deprotonated molecular ion ofm/z 633 shown in Fig. 1A. The product ion spectra of these four peaks were shown in Fig. 1, C to F, with m/z 457 (EGCG) as their major fragment. Glucuronidation of EGC produced two products, EGC-7-Gluc and EGC-3′-Gluc (Fig. 1B). These compounds were prepared in large scale incubations and purified by HPLC to >99% purity for structural identification.

Representative LC/MS/MS chromatogram of EGCG and EGC glucuronides and MS/MS spectra of EGCG glucuronides.
Incubations were conducted for 30 min using 2 mg/ml of rat (A) or mouse (B) liver microsomal proteins in the presence of 1 mM UDPGA and 400 μM EGCG (A) or 500 μM EGC (B). LC/MS/MS chromatogram was acquired by monitoring the product ion of m/z 457 (A) after applying 30% collision energy to parent ion ofm/z 633 for detection of EGCG glucuronides or by monitoring the product ion ofm/z 305 (B) from the parent ionm/z 481 for detection of EGC glucuronides. MS/MS product ion spectra ofm/z 633 eluting at 20.1 min (C), 24.2 min (D), 25.5 min (E), and 27.2 min (F) were examined in the LC/MS/MS analysis of EGCG glucuronides.
P4" and P7 were identified as EGCG-4"-Gluc and EGCG-7-Gluc, respectively, by 1H and 13C NMR (Table 1). The1H NMR spectrum of compound P4" (Table 1) was very similar to that of EGCG except for the presence of the signals for one glucuronic acid (δ 4.68, H-1‴, 3.45 H-2‴, 3.50 H-3‴, 3.52 H-4‴, and 3.73 H-5‴). The β anomeric configurations for the glucuronic acid were judged from its large3JH1,H2 coupling constants (7.8 Hz). The same proton signals (δ 6.92, s, 2H and 6.49, s, 2H) for H-2′ and H-6′ and H-2" and H-6" indicated that the glucuronidation occurred at position 4′ or 4". The complete interpretation of the NMR data were based on the results of heteronuclear multiple quantum coherence spectroscopy and heteronuclear multiple bond coherence spectroscopy experiments (Table 1). In the HMBC spectrum, Hδ6.92 showed cross peak with the carboxyl ester carbon (δ 167.7) of gallate. Thus, Hδ6.92 were assigned to H-2" and H-6", Hδ6.49were assigned to H-2′ and H-6′. Both Hδ6.92 and H-1‴ showed cross peaks with Cδ138.5. All of these suggested that the glucuronic group located at position 4" (δ 138.5). Therefore, compound P4" was identified as EGCG-4"-Gluc. The1H and 13C assignments of P7 were based on the same strategy used for P4". The glucuronic acid was linked to C-7 because a cross peak between H-1‴ and C-7 was observed in the HMBC spectrum. When pyridine-d5 was used as the solvent, the signals of H-6 and H-8 shifted to δ 6.389 and δ 6.654, respectively, whereas the signal H-1‴ was shifted to δ 5.358d (8.0). Both H-6 and H-8 were observed to have correlation with H-1‴ in rotating-frame Overhauser enhancement spectroscopy spectrum, which further confirmed that the glucuronidation of P7 occurred at position 7. Similarly, the structures of EGC-3′-Gluc and EGC-7-Gluc were elucidated by NMR (Table2).
1H and 13C NMR chemical shifts of EGCG, P4", and P7 (CD3OD). δ in ppm, J in Hz
1H and 13C NMR chemical shifts of M21 and M16
LC/MS/MS analysis confirmed the structures of EGCG-7-Gluc and EGCG-4"-Gluc and identified P3" and P3′ as EGCG-3"-Gluc and EGCG-3′-Gluc, respectively (Fig. 1). The existence of product ion ofm/z 481 (EGC-glucuronide) from P7 and P3′ suggests that the glucuronidation is not at the d-ring (Fig. 1, C and E). The existence of product ion of m/z 345 (d-ring glucuronide) from P3" and P4" suggests that the glucuronidation is at the d-ring (Fig.1, D and F). The product ion of m/z 507 was derived from the loss of the B-ring (m/z 126) from EGCG glucuronide (m/z 633), indicating the absence of B-ring glucuronide (Fig. 1C). The product ion ofm/z 331 was formed from the loss of the B-ring from EGCG (Fig. 1E). It is known that if the 4′-position is occupied by a methoxyl or ester group, the formation of product ionm/z 331 will be retarded (Miketova et al., 2000). The glucuronidation on the 3′-position of EGC also suggests the glucuronidation on the 3′-position of the B-ring of EGCG. Therefore, P3′ was identified as EGCG-3′-Gluc, and P4" and P3" were identified asd-ring mono-O-glucuronides of EGCG. Since P4" was identified as EGCG-4"-Gluc by NMR, P3" was assigned as EGCG-3"-Gluc. P3′ and P3" were tentatively identified as β-glucuronides since they were readily hydrolyzed by β-glucuronidase. Structures of the EGCG and EGC glucuronides are shown in Fig. 2. The human UGTs that catalyze their formation are described in a subsequent section.
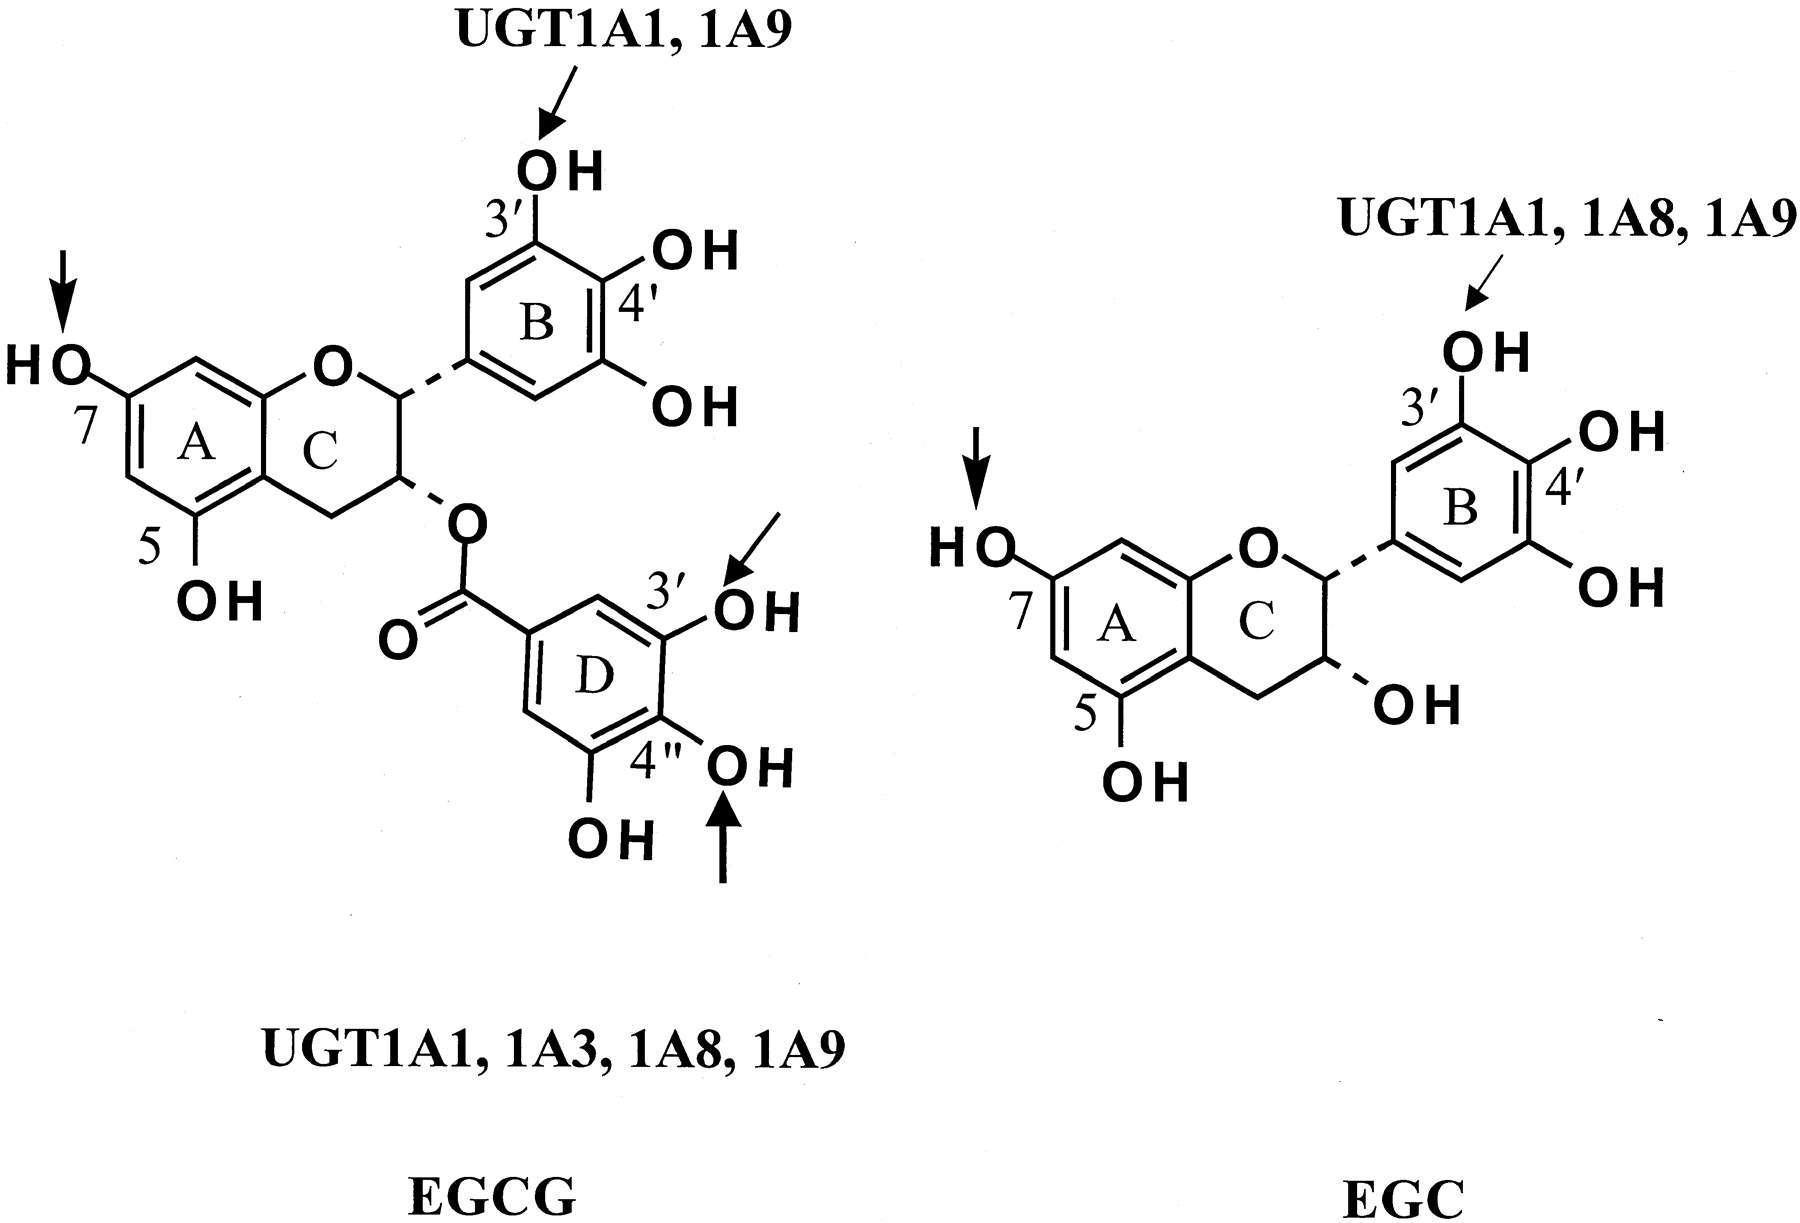
Sites of EGCG and EGC glucuronidation.
The glucuronidation sites by human and rodent enzymes are indicated by arrows. The human UGT isozymes responsible for the activity are also shown. Glucuronidation at position 7 is catalyzed by rodent enzymes.
Enzymology of Catechin Glucuronidation in Mouse, Rat, and Human Microsomes.
When human liver microsomes (HLM) and mouse liver microsomes (MLM) were used in the incubation, the formation of glucuronides of EGCG and EGC was time-dependent and linear for up to 30 min. With purified EGCG and EGC glucuronides as standards, we characterized the glucuronidation of EGCG and EGC in mouse, rat, and human microsomes. Most of the glucuronidation reactions followed Michaelis-Menten kinetics except that a decrease in EGCG-3′-Gluc formation was observed with MLM at high EGCG concentrations due to substrate inhibition (Fig.3). The apparent kinetic parameters are summarized in Tables 3 and4.

Concentration-dependent glucuronidation of EGCG in human liver (A), rat liver (B), mouse liver (C), and mouse intestine (D) microsomes.
Incubations were conducted for 30 min using 2 mg/ml of microsomal proteins in the presence of 1 mM UDPGA and different concentrations of EGCG as detailed under Materials and Methods. The formation of EGCG glucuronides was quantified with LC/MS/MS. Values represent mean of duplicate analysis.
Kinetic parameters of EGCG glucuronidation in microsomes from human, mouse, and rat tissues
Kinetic parameters of EGC glucuronidation in liver microsomes from humans, mice, and rats
In all of these microsomes, the UGT activity of EGCG glucuronidation was higher than that of EGC glucuronidation. In incubation with HLM, EGCG-4"-Gluc, EGCG-3′-Gluc, and EGC-3′-Gluc were the major glucuronides detected. EGCG-3"-Gluc was a minor product in incubations with RLM and existed in only trace amount in incubations with HLM and MLM. HLM had a 4.5-fold higher catalytic efficiency (Vmax/Km) for glucuronidation at the 4"-position than at the 3′- position (Table3).
With RLM, the activity of EGCG-4"-glucuronidation was lower than with HLM, but EGCG-7-Gluc formation was more pronounced (Fig. 3B). With RLM, EGC-7-Gluc was the major EGC glucuronide formed and EGC-3′-Gluc was a minor product. The activities of EGCG and EGC glucuronidation in rat small intestine were very low (data not shown). MLM had higher UGT activities than HLM; EGCG-4"-Gluc, EGCG-3′-Gluc, EGC-3′-Gluc, and EGC-7-Gluc were the major products (Table 4). In incubations with mouse small and large intestinal microsomes, high activity in the formation of EGCG-4"-Gluc was observed (Fig. 3D), but the activity for EGC glucuronidation was very low.
Glucuronidation of EGCG and EGC by Human UGT Isozymes.
The glucuronidation of EGCG and EGC by human UGT1A1, 1A3, 1A4, 1A6, 1A8, 1A9, 1A10, 2B7, and 2B15 was examined. UGT1A1, 1A3, 1A8, and 1A9 had significant activities with 100 μM EGCG or EGC. Much weaker EGCG glucuronidation activity was also found with UGT1A10, but no EGCG and EGC glucuronidation activity was detected in incubations with UGT1A4, 1A6, 2B7, and 2B15. The kinetic parameters of EGCG and EGC glucuronidation by UGT1A1, 1A3, 1A8, and 1A9 are summarized in Table5, and their regioselectivities are shown in Fig. 2. All four of these UGT isozymes had higher activity with EGCG than with EGC. EGCG-4"-Gluc was the only EGCG glucuronide formed by UGT1A3 and UGT1A8. The intestinal form of UGT1A8 had the highestVmax and catalytic efficiency for EGCG. UGT1A1 and UGT1A9 had, respectively, 7.4- and 4.3-fold higherVmax/Kmvalues for EGCG4"-glucuronidation than 3′-glucuronidation. Our Western blot result showed that the relative band intensities of UGT1A1, 1A3, 1A8, and 1A9 were 698, 720, 140, and 376 per microgram of protein loaded. After normalization of Vmaxvalues with UGT protein levels, the relativeVmax/Kmvalues of UGT1A1, 1A3, 1A8, and 1A9 for the formation of EGCG-4"-Gluc were 123, 11, 997, and 252, respectively. Therefore, the activity of UGT1A8 with EGCG was much higher than that of UGT1A1, 1A3, and 1A9. EGC-3′-Gluc was the only EGC glucuronide formed by these human enzymes and UGT1A9 had the highest Vmax and lowest Km for EGC. UGT1A1 and UGT1A8 also had significant activity with EGC, but the activity of UGT1A3 was very low.
Kinetic parameters of EGCG and EGC glucuronidation by human UGTs expressed in insect cells
Effects of Methylation on the Glucuronidation of EGCG and EGC.
The glucuronidation of EGCG and 4"-MeEGCG by UGT1A1, 1A3, 1A8, and 1A9 were compared. The activities of UGT1A1, 1A3, and 1A8 were much lower with 4"-MeEGCG than EGCG (Fig. 4A-C), whereas activity of UGT1A9 was significantly higher (P< 0.05) with 4"-MeEGCG than EGCG at high substrate concentration (Fig.3D). With UGT1A9, only one glucuronide of 4"-MeEGCG formed (product ionm/z 359 suggesting the possibled-ring conjugation of 4"-MeEGCG), whereas two major glucuronides (at the d-ring and B-ring) were formed from EGCG. UGT1A9 also had higher activity with 4′,4"-DiMeEGCG (Vmax 14.5 ± 1.7 nmol/mg/min) than EGCG (Vmax 5.0 ± 0.4 nmol/mg/min).

Effects of methylation on the glucuronidation of EGCG and EGC.
Human UGT 1A1 (A), 1A3 (B), 1A8 (C), and 1A9 (D) were used at a protein concentration of 0.5 μg/ml for the glucuronidation of EGCG and 4"-MeEGCG. Mouse liver microsomes (2 mg protein/ml) were used for the glucuronidation of EGC (E) and 4′-MeEGC (F). The incubation was conducted in the presence of 1 mM UDPGA for 15 min. The formation of EGCG or EGC glucuronides was quantified by LC/MS/MS. The formation of 4"-MeEGCG glucuronide was quantified with HPLC by measuring the decrease of 4"-MeEGCG after incubation in comparison to an incubation in the absence of UDPGA. The formation of 4′-MeEGC glucuronide was in arbitrary units of peak height on LC/MS/MS, because a standard was not available. Values represent mean of duplicate analysis.
Using MLM as a UGT source, the Km andVmax values for the formation of EGC-7-Gluc and EGC-3′-Gluc were similar (Fig. 4E), but the kinetics patterns of glucuronidation at these two positions was changed by the 4′-methylation of EGC (Fig. 4F). At high concentrations of 4′-MeEGC, the glucuronidation on the 7-position was favored over the 3′-position.
Hydrolysis of Catechin Glucuronides by β-Glucuronidases from Different Sources.
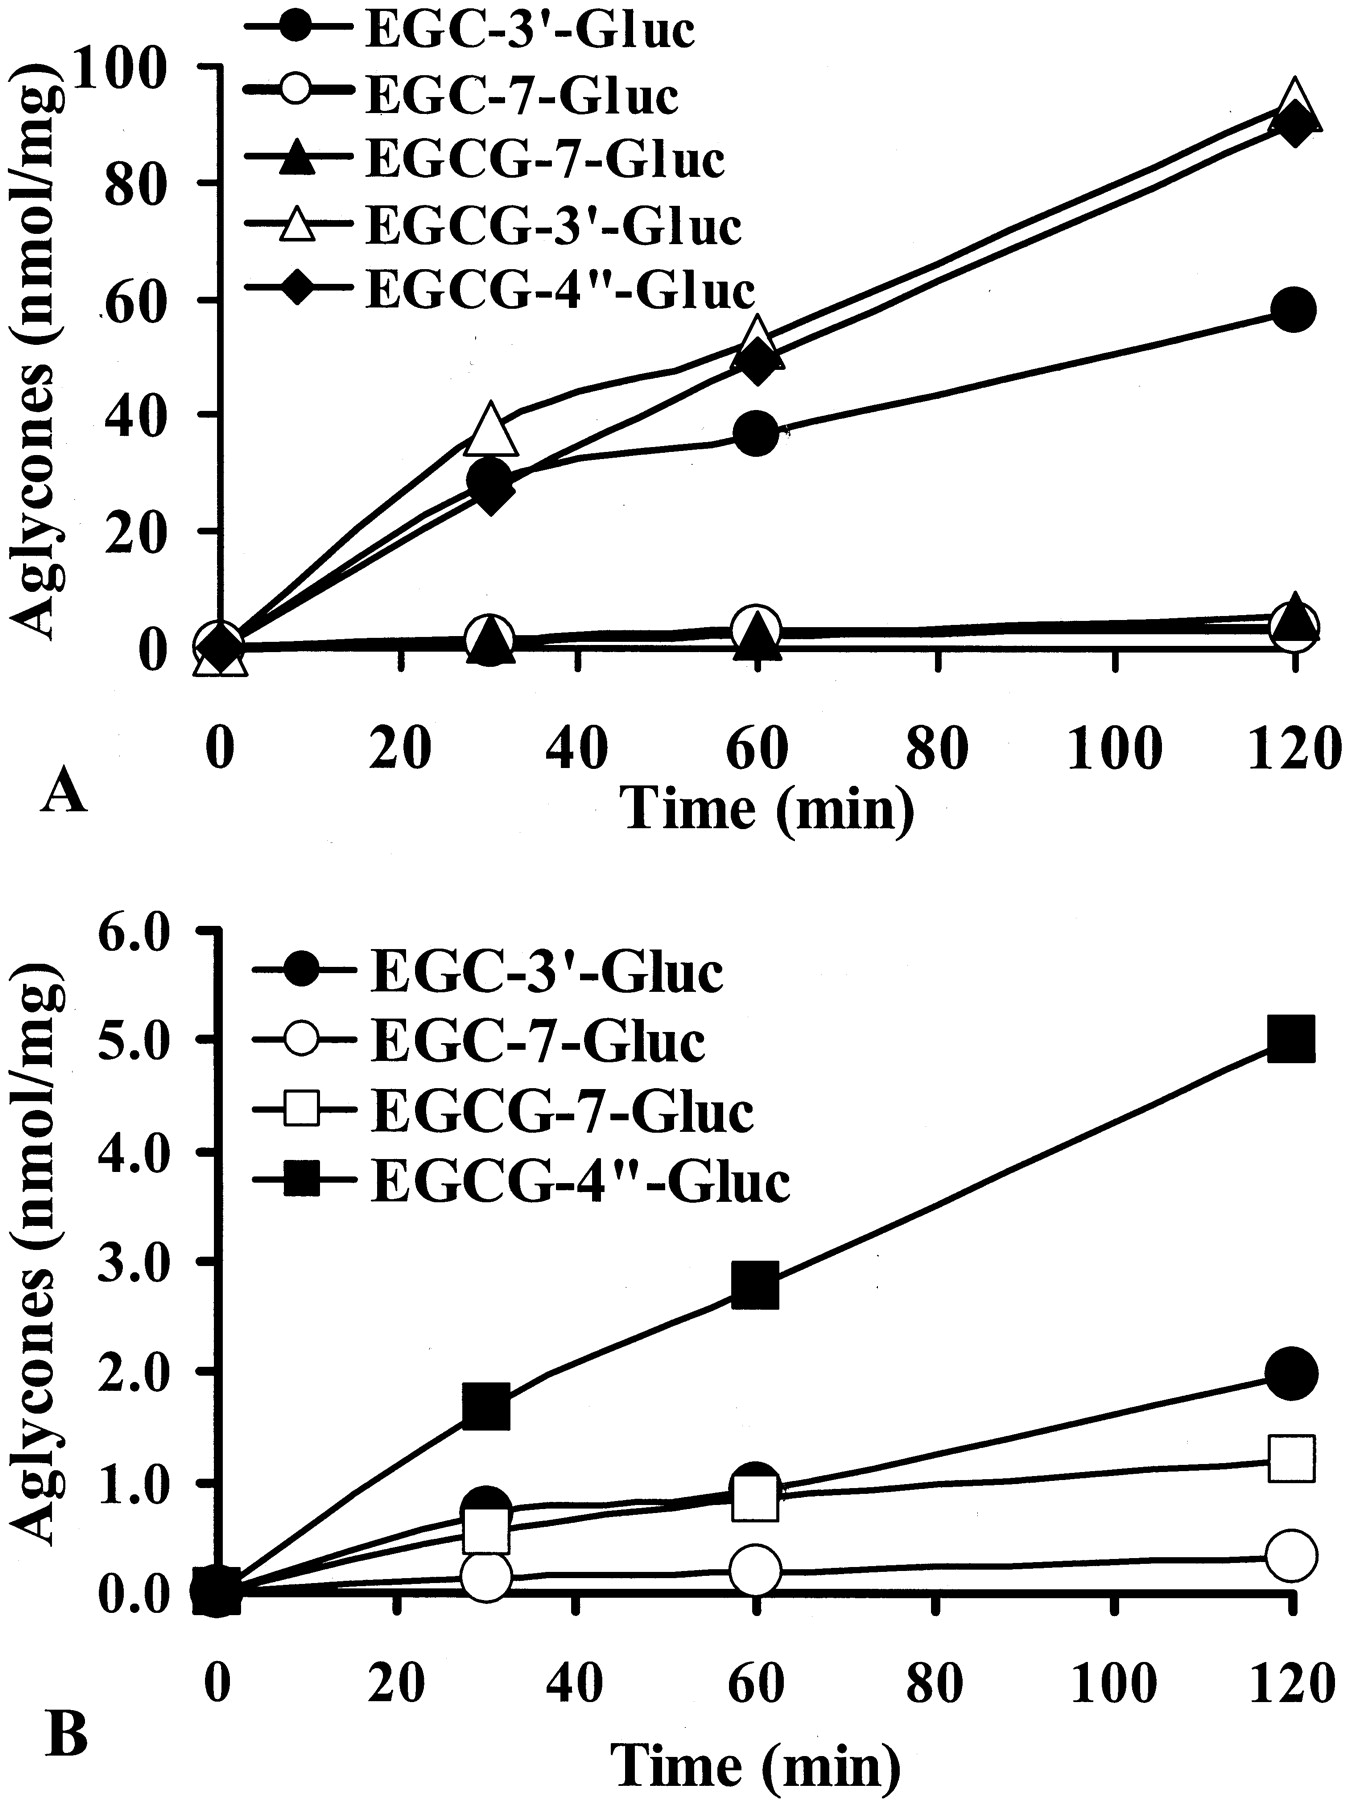
The hydrolysis of EGCG and EGC glucuronides to free EGCG and EGC was catalyzed by enzymes in liver homogenates and HT-29 cell homogenates (Fig. 5). Addition of 2 mM saccharic acid-1,4-lactone, a specific β-glucuronidase inhibitor, completely inhibited the hydrolysis of all glucuronides. The B-ring andd-ring glucuronides, EGCG-3′-Gluc, EGCG-4"-Gluc, and EGC-3′-Gluc, were readily hydrolyzed to their aglycones by β-glucuronidase in mouse liver homogenates (Fig. 5A), but the hydrolysis of the A-ring glucuronides, EGCG-7-Gluc and EGC-7-Gluc, was much slower. Mouse kidney homogenates had similar activity to mouse liver homogenates in hydrolyzing EGCG-4"-Gluc and EGC-3′-Gluc (e.g., 48 versus 54 pmol/mg/min at 2 μM of EGCG-4"-Gluc). With HT-29 cell homogenates, the activities were much lower than these tissue homogenates, and EGCG-4"-Gluc was the best substrate (Fig. 5B). All EGCG and EGC glucuronides, except EGCG-7-Gluc, were completely deglucuronidated to their aglycone by E. coliβ-glucuronidase within 30 min.

Hydrolysis of EGCG and EGC glucuronides by mouse liver homogenates (A) and HT-29 cell homogenates (B).
EGCG and EGC glucuronides (20 μM) were incubated with 0.2 mg/ml of homogenate protein at pH 5.0. The release of EGCG or EGC was analyzed with HPLC. Values represent mean of duplicate analysis.
Radical Scavenging Activity of EGCG and EGC Glucuronides.
EGCG and (−)-epicatechin gallate had potent free radical scavenging activity and were more effective than EGC and (−)-epicatechin, respectively (Fig. 6). EGCG-3′-Gluc and EGCG-3"-Gluc maintained similar potency as free EGCG. EGCG-4"-Gluc, EGCG-7-Gluc, EGC-7-Gluc were less effective than their parent compounds, and EGC-3′-Gluc was much less effective than EGC. The EC50 of DPPH radical scavenging activities expressed as molar ratio of catechin/DPPH were EGCG-3"-Gluc (0.035), EGCG-3′-Gluc (0.037), EGCG (0.039) < (−)-epicatechin gallate (0.051) < EGC (0.080), EGCG-7-Gluc (0.081), EGCG-4"-Gluc (0.084) < EGC-7-Gluc (0.11), (−)-epicatechin (0.12) < EGC-3′-Gluc (0.19), ascorbic acid (0.19).
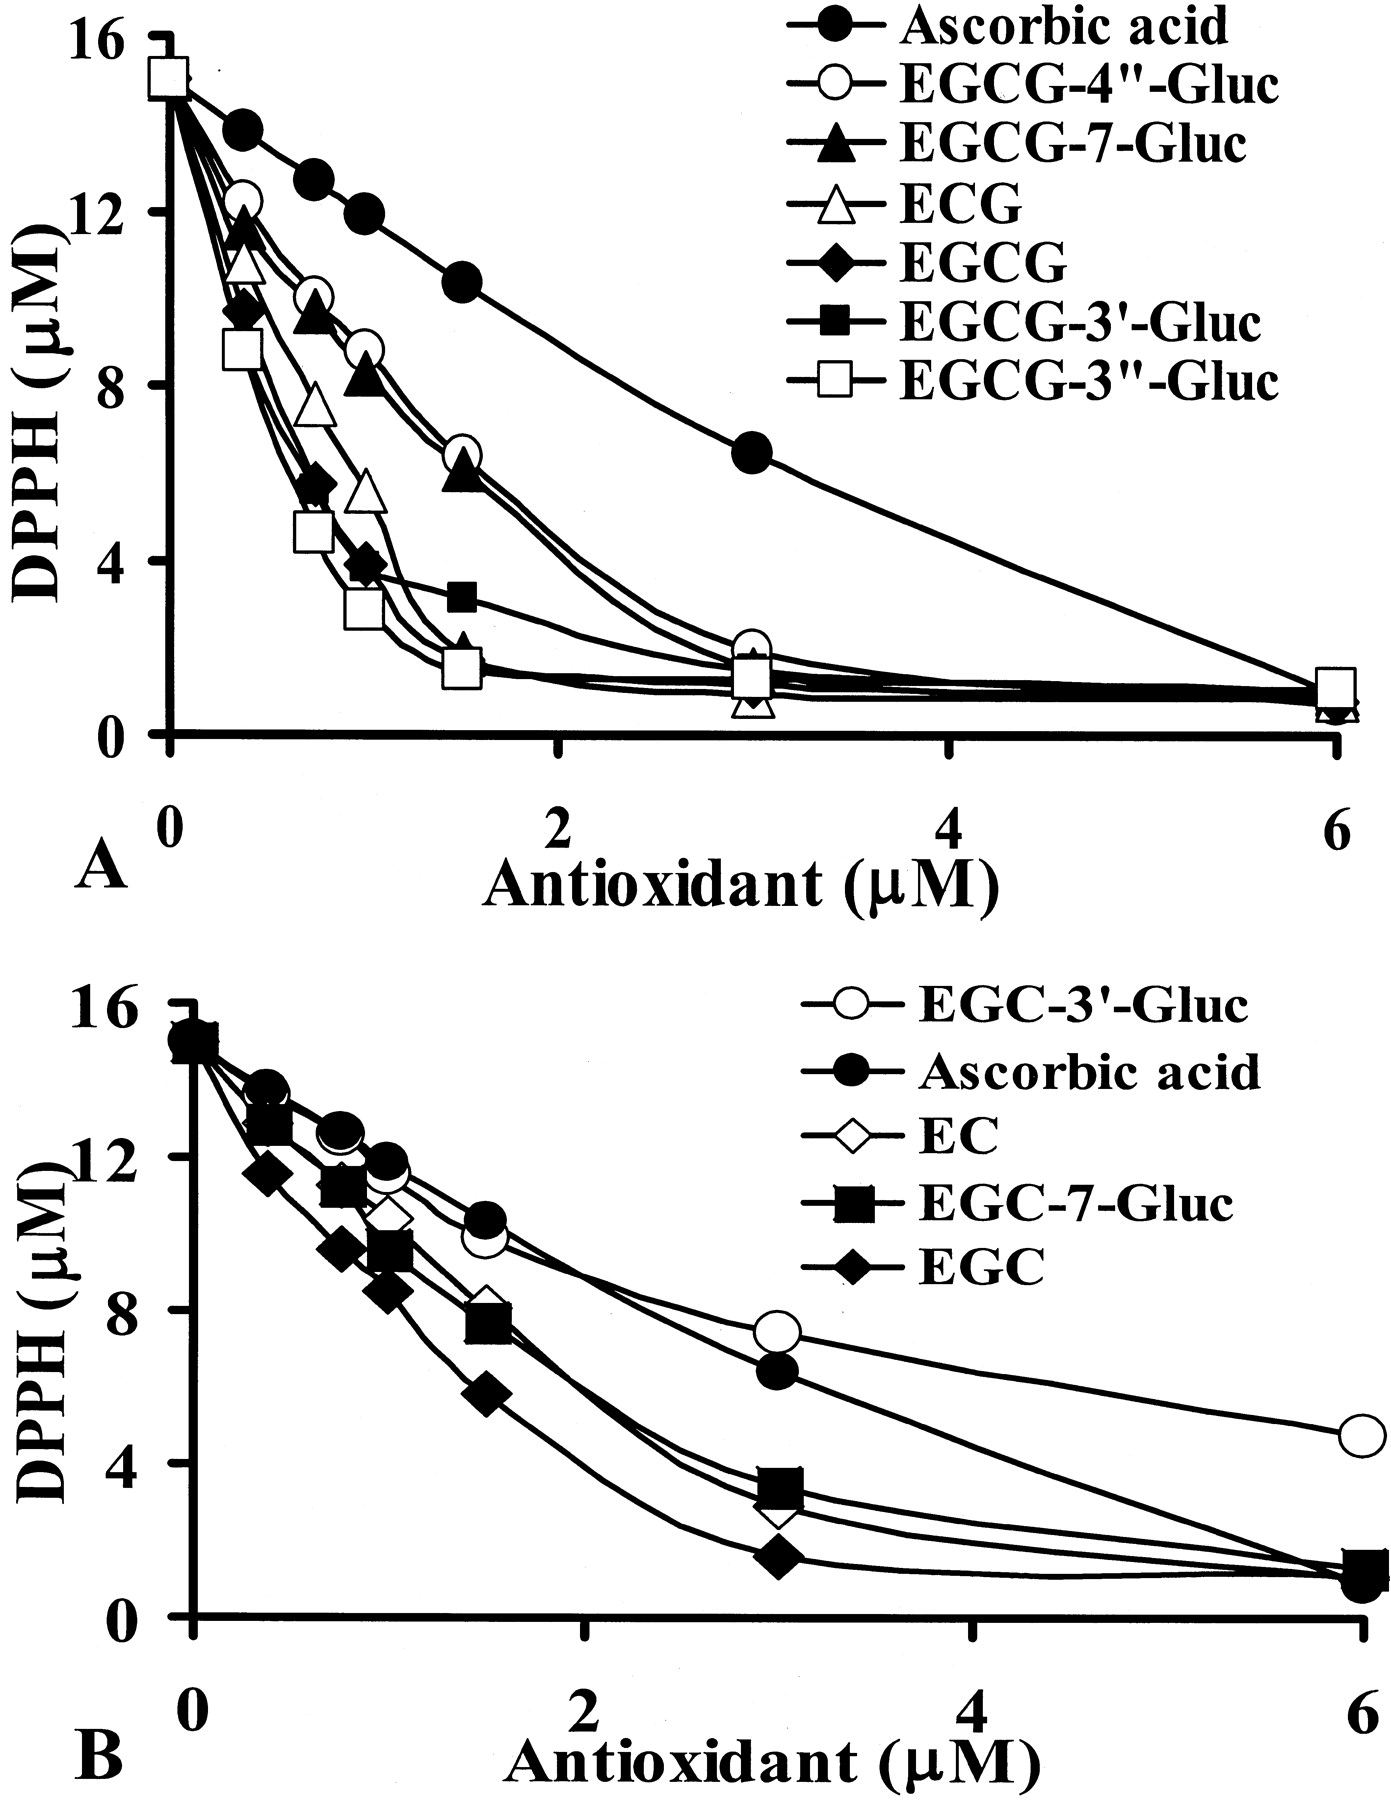
Radical scavenging activities of glucuronides of EGCG (A) and EGC (B) with DPPH as the stable radical.
Chemicals were added into methanol containing 15 μM DPPH with catechin/DPPH molar ratios ranging from 0.025 to 0.4. After equilibrium was reached, the absorbance of the reaction mixture at 505 nm was recorded. The DPPH concentrations were calculated with DPPH standard curve. Values represent the mean of quadruplicated analyses.
Inhibition of Release of Arachidonic Acid and Its Metabolites from HT-29 Cells.
At 2 and 10 μM, all tested catechins and their glucuronides significantly inhibited the release of arachidonic acid and its metabolites from HT-29 cells (Fig. 7). At both 2 and 10 μM, EGC-3′-Gluc was significantly less effective than EGC-7-Gluc, which had comparable activity to EGC. At 2 μM, the activity of EGCG-7-Gluc was lower than EGCG, whereas the other three EGCG glucuronides had the same potency as EGCG. Ascorbic acid had no effect on arachidonic acid release at concentrations as high as 50 μM.

Inhibition of arachidonic acid release from HT-29 human colon cancer cells by EGC, EGC, and related glucuronides.
After overnight incubation of HT-29 cells with 1 ml of serum-free Ham's F-12 media containing 0.1 μCi/ml [5,6,8,9,11,12,14,15-3H(N)] arachidonic acid, cells were washed two times with phosphate-buffered saline containing 0.1% bovine serum albumin and incubated with serum-free Ham′s F-12 media for 30 min. Cells were then incubated with 1 ml of serum-free Ham's F-12 media containing tea polyphenols for 8 h. The extracellular fluid was removed and centrifuged. The resultant supernatant was counted with a scintillation counter to measure the release of3H-arachidonic acid and its metabolites. Values represent mean ± S.D. (n = 4). Values with labels containing different letters are statistically different (P < 0.05).
Discussion
The present study demonstrates significant species and tissue differences in the glucuronidation of EGCG and EGC. MLM have the highest activity in catalyzing EGCG glucuronidation, which occurs mainly at the 4"- and 3′-positions (Table 3). HLM also actively catalyze the glucuronidation at these positions. Among human UGT isozymes studied, enzymes of the UGT1A subfamily, UGT1A1, 1A3, 1A8, and 1A9 have high or modest activities in the glucuronidation of EGCG at 4"-position; their activities toward EGC (mainly at the 3′- position) are lower (Table 4). RLM have lower activity than MLM and HLM and catalyzed glucuronidation mainly at the 7-position forming EGCG-7-Gluc and EGC-7-Gluc (Tables 3 and 4). Rat small intestine also has much lower UGT activity with EGCG than mouse small intestine, and perhaps human small intestine judging from the rather high activity displayed by the intestinal UGT1A8 toward EGCG. Based on these observations, mice appear to be more similar to humans than rats to humans in the glucuronidation of EGCG. The observed low activity of EGCG and EGC glucuronidation by RLM is consistent with a previous report (Antonio et al., 2002). The finding that the rat is a poor model species for predicting human glucuronidation has been reported for the in vitro glucuronidation of (−)-epicatechin, entacapone, tolcapone, propofol, LF 4.0212, and morphine (Lautala et al., 2000; Bock et al., 2002;Vaidyanathan and Walle, 2002).
The apparent Km values for EGCG glucuronidation obtained in incubations with human UGT isozymes are lower than with pooled HLM. The reason for this difference is not known. It may be due to nonspecific binding of EGCG to microsomal components. Nonspecific binding of the substrate to microsomes decreases the effective substrate concentration, leading to an increase in the apparent Km for substrate (Venkatakrishnan et al., 2000). In our study on the glucuronidation of EGCG, when the HLM protein concentration was decreased from 1.0 mg/ml to 0.5 mg/ml, the Km of forming 4"-and 3′-glucuronides decreased by 50 to 60% from the values reported in Table 3. The apparent Km values for EGC glucuronidation by human UGT isozymes and pooled HLM were closer than those for EGCG glucuronidation. This may be due to the much lower binding affinity of EGC than EGCG to microsomal proteins (Wang et al., 1988) and lipids bilayers (Nakayama et al., 2000).
When the major glucuronidation site of EGCG is occupied by a methyl group, such as in the case of 4"-MeEGCG, the activities of UGT1A1, 1A3, and 1A8 are much lower. However, with UGT1A9, 4"-methylation appears to enhance glucuronidation at the same d-ring, probably due to the relative high reactivity of UGT1A9 with sterically hindered phenolic group (Ethell et al., 2001). Human kidney is known to have high expression of UGT1A9 (Albert et al., 1999) and high activity of catechol-O-methyltransferase (Mannisto and Kaakkola, 1999), which can methylate EGCG to 4"-MeEGCG and then to 4′,4"-DiMeEGCG (Lu et al., 2003). Renal methylation of EGCG to 4′,4"-DiMeEGCG and its subsequent UGT1A9-catalyzed glucuronidation may explain the 4′,4"-DiMeEGCG (in the glucuronide form) observed in the human urine samples after ingestion of green tea (Meng et al., 2002).
UGT1A9 is expressed in the liver, kidney, small intestine, prostate, and breast (Albert et al., 1999). UGT1A1 and 1A3 are expressed in various tissues, including the liver, jejunum, and colon (Fisher et al., 2000; Strassburg et al., 2000). UGT1A8 is expressed in human jejunum, ileum, and colon but not in the kidney and liver (Cheng et al., 1998). Considering theVmax/Kmof EGCG-4"-Gluc and EGCG-3′-Gluc formation with UGT isozymes (Table 5), UGT1A1 and UGT1A9 appear to be the two major UGTs contributing to the hepatic glucuronidation of EGCG and EGC in vivo, even though UGT1A3 may be more abundant (Congiu et al., 2002). The profile of EGCG glucuronide formation in HLM is also consistent with this conclusion. Glucuronidation of EGCG and EGC may also occur in many extrahepatic tissues. Polymorphic forms of UGT1A1 and 1A8 associated with reduction in catalytic activity exist in certain individuals (Fisher et al., 2000; Mackenzie et al., 2000; Huang et al., 2002) and glucuronidation of EGCG may have large interindividual variations.
Intestinal expressions of UGT1A1, 1A3, and 1A9 have been reported (Albert et al., 1999; Fisher et al., 2000; Strassburg et al., 2000), and intestine-specific isoform UGT1A8 has much higherVmax/Kmvalue with EGCG than other UGTs (Table 5). Intestinal glucuronidation is known to play a major role in the first pass metabolism (Fisher et al., 2001), and high level of MRP2 expression has been detected in human small intestine (Taipalensuu et al., 2001; Nakamura et al., 2002). Intestinal glucuronidation of EGCG and efflux of EGCG-4"-Gluc may play an important role in determining the bioavailability of EGCG in humans. We have shown recently that EGCG is metabolized to EGCG-4"-Gluc in HT-29 human colon cancer cells and then pumped out of the cells, probably by MRP2 because treatment of MRP inhibitor (indomethacin) resulted in a 10-fold increase of intracellular levels of EGCG-4"-Gluc (Hong et al., 2002). After EGCG is absorbed into the blood stream and liver, the hepatic UGTs convert it to mainly EGCG-4"-Gluc. This metabolite apparently is mainly pumped by MRP2 into the bile, because EGCG is mostly excreted through the bile in the feces and only a small amount is excreted in the urine (Lee et al., 1995;Chen et al., 1997; Kida et al., 2000). This proposal is also consistent with the observation that EGCG exists mainly in the nonconjugated form in the blood (Chow et al., 2001). EGCG glucuronide may be hydrolyzed by β-glucuronidase, which is mainly located in the lysosomes and endoplastic reticulum. However, cellular β-glucuronidase may be released into extracellular matrix in high local concentrations by certain inflammatory cells or necrotic tumor cells (Bosslet et al., 1998). Therefore, EGCG glucuronide could be hydrolyzed at these sites to regenerate EGCG.
Reactive oxygen species and aberrant arachidonic acid metabolism are believed to contribute to carcinogenesis. Therefore, we studied the activities of catechin glucuronides in scavenging radicals and inhibiting arachidonic acid release. Most of the EGCG and EGC glucuronides still retained radical scavenging activities similar to those of the respective aglycones. Interestingly, EGCG-3′-Gluc had similar activity to EGCG in scavenging radical, whereas EGC-3′-Gluc was less active than EGC. A possible interpretation is that the B-ring is mainly responsible for the antioxidative activity of EGC, whereas with EGCG, when the B-ring is conjugated, the d-ring still effectively exhibits antioxidative activity.
EGCG and EGC glucuronides had different activities in inhibiting arachidonic acid release from HT-29 cell line. Such inhibition appears not to be related their antioxidative activity, since ascorbic acid (50 μM) had no effect. The inhibitory effects could be due to either the intrinsic biological activity of these glucuronides or their aglycones produced in the presence of cellular β-glucuronidase. The possible physiological importance of the inhibition of arachidonic acid release by catechin glucuronides needs to be investigated.
As the major water-extractable constituents of green tea, tea catechins are consumed by a very large population. The present work demonstrates that EGCG and EGC are extensively glucuronidated by intestinal and hepatic UGT enzymes. Glucuronidation of EGCG and EGC, in conjunction with efflux transporters, may be key factors determining the bioavailability of these compounds in humans. EGCG may also serve as a competitive substrate for the glucuronidation of drugs or endogenous compounds, and thus affect their bioavailabilities. Some of the EGCG and EGC glucuronides retain radical quenching and other biological activities of the aglycone. More studies on the formation and biological activities of these metabolites are needed for better understanding the biological effects of tea consumption.
Acknowledgments
The LC/MS/MS analysis was conducted in the Analytical Center (directed by Dr. Brian Buckley) at the Environmental and Occupational Health Sciences Institute. The mouse liver tissue for the biosynthesis of EGC glucuronides was collected from an experiment conducted by Drs. Yaoping Lu and Allan H. Conney at Rutgers University. We thank Dr. Joshua Lambert for helpful suggestions in the preparation of this manuscript.
Footnotes
-
This work was supported by National Institutes of Health Grants CA56673 and CA88961.
- Abbreviations used are::
- EGCG
- (−)-epigallocatechin gallate
- EGC
- (−)-epigallocatechin
- EGCG-7-Gluc
- (−)-EGCG-7-O-glucuronide (and similar abbreviations for other glucuronides)
- 4′-MeEGC
- 4′-O-methyl-(−)-epigallocatechin
- 4"-MeEGCG
- 4"-O-methyl-EGCG
- 4′,4"-DiMeEGCG
- 4′,4"-di-O-methyl-EGCG
- DPPH
- 1,1-diphenyl-2-picrylhydrazyl
- UGT
- UDP-glucuronosyltransferase
- UDPGA
- uridine 5′-diphosphoglucuronic acid
- G-7896
- Escherichia coliβ-d-glucuronidase
- HLM
- human liver microsomes
- MLM
- mouse liver microsomes
- RLM
- rat liver microsomes
- LC/MS/MS
- liquid chromatography mass spectrometry
- HPLC
- high performance liquid chromatography
- Received October 15, 2002.
- Accepted January 3, 2002.
- The American Society for Pharmacology and Experimental Therapeutics


