


Abstract
In this study we describe a battery of fluorescence assays for rapid measurement in intact cells of the activity of nine cytochromes P450 (P450s) involved in drug metabolism. The assays are based on the direct incubation of monolayers of cells expressing individual P450 enzymes with a fluorogenic substrate followed by fluorimetric quantification of the product formed and released into incubation medium. For each individual P450 activity, different fluorescence probes were examined, and the one showing the best properties (highest metabolic rates, lowest background fluorescence) was selected: 3-cyano-7-ethoxycoumarin for CYP1A2 and CYP2C19, coumarin for CYP2A6, 7-ethoxy-4-trifluoromethylcoumarin for CYP2B6, dibenzylfluorescein for CYP2C8, 7-methoxy-4-trifluoromethylcoumarin (MFC) for CYP2C9 and CYP2E1, 3-[2-(N,N-diethyl-N-methylammonium)ethyl]-7-methoxy-4-methylcoumarin for CYP2D6, and 7-benzyloxy-4-trifluoromethylcoumarin for CYP3A4. Fluorescence-based assays are highly sensitive and allow the simultaneous measurement of a large number of samples using plate readers, thus enhancing sample throughput. Major advantages over high-throughput assays in subcellular fractions are that, as living cells are used, manual handling and enzyme damage are minimized, the endoplasmic reticulum of the cells remains intact, exogenous cofactors or NADPH-regenerating systems are not required, and transport processes are maintained. These assays can be applied to preliminary screening of inhibitory effects of new drugs on individual P450 enzymes. After comparison of the results obtained using the fluorescent probes in intact P450-expressing cells and those obtained using the high-performance liquid chromatography-based selective assays in the same cells, in primary human hepatocytes or in human liver microsomes, a fairly good agreement was found.
Drug metabolism is one of the major determinants of drug clearance and the factor that is most frequently responsible for the interindividual differences in drug pharmacokinetics. Inappropriate pharmacokinetics result in an inadequate or variable clinical response of the drug that frequently compromises its therapeutic usage. Cytochrome P450 (P450) enzymes are major players in the oxidative metabolism of a wide range of structurally diverse xenobiotics including drugs. In the past two decades, thanks to the use of purified enzymes, the identification of selective substrates/inhibitors, and the application of recombinant DNA technology to P450 genes, great progress has been made in the characterization of the role of human P450s in the metabolism of therapeutic agents. To speed up the selection of new drug candidates, pharmaceutical industries increasingly make use of different in vitro systems to investigate drug metabolism. As a result of this, it is now possible to identify the metabolic profile of drug candidates, potential drug interactions, or the role of polymorphic enzymes before clinical trials start, resulting in more cost-effective and ethically acceptable studies (Rodrigues, 1999).
The large number of chemicals to be tested has created a need for high-throughput methods for screening of compounds for favorable metabolic properties in drug discovery. Among the different in vitro models developed for drug metabolism studies, recombinant P450 systems are now increasingly used (Masimirembwa et al., 1999; Rodrigues, 1999; Yoshitomi et al., 2001). P450 enzymes heterologously expressed in different cells show catalytic properties comparable with those of human liver microsomes (Gonzalez and Korzekwa, 1995; Masimirembwa et al., 1999). These enzymes can be produced in large amounts to meet the increasing demand of screening models for drug metabolism research. Metabolism of the new molecule can be easily examined after incubation with each P450-expressing system separately, helping to elucidate the metabolic pathways of the compound. The correct interpretation of kinetic data from cDNA-expression systems requires the confirmation of their metabolic competence. Therefore, measurement of individual P450 activities is needed for each experiment.
A critical point for measuring P450 activities is the selection of probe substrates. Only a few molecules are useful as selective probes for individual P450s, and most of them involve laborious HPLC separations for metabolite detection, which severely limits sample throughput. More recently, fluorimetric methods that do not require metabolite separation have been described. These methods make use of non- or low-fluorescent P450 substrates that produce highly fluorescent metabolites in aqueous solutions. Fluorogenic probes with limited aqueous solubility, poor metabolite formation, high background fluorescence, low signal-to-noise ratio, or excitation wavelength in the UV range are not appropriate for high-throughput P450 activity screening. Different O-alkyl derivatives of resorufin (Burke et al., 1985), fluorescein (Stresser et al., 2000), 7-hydroxycoumarins (White, 1988; Ekins et al., 1997; Venhorst et al., 2000; Bapiro et al., 2001; Chauret et al., 2001), 6-hydroxyquinolines (Stresser et al., 2000), and 4-methylsulfonylphenyl furanones (Chauret et al., 1999) have been proposed as useful probes for this purpose. Some fluorimetric probes have been reported to be selective for individual P450 activities (Nerurkar et al., 1993; Chauret et al., 1999, 2001; Renwick et al., 2000), but most of them are not selective. Nonselective substrates are not appropriate for in vitro models showing several P450s such as human liver microsomes or hepatocytes. This limitation has been addressed by the use of individually expressed recombinant enzymes.
In the present article we described a battery of fluorescence assays for rapid measurement of nine P450 activities in intact monolayers of cells expressing individual P450s. Cultured cells are directly incubated with the selected substrate, and the corresponding metabolite formed and released into incubation medium is fluorimetrically quantified. These assays offer the possibility of easily selecting cells showing P450 activities as well as screening inhibitory effects of new drugs on individual P450 enzymes. A fairly good agreement was found after comparison of the results obtained using the fluorescent probes in intact P450-expressing cells and those obtained using the HPLC-based selective assays in the same cells, in primary human hepatocytes or in human liver microsomes.
Materials and Methods
Chemicals and Reagents. 7-Ethoxy-4-trifluoromethylcoumarin (EFC), 7-hydroxy-4-trifluoromethylcoumarin (HFC), (S)-(+)-mephenytoin, (±)-4′-hydroxymephenytoin, dextromethorphan hydrobromide, dextrorphan, 6β-hydroxytestosterone, 6-hydroxychlorzoxazone, 4′-hydroxydiclofenac, paclitaxel, furafylline, nifedipine, and omeprazole were supplied by Ultrafine Chemicals (Manchester, UK). Dibenzylfluorescein (DBF), 3-[2-(N,N-diethyl-N-methylammonium)ethyl]-7-methoxy-4-methylcoumarin (AMMC), 3-[2-(diethylamino)ethyl]-7-hydroxy-4-methylcoumarin, 7-benzyloxy-4-trifluoromethylcoumarin (BFC), 7-methoxy-4-trifluoromethylcoumarin (MFC), and 6α-hydroxypaclitaxel were obtained from BD Gentest (Woburn, MA). 3-Cyano-7-ethoxycoumarin (CEC), 3-cyano-7-hydroxycoumarin, and 7-methoxyresorufin were purchased from Molecular Probes Europe BV (Leiden, The Netherlands). Fluorescein, chlorzoxazone, diclofenac sodium, coumarin, 7-hydroxycoumarin, resorufin, testosterone, amiodarone, cimetidine, cyclosporin A, diethyldithiocarbamate, erythromycin, ketoconazole, lovastatin, methoxsalen, quercetin, quinidine, quinine, sulfaphenazole, ticlopidine, tranylcypromine, and verapamil were obtained from Sigma-Aldrich (St. Louis, MO). 7-Benzoxyresorufin, β-glucuronidase/arylsulfatase, and collagenase were from Roche (Mannheim, Germany). Ham's F-12 and Leibovitz's L-15 media and newborn calf serum were obtained from Invitrogen (Barcelona, Spain). Plastic culture plates were obtained from NUNC A/S (Roskilde, Denmark). All other reagents used in this study were of analytical grade.
P450-Expressing Cell Lines. Immortalized human liver epithelial (THLE) cells genetically manipulated to express individual CYP1A2, CYP2A6, CYPB6, CYP2D6, CYP2E1, and CYP3A4 genes were kindly supplied by Dr. A. Pfeifer from Nestec Ltd. (Basel, Switzerland). Cell lines expressing CYP2C8, CYP2C9, and CYP2C19 were generated as described elsewhere (Bort et al., 1999). Cells were cultured on fribronectin/collagen-coated flasks in serum-free medium (Pfeifer et al., 1993). For subculturing, cells were harvested after trypsin/EDTA (0.25%/0.02%) treatment at 37° C. For P450 activity assays, cells were seeded in 24-well plates and used 24 h later (at 75% monolayer confluence).
Preparation of Human Hepatocyte Primary Cultures. Human hepatocytes were isolated from small liver biopsies (1–3 g) using a two-step perfusion technique, as described in detail elsewhere (Gómez-Lechón et al., 1990). Surgical liver biopsies were obtained in conformity with the rules of the Hospital's Ethics Committee and after informed consent. Patients had no known liver pathology, were not habitual consumers of alcohol and other drugs, and did not receive any medication during the 2 weeks before surgery. Hepatocytes were seeded on fibronectin-coated 24-well plates at a density of 8 × 10⁴ cells/cm2 and cultured in Ham's F-12/Leibovitz's L-15 (1:1, v/v) medium, supplemented with 2% newborn calf serum, 5 mM glucose, 50 U/ml penicillin, 50 μg/ml streptomycin, 0.2% bovine serum albumin, and 10-8 M insulin. The medium was changed 1 h later to remove unattached hepatocytes.
Fluorimetric Probes for P450 Activities in Intact Cells. Fluorescence-based P450 assays were performed by direct incubation of cells cultured in 24-well plates with selected substrates (Table 1). A volume of 300 μl of incubation medium (1 mM Na2HPO4, 137 mM NaCl, 5 mM KCl, 0.5 mM MgCl2, 2 mM CaCl2, 10 mM glucose, and 10 mM Hepes, pH 7.4, buffered solution) containing the fluorogenic substrate (0.1–300 μM) was added to each well. Substrates were added in acetonitrile solution in concentrations for which the final solvent concentration did not exceed 0.5% (v/v) when added to incubation medium. Experimental conditions are shown in Table 2. After 30 to 150 min at 37° C, assays were stopped by aspiration of incubation medium. Then, potential metabolite conjugates formed during the activity assays were hydrolyzed by incubation of supernatants with β-glucuronidase/arylsulfatase (150 Fishman units/ml and 1200 Roy units/ml, respectively) for 2 h at 37° C (Donato et al., 1993). Finally, samples were diluted (1:2) in the corresponding quenching solution, and fluorescent metabolite formation was quantified fluorimetrically by means of a Spectra Max Gemini XS fluorescence microplate reader (Molecular Devices, Sunnyvale, CA) (see Table 1 for details). Results were expressed as picomoles of metabolite formed per minute and per milligram of total cell protein. After assays, potential effects of substrates on the viability of cultured cells were assessed by the 3-(4,5-dimethylthiazol-2-yl)-2,5-diphenyltetrazolium test as described in detail elsewhere (Borenfreund et al., 1988).
Fluorimetric probes for P450 activity assays
Experimental conditions and kinetic characteristics of fluorescent probe assays in intact P450-expressing cells
Measurement of P450 Activities in Intact Cells using Conventional Selective Substrates. P450 activities were measured by direct incubation of intact cell monolayers (P450-expressing cell lines or primary human hepatocytes) with P450-selective substrates as described (Donato et al., 1993). 7-Benzoxyresorufin was selected for the CYP2B6 activity assay, although this probe is not selective because a possible contribution of CYP3A4 to 7-benzoxyresorufin-O-debenzylation cannot be excluded (Niwa et al., 2003). Substrate concentrations assayed were 1 to 50 μM 7-methoxyresorufin and 7-benzoxyresorufin, 1 to 150 μM coumarin, 3 to 100 μM paclitaxel, 3 to 1000 μM diclofenac, 10 to 400 μM S-mephenytoin, 5 to 500 μM dextromethorphan, 15 to 1000 μM chlorzoxazone, and 5 to 400 μM testosterone. Reactions were stopped by aspirating the incubation medium from plates, and medium samples were then incubated with β-glucuronidase/arylsulfatase for 2 h at 37° C (Donato et al., 1993). Resorufin formed during 7-methoxyresorufin O-demethylation (CYP1A2) and 7-benzoxyresorufin O-debenzylation (CYP2B6) assays, and 7-hydroxycoumarin formed in the coumarin 7-hydroxylation (CYP2A6) assay were quantified fluorimetrically as previously described (Donato et al., 1993, 1998). The formation of products from paclitaxel 6-hydroxylation (CYP2C8), diclofenac 4′-hydroxylation (CYP2C9), mephenytoin 4′-hydroxylation (CYP2C19), dextromethorphan O-demethylation (CYP2D6), chlorzoxazone 6-hydroxylation (CYP2E1), and testosterone 6β-hydroxylation (CYP3A4) were quantified by HPLC analysis as previously described (Bort et al., 1999; Donato et al., 1999). Total cell protein content was determined by the method of Lowry et al. (1951). Results were expressed as picomoles of metabolite formed per minute and per milligram of total cell protein.
Conventional P450 Assays in Human Liver Microsomes. Human liver microsomes were prepared from a pooled set of eight liver samples (four males and four females) as previously described (Donato et al., 1999). P450 activities were assayed by incubating microsomes (100 μg of protein) in 300 μl of 100 mM phosphate buffer, pH 7.4, containing NADPH-regenerating system (5 mM Cl2Mg, 1 mM NADP+, 10 mM glucose 6-phosphate, and 0.3 U/ml glucose-6-phosphate dehydrogenase) and the corresponding selective substrates: 0.3 to 30 μM 7-methoxyresorufin (CYP1A2), 1 to 150 μM coumarin (CYP2A6), 1 to 100 μM 7-benzoxyresorufin (CYP2B6), 0.5 to 50 μM paclitaxel (CYP2C8), 1 to 200 μM diclofenac (CYP2C9), 3 to 300 μM S-mephenytoin (CYP2C19), 0.5 to 150 μM dextromethorphan (CYP2D6), 10 to 750 μM chlorzoxazone (CYP2E1), and 5 to 500 μM testosterone (CYP3A4). After 10 min of incubation at 37° C, assays were stopped by adding 500 μl of methanol (7-methoxyresorufin and 7-benzoxyresorufin assays), 20 μl of 25% trichloroacetic acid (coumarin and dextromethorphan assays), 300 μl of acetonitrile (diclofenac and chlorzoxazone assays), or 500 μl of ethyl acetate (paclitaxel, S-mephenytoin, and testosterone assays). The corresponding reaction products were quantified fluorimetrically or by HPLC analysis as described above for assays in intact cells. Activities were expressed as picomoles of metabolite formed per minute and per milligram of microsomal protein.
P450 Inhibition Assays. Different chemicals, including known potent inhibitors of individual P450 enzymes and compounds with no P450-inhibitory effects, were selected for inhibition assays both in intact cells and in human liver microsomes. P450 activity assays were performed as described above using a concentration of the corresponding fluorimetric or conventional probe near its Km value. Compounds to be tested as P450 inhibitors were added to the incubation assay in dimethyl sulfoxide or acetonitrile, and a similar concentration of the corresponding solvent (<0.5%, v/v) was added to controls. At least six different concentrations of each compound were tested.
Data Analysis. Kinetics constants (Km, Vmax) were calculated by fitting data to the Michaelis-Menten equation using the enzyme kinetics program Pharmacologic Calculation System (Tallarida and Murray, 1987). For inhibitory assays, the typical sigmoid concentration-effect curves were linearized using the LOGIT transformation, and the IC50 values were interpolated mathematically.
Results
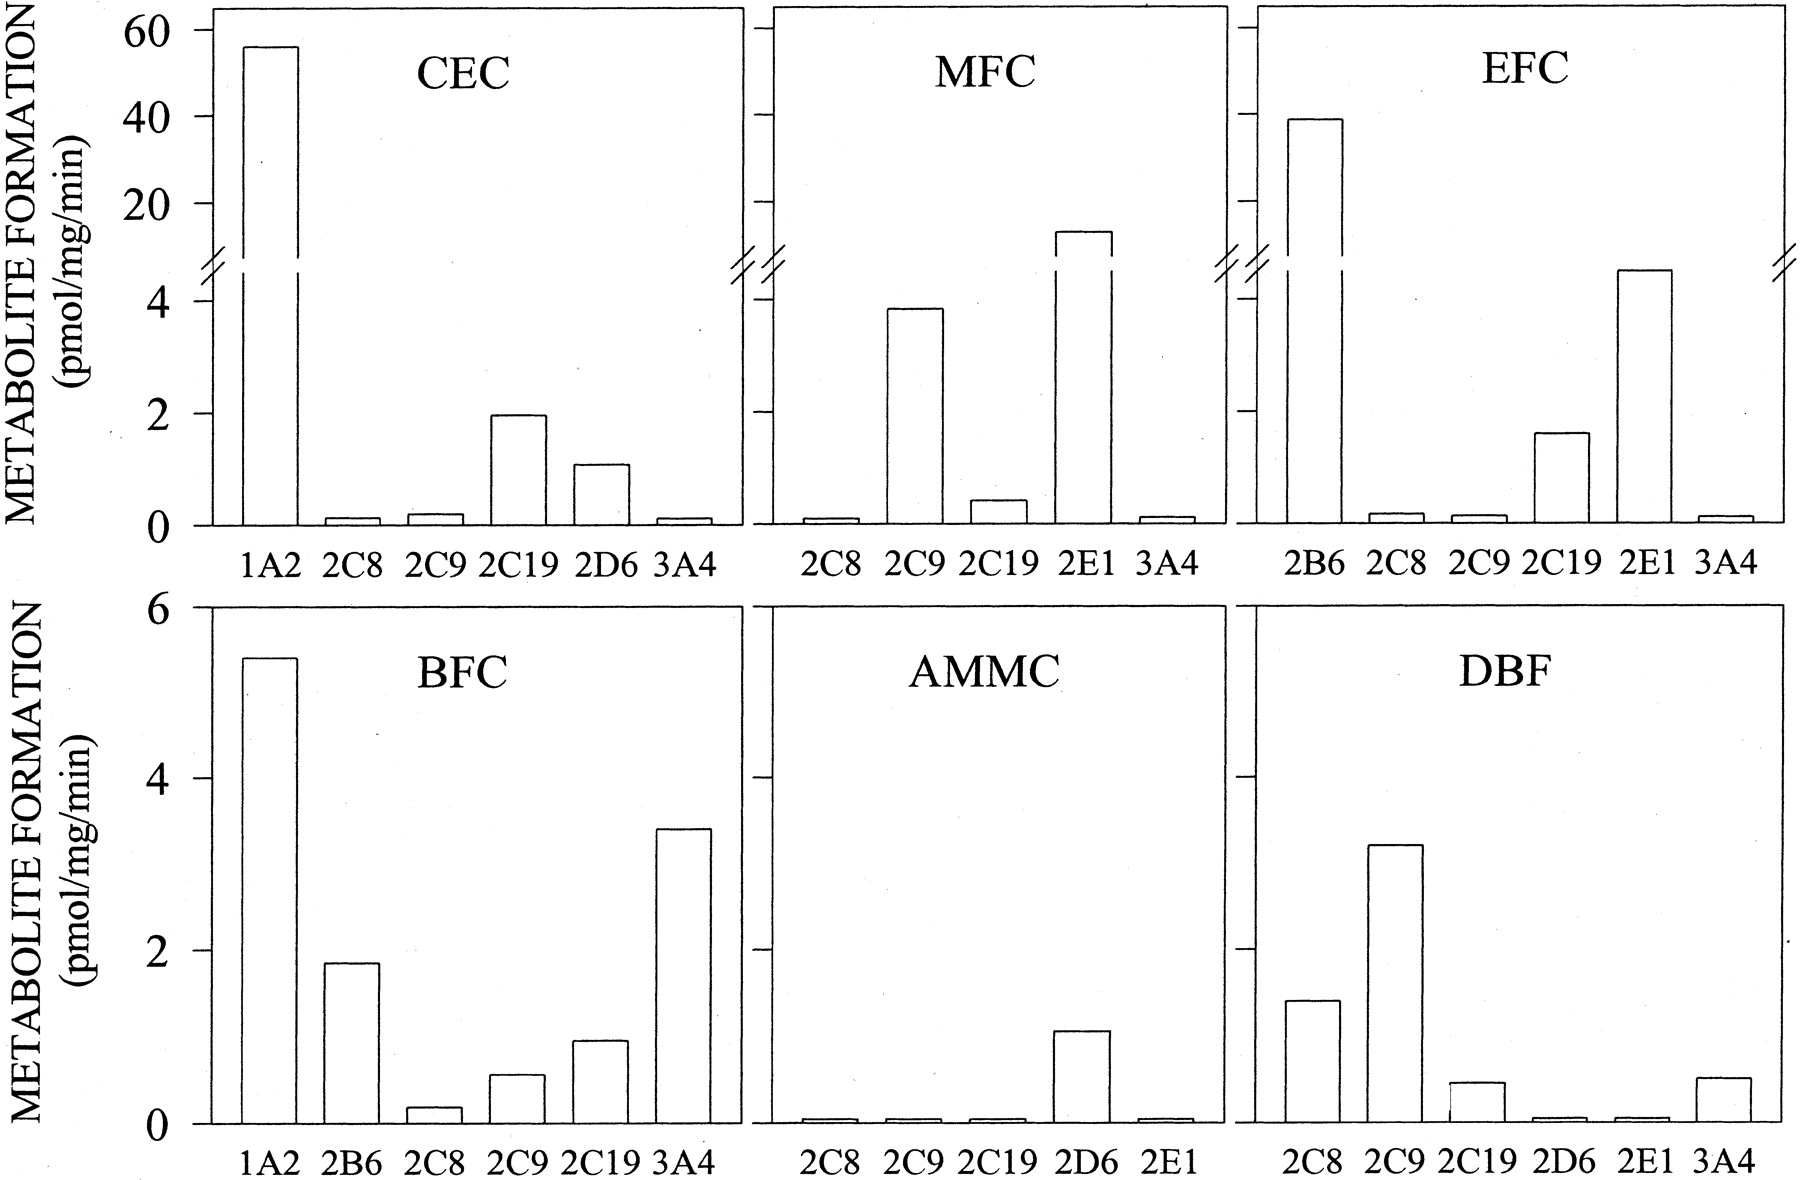
Metabolism of Fluorescent Probes in P450-Expressing Cell Lines. The metabolism of different fluorogenic substrates was examined in cells expressing individual P450 enzymes (Fig. 1). AMMC was highly selective for CYP2D6, whereas the other substrates examined were metabolized by more than one P450 cell line. MFC was more rapidly metabolized by CYP2C9 and CYP2E1 cells than by the other cell lines examined. EFC was highly transformed into HFC by CYP2B6, followed by CYP2C19 and CYP2E1. With respect to BFC, the highest rates of metabolism were observed in CYP1A2 and CYP3A4 cells. DBF showed relatively low metabolism by P450 cells, with CYP2C8 and CYP2C19 cells having the highest activity. Finally CEC was actively metabolized by CYP1A2 and, to a minor extent, by CYP2D6 and CYP2C19.

Metabolism of fluorimetric probes by intact cells expressing individual P450s. Monolayers of THLE cells expressing individual human P450 enzymes were directly incubated with 50 μM CEC, 100 μM MFC, 100 μM EFC, 100 μM BFC, 30 μM DBF, or 100 μM AMMC. Fluorescent metabolites formed and released into incubation medium were quantified as described under Materials and Methods. Results are expressed as picomoles of metabolite formed per minute and per milligram of total cell protein. Data correspond to mean values of two independent experiments.
For each individual P450 activity assay, we selected the fluorescent probe that showed the highest metabolic rates. Based on these observations, CEC, EFC, DBF, AMMC, and BFC were chosen for the measurement of CYP1A2, CYP2B6, CYP2C8, CYP2D6, and CYP3A4 activities, respectively, whereas MFC was selected for both CYP2C9 and CYP2E1 assays. With respect to CYP2C19, similar activity values were found using CEC and EFC as substrates. Finally, CEC was selected because the yield of fluorescence per unit of metabolite formed rendered a higher signal-to-noise ratio than did those found in the EFC assay.
Optimal Conditions for P450 Assays in Intact Cells using Fluorescent Probes. A series of studies was conducted to define optimal assay conditions for P450 activity fluorescence-based methods. The rate of metabolism of each fluorogenic substrate in cultured cells was analyzed over a substrate concentration range of 0.1 to 300 μM (for MFC assay), 0.3 to 100 μM (for EFC, CEC, and DBF assays), or 3 to 100 μM (for AMMC and BFC assays). No toxic effects (assessed by the 3-(4,5-dimethylthiazol-2-yl)-2,5-diphenyltetrazolium test) were observed after incubation of cell monolayers with the substrates (data not shown). Substrate concentrations that ensure the maximal metabolism rate for each activity assay are shown in Table 2. These concentrations were selected for further activity assays in which evaluation of functional capability of P450 cells was required. However, for inhibition assays, substrate concentrations approximating the apparent Km values were chosen (Table 2). As seen in Fig. 2, after incubation of cell monolayers with fluorogenic substrates, the corresponding metabolites were produced and released into culture medium in a time-dependent manner (Fig. 2). For each P450 assay, the incubation time with the substrate was selected to ensure the linearity of metabolite formation. The corresponding values are indicated in Table 2. In all cases, determination of the activity in living cells results in linear reaction rates for at least 60 min. Similar results were observed with intact hepatocytes, but not with microsomes. HFC formation from EFC or BFC was linear during 90 to 120 min when assays were performed in intact P450-expressing cells (Fig. 2) or intact hepatocytes (Fig. 3). In contrast, in human liver microsome assays, the reactions were linear for only 20 min (Fig. 3). Similar kinetics of metabolite formation were obtained for the other assays (data not shown).
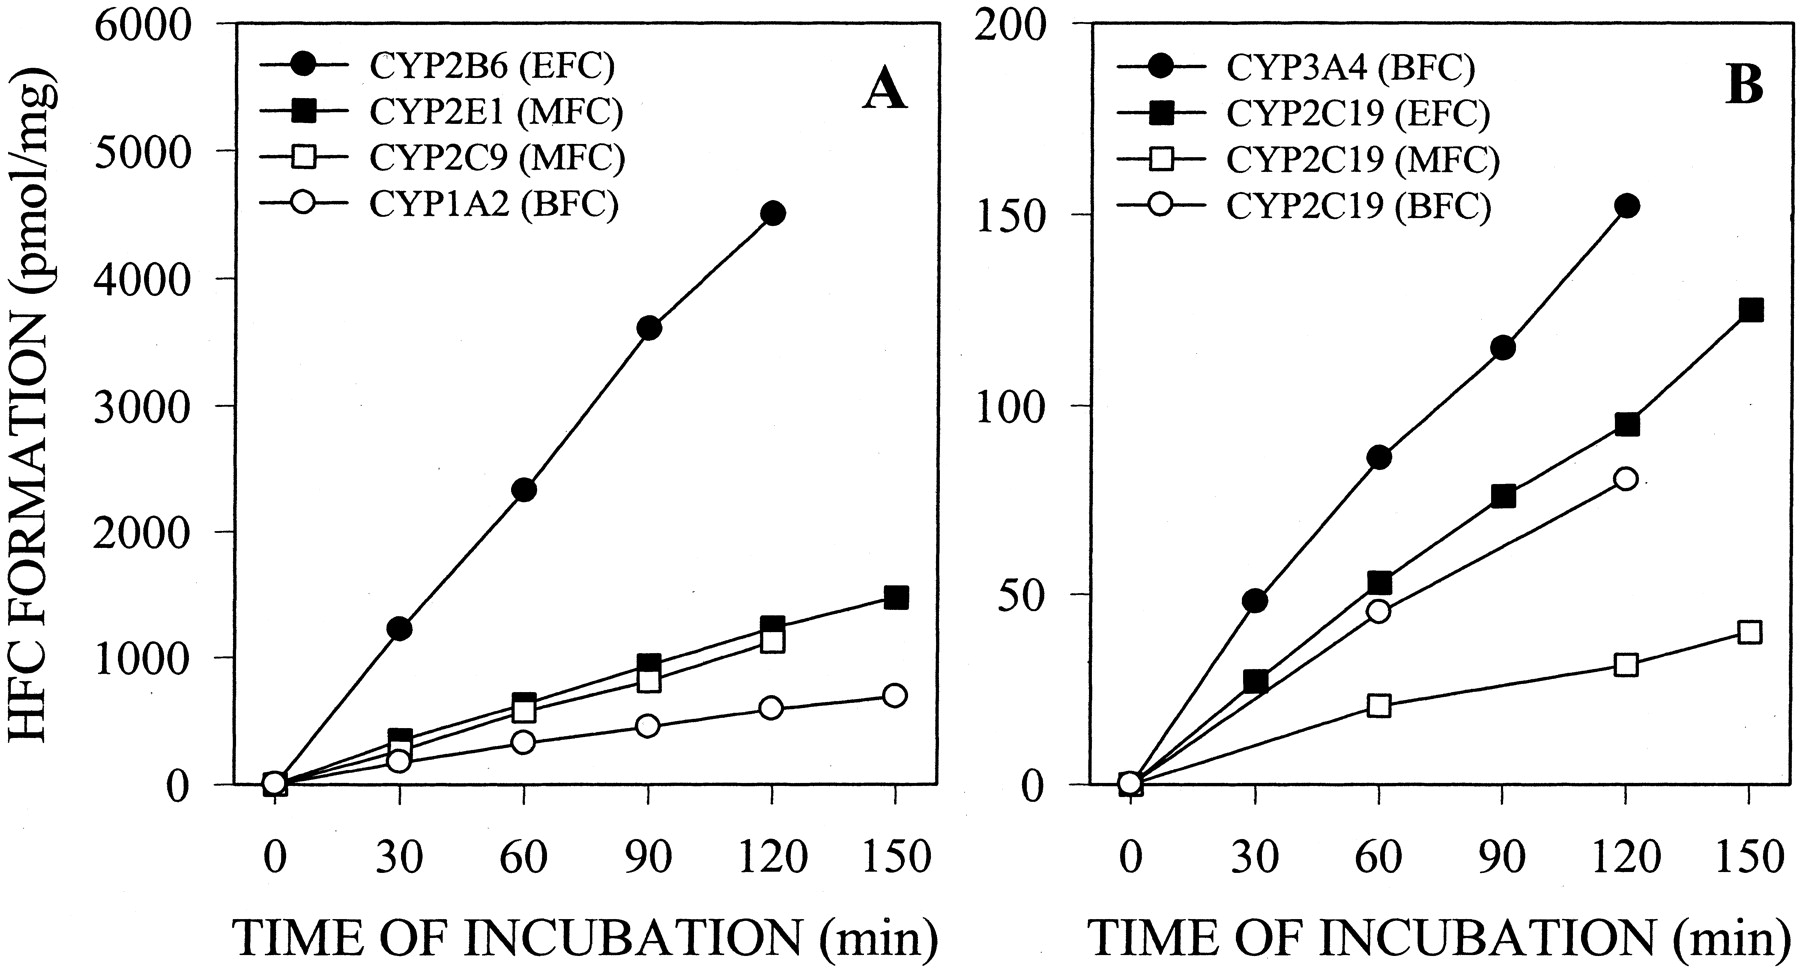
Time course of HFC formation from BFC, MFC, and EFC in intact P450-expressing cells. Monolayers of THLE cells expressing individual human P450 enzymes were directly incubated with 100 μM MFC, EFC, or BFC for 30 to 120 min. HFC formed and released into incubation medium was quantified fluorimetrically as described under Materials and Methods. Results are expressed as picomoles of metabolite formed per minute and per milligram of total cell protein. Data correspond to mean values of two independent experiments.
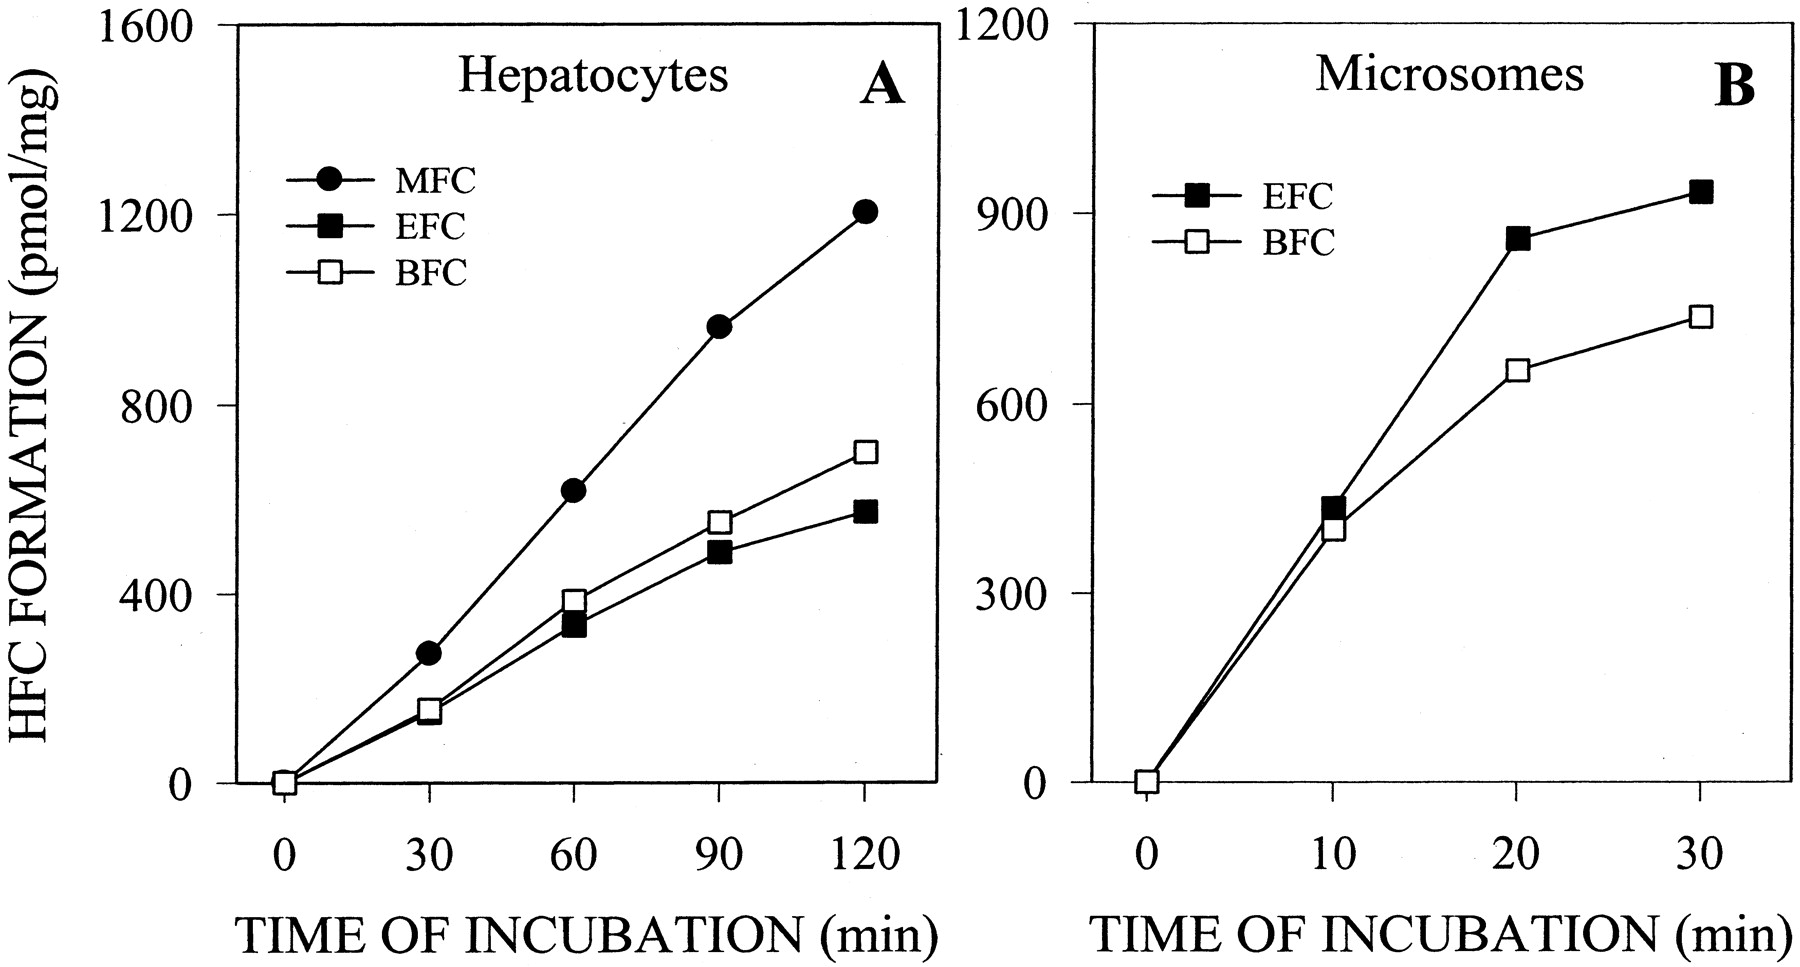
Time course of HFC formation from BFC, MFC, and EFC in intact human hepatocytes and human liver microsomes. A, monolayers of primary human hepatocytes were directly incubated with 100 μM MFC, EFC, or BFC for 30 to 120 min. B, human liver microsomes were incubated with 100 μM EFC or MFC for 10 to 30 min. HFC formed and released into incubation medium was quantified fluorimetrically as described under Materials and Methods. Results are expressed as picomoles of metabolite formed per minute and per milligram of total cell protein (for assays in intact hepatocytes) or per milligram of microsomal protein (for liver microsome incubations). Data correspond to mean values of two independent experiments.
P450 Inhibition Assays in Intact Cells. Fluorimetric-based assays in intact cells can be used for rapid detection of the potential of chemicals to interact with P450 activities. Initially, known potent inhibitors of the respective P450s were used as positive controls. Assays were performed at substrate concentrations proximate to Km values (Table 2), and typical graphs obtained are displayed in Fig. 4. For each enzyme-selective inhibitor, results obtained from fluorescence-based assays were compared with those obtained using conventional probes both in intact cells (P450-expressing cells and human hepatocytes) and in human liver microsomes. In all cases inhibition assays were performed using substrate concentrations near the corresponding Km values (Tables 2 and 3). Results in Table 4 show that when inhibition assays are performed in intact P450-expressing cells, IC50 values obtained using fluorogenic probes are comparable with those obtained with conventional substrates. The only notable difference was found for quercetin effects on CYP2C8 activity, which produced a stronger inhibition on fluorescence-based than on HPLC-based assay.

Effects of model inhibitors on individual P450 activities using fluorescence assays. Intact cells expressing individual P450s were incubated with fluorimetric substrates in the presence of different concentrations of model chemical inhibitors. A, inhibition of CYP2A6 (coumarin 7-hydroxylation assay) by methoxsalen, CYP2B6 (EFC assay) by tranylcypromine, CYP2C19 (EFC assay) by tranylcypromine, and CYP3A4 (BFC assay) by ketoconazole; B, inhibition of CYP2C8 (DBF assay) by quercetin, CYP2C9 (MFC assay) by sulfaphenazole, CYP1A2 (CEC assay) by furafylline, CYP2D6 (AMMC assay) by quinidine, and CYP2E1 (MFC assay) by diethyldithiocarbamate. Results are expressed as percentage of control P450 activity (assayed in the absence of inhibitors). Data correspond to a representative experiment.
Michaelis-Menten kinetics for different selective P450 marker reactions
Comparison of IC50 values for model P450 inhibitors using fluorescent or conventional probes IC50 (μM) data are mean ± S.D. of three independent experiments (intact P450 cell and human liver microsome assays) or the mean of two experiments (intact human hepatocyte assays).
Except for coumarin 7-hydroxylation, the other fluorimetric assays are not selective for an individual P450 enzyme and, therefore, these probes are not useful for assays in models expressing several P450s, such as liver microsomes or primary hepatocytes. The use of conventional P450-selective probes allowed a comparative study of inhibitory effects obtained in different in vitro preparations. The results revealed that, in general, IC50 values calculated from assays in intact P450 cells are similar to those from intact hepatocyte or liver microsomes assays (Table 4).
To validate P450 inhibition assays in intact cells using fluorescent probes, the effects of a series of chemicals on CYP2D6 and CYP3A4 enzymes were tested and the results were compared with those obtained using conventional substrates in human liver microsomes. Inhibition assays were performed using increasing concentrations (ranging from 0.3 to 300 μM) of 17 compounds, and the IC50 values obtained for each assay are shown in Tables 5 and 6. On the basis of IC50 values, the compounds were classified as potent (<3 μM), moderate (from 3 to 30 μM), poor (from 30 to 300 μM), or noninhibitor (>300 μM). A general agreement was observed between results obtained in both CYP3A4 assays. Compounds that were considered as noninhibitors using the fluorogenic substrate (i.e., lovastatin, quinidine, diethyldithiocarbamate, furafylline) showed poor or no effects on CYP3A4 using the microsome assay. Chemicals with the lowest IC50 values in the fluorescence-based assay (i.e., ketoconazole, cyclosporine, and nifedipine) also caused the highest CYP3A4 inhibitions in the conventional assay. For CYP2D6 inhibition, greater differences were observed between both assays (Table 6). In particular, important discrepancies in the inhibitory degree shown by ketoconazole, nifedipine, cyclosporin, omeprazole, and cimetidine were found.
IC50 values obtained for a series of compounds in different CYP3A4 assays
IC50 values obtained for a series of compounds in different CYP2D6 assays
Discussion
The present study describes simple fluorimetric assays for evaluating P450 activities in cells expressing human P450s. The method is based on the direct incubation of intact cells with appropriate fluorogenic substrates that are oxidized by P450s, producing highly fluorescent metabolites. Our aim was to develop sensitive methods for the rapid assessment of the activity of major drug-metabolizing human P450s. Fluorescence-based assays were selected because they are highly sensitive and more suitable for rapid screening than are conventional HPLC-based assays. Unfortunately, only a few fluorogenic probes are selective for individual human P450s, including alkoxyresorufin derivatives for CYP1A/2 and CYP2B6 (Nerurkar et al., 1993), coumarin for CYP2A6 (Yun et al., 1991), AMMC for CYP2D6 (Chauret et al., 2001), and 3-(3,4-difluorobenzyloxy)-5,5-dimethyl-4-(4-methyl-sulfonylphenyl)-5H-furan-2-one (Chauret et al., 1999) and 2,5-bis (trifluoromethyl)-7-benzyloxy-4-trifluoromethylcoumarin (Renwick et al., 2000) for CYP3A4. There are several P450s, including CYP2Cs actively involved in the metabolism of therapeutic agents, for which selective fluorimetric probes have not yet been identified. Obviously, the applicability of nonselective substrates is limited to biological models expressing individual P450s.
For each P450 assay, different substrates were tested and the one showing the highest metabolic rate was selected for further activity monitoring. Because living cells were used, culture supernatants were incubated with β-glucuronidase/arylsulfatase to avoid a possible underestimation of P450 activity as a consequence of metabolite conjugation by phase 2 enzymes (Donato et al., 1993; Price et al., 2000). In contrast to assays in subcellular systems, substrates to be used in intact cell assays should be noncytotoxic and easily transported into cells. Other factors such as low background fluorescence or high signal-to-noise ratio were also considered in the selection of the most appropriate probe. CEC, EFC, MFC, AMMC, and BFC resulted in good markers of CYP1A2, CYP2B6, CYP2C9, CYP2D6, and CYP3A4, respectively (Fig. 1). These results agree with those previously described in studies using microsomes obtained from human liver or cDNA-expressed P450 preparations (Code et al., 1997; Crespi et al., 1997; Ekins et al., 1997; Chauret et al., 2001; Stresser et al., 2002; Cohen et al., 2003). Methoxyresorufin O-deethylation, a selective fluorescent probe for CYP1A2, has been efficiently used for monitoring CYP1A2 activity in intact hepatocytes (Donato et al., 1999). In the case of CYP1A2-expressing cells, a selective probe is not needed, and CEC was chosen as CYP1A2 substrate because it has more favorable properties (higher metabolic rates, lower background fluorescence) than methoxyresorufin. The classical coumarin 7-hydroxylation assay is an excellent selective marker of CYP2A6 activity in microsomes and cells. Therefore, no other substrates were tested for this activity in CYP2A6 cells. Both MFC and CEC have been proposed as substrates for CYP2C19 (Crespi et al., 1997; Stresser et al., 2002). We observed that the metabolic rate of EFC by intact CYP2C19 cells was comparable with that of CEC and markedly higher than that observed for MFC (Fig. 1), suggesting EFC as a potential fluorescent probe for CYP2C19 activity. The capability of CYP2C8 cells to oxidize fluorogenic substrates was, in general, more reduced than that observed for the other P450 cells (Figs. 1 and 2). This poor metabolization cannot be attributed to a reduced expression of the enzyme, since high levels of paclitaxel 6-hydroxylation (selective reaction for CYP2C8) were observed (Table 3). Only DBF was metabolized by CYP2C8 to detectable levels and, to our knowledge, is the only available fluorescent probe for CYP2C8 activity. Several substrates, such as CEC, MFC, or EFC, have been reported to be metabolized by CYP2E1 (Stresser et al., 2002); however, up to now, no fluorescence-based assay has been proposed for this activity. From our results (Fig. 1), we suggest MFC as a suitable probe for CYP2E1 activity.
Previously reported high-throughput P450 assays use fluorescent probes in combination with microsomes from biological systems heterologously expressing human P450s (Crespi et al., 1997; Bapiro et al., 2001; Yamamoto et al., 2002; Cohen et al., 2003). A major limitation in making conclusive statements from these assays is that ultimately, in vivo metabolism is complicated by the role of processes that are lacking in subcellular models, such as drug transport across membranes or further metabolism by cytosolic enzymes (Ito et al., 1998). Assays performed in intact cells, because of the presence of membrane barriers, more closely reflect the in vivo situation and are, in some aspects, more predictive than microsomes (Ito et al., 1998). Since living cells are used, the endoplasmic reticulum of the cells remains intact and transport processes are maintained. Enzyme damage is minimized, because the absence of centrifugation steps for microsome preparation reduces manual handling of biological material, and the addition of exogenous cofactors or NADPH-regenerating systems are not needed.
An important application of P450-expressing cells is the early detection of potential drug-drug interactions. High-throughput fluorescence assays have been described for screening the inhibitory effects of new chemicals in recombinant P450 enzymes (CYP1A2, CYP2C9, CYP2C19, CYP2D6, and CYP3A4) (Crespi et al., 1997; Chauret et al., 1999; Stresser et al., 2000; Bapiro et al., 2001; Cohen et al., 2003). P450 inhibition studies can also be performed in living cells (Li and Jurima-Romet, 1997; Donato et al., 1998; Di Marco et al., 2003). Assays in intact cells more closely reflect the environment to which drugs are exposed in the liver (transport mechanisms, cytosolic enzymes, binding to intracellular proteins), which can be a determinant in the actual concentration of substrate and inhibitor available to the P450 enzyme. Comparison of the effects produced by potent model inhibitors in different in vitro systems revealed that high similarities were found between assays in P450 cells using fluorescent probes and those using conventional probe assays in P450 cells, hepatocytes, or microsomes (Table 3). In addition, there is a good agreement between IC50 data from fluorescence-based assays in intact cells described here and those reported in the literature when the same substrates were assayed in microsomes from recombinant P450 systems (Crespi et al., 1997; Stresser et al., 2000; Chauret et al., 2001; Yamamoto et al., 2002).
To address the reliability of fluorimetric probes for P450 inhibition screening, a miscellaneous group of compounds, including potent inhibitors to noninhibitors, were tested as CYP3A4 and CYP2D6 inhibitors using fluorescence-based assay in intact cells and conventional P450-selective substrates in liver microsomes. The sensitivity of CYP3A4 inhibition assays is highly dependent on the probe (Kenworthy et al., 1999; Stresser et al., 2000; Wang et al., 2000; Noemir et al., 2001). Substrate-dependent effects are not exclusive of fluorescence probes, and important differences are also observed between different conventional substrates. Although screening using several probes is recommended, when a single fluorimetric substrate must be used, BFC appears to be the better choice (Stresser et al., 2000). Therefore, the good agreement found in our study between the two CYP3A4 assays (Table 5) is not surprising. In contrast, certain interassay differences were found for CYP2D6. In a similar study, a difference of 5-fold or less in the IC50 values between different assays was considered acceptable (Palamanda et al., 1998). From the 17 compounds examined, only ketoconazole, nifedipine, and cyclosporin fluorescence and conventional IC50 values differed by more than 5-fold, whereas for omeprazole and cimetidine, the differences were about 3-fold. These five drugs are known to be actively metabolized by flavin-containing monooxygenase and/or P450s other than CYP2D6 (Cashman et al., 1995; Rodriguez and Acosta, 1997; Kenworthy et al., 1999). These oxidative enzymes are present in human liver microsomes but not in CYP2D6-expressing cells, which could explain the differences found in IC50 values.
In summary, the present study describes a series of fluorescence-based assays for P450 enzymes that allow simple, rapid, and reproducible monitoring of P450 activities in individually P450-expressing cells. A major advantage over high-throughput assays in subcellular fractions is that, since living cells are used, more representative information of in vivo metabolism could be obtained. These assays could be applied to screening for potential drug-drug interactions due to P450 inhibition in the preclinical stages of drug development and could provide a rapid identification of the drug candidates showing the most favorable metabolic properties. Since several P450s can be involved in the metabolism of a compound, the use of cells expressing one single P450 may not properly estimate the inhibitory effects of a given drug. Therefore, these assays may be very useful for preliminary screening, but after selecting a few compounds, further studies with conventional probes in models showing a full metabolic competence (i.e., human hepatocytes or liver microsomes) are recommended.
Acknowledgments
We acknowledge the expert technical assistance of Epifanía Belenchón.
Footnotes
-
This work was supported by Fundacion Valenciana para el Fomento de Modelos In Vitro Alternativos a la Experimentacion Animal (ALIVE) and the Fondo de Investigaciones Sanitarias of the Spanish Ministry of Health (03/0339).
-
ABBREVIATIONS: P450, cytochrome P450; AMMC, 3-[2-(N,N-diethyl-N-methylammonium)ethyl]-7-methoxy-4-methylcoumarin; BFC, 7-benzyloxy-4-trifluoromethylcoumarin; CEC, 3-cyano-7-ethoxycoumarin; DBF, dibenzylfluorescein; EFC, 7-ethoxy-4-trifluoromethylcoumarin; HFC, 7-hydroxy-4-trifluoromethylcoumarin; HPLC, high-performance liquid chromatography; THLE, immortalized human liver epithelial; MFC, 7-methoxy-4-trifluoromethylcoumarin.
- Received January 12, 2004.
- Accepted March 10, 2004.
- The American Society for Pharmacology and Experimental Therapeutics


