


Abstract
P-glycoprotein (PGP) encoded by the Mdr1 gene mediates the excretion of drugs in organs such as the liver and kidney. Inflammation has been shown to suppress the expression and activity of PGP in rodent liver, thus potentially altering the pharmacokinetics of drugs that are substrates of PGP. Here we examined the effect of endotoxin (lipopolysaccharide; LPS)-induced inflammation on the disposition of the PGP substrate doxorubicin (DOX) in the mouse. Male CD-1 mice received 5 mg/kg LPS intraperitoneally. DOX (5 mg/kg) was administered intravenously 24 h after LPS treatment. The time course of DOX levels in plasma, urine, bile, and tissues was analyzed by high performance liquid chromatography. PGP protein and mRNA expression in liver and kidney was measured using Western blots and reverse transcriptase polymerase chain reaction. As compared to controls, LPS-treated mice exhibited a significant decrease (50%) in biliary clearance and 3-fold increased renal clearance of DOX. These changes were associated with strongly reduced PGP protein levels (30% controls, p < 0.05) in the liver and increased PGP levels in the kidney (140% controls, p < 0.05). Hepatic mRNA levels of all Mdr isoforms were reduced in LPS-treated mice, whereas renal Mdr1b levels were increased. In LPS-treated mice, we also measured an increased area under the plasma concentration-time curve and reduced systemic clearance of DOX, as well as a 2- to 5-fold increase in the urinary excretion of the doxorubicin and doxorubicinol aglycones. Our data suggest that endotoxin-induced inflammation in mice causes differential regulation of PGP in liver and kidney, thereby altering the clearance profile of DOX.
The cytochromes P450 and drug-transporting membrane proteins play an important role in the disposition and clearance of drugs. The drug transporter P-glycoprotein (PGP) is of particular clinical relevance because of its broad substrate specificity, which includes a variety of commonly used antineoplastic drugs, such as doxorubicin, vincristine, and paclitaxel. PGP is an ATP-dependent efflux pump encoded by the Mdr1 (Abcb1) gene, and is expressed in tissues that mediate the excretion of drugs (liver, kidney) or that limit the entry of drugs into the body (intestine, blood-brain barrier). In mice, PGP exists in two isoforms, Mdr1a and Mdr1b. Experiments in knockout mice have demonstrated that the absence of one or both transporter isoforms greatly enhances the sensitivity to drugs and can lead to drug toxicity not observed in wild-type animals (Borst and Schinkel, 1997).
Despite the physiological significance of PGP, many aspects regarding its cellular and molecular regulation still remain unclear. Whereas PGP is often overexpressed in cancer cells (thus rendering them resistant to cancer chemotherapy), inflammatory disease states such as endotoxemia are associated with suppression of PGP and other hepatic transporters (Piquette-Miller et al., 1998; Trauner et al., 1998). In rat and mouse models of experimentally induced inflammation, our group has previously shown that the expression and functional activity of PGP is reduced during acute inflammation, which is mediated primarily through the action of proinflammatory cytokines (Hartmann et al., 2001).
Moreover, several studies since the 1980s have shown that the pharmacokinetics of many drugs are altered in inflammation (Schneider and Bishop, 1982). Since acute inflammatory responses are chiefly mediated by the liver, this effect is most prominent for drugs that are cleared mainly by the liver, such as the β-adrenoreceptor antagonists (Piquette-Miller and Jamali, 1995). It is generally felt that suppression of the hepatic cytochrome P450 enzymes is a key factor that contributes to decreased hepatic clearance of drugs. However, the significance of changes in the expression of hepatic transporters such as PGP has largely been overlooked. It would be of clinical importance to investigate the impact of inflammation-mediated suppression of hepatic PGP on drug kinetics, in particular, for drugs that are known for their inherent toxicity, such as anticancer agents.
In a mouse model of endotoxin-induced acute inflammation, we sought to delineate the impact of PGP down-regulation on the in vivo disposition and clearance of the PGP substrate doxorubicin (DOX). DOX is an antitumor agent widely utilized for the treatment of various neoplastic diseases. DOX is taken up into cells via passive processes and is extensively distributed to liver, spleen, kidney, heart, and small intestine after intravenous administration (Broggini et al., 1980). DOX is mainly cleared by biliary secretion, which occurs via PGP (Van Asperen et al., 2000). Direct intestinal secretion also appears to be an important route of DOX clearance (Van Asperen et al., 2000). Generally, in mice, less than 10% of the administered dose is metabolized through non-P450 enzyme systems, the aldoketoreductase (carbonyl-reductase) and the microsomal reductive glycosidase (Loveless et al., 1978). Three metabolites have been identified in the mouse: doxorubicinol, 7-deoxy-doxorubicinolone, and 7-deoxy-doxorubicinone, also termed metabolites M1, M2, and M3, respectively (Van Asperen et al., 1999).
In this report we show that endotoxin treatment causes murine PGP to be differentially regulated in liver and kidney, which is associated with alterations in the biliary and renal elimination of DOX and its metabolites. Our observations support the existence of tissue-specific mechanisms; thus, a defect of hepatic PGP function may possibly be counterbalanced by induction in other eliminating organs, such as the kidney. These findings have important implications for the in vivo regulation of drug transporters in inflammatory disease and add to understanding the physiological response underlying the pharmacokinetic changes during acute phase conditions.
Materials and Methods
Animals and Treatment. Animal studies were conducted in accordance with the guidelines of the Canadian Council on Animal Care. Eight-week-old male CD-1 mice (25-35 g) were supplied by Charles River Canada (Montreal, PQ, Canada). The animals were injected with 5 mg/kg i.p. LPS (from Escherichia coli serotype 055:B5; Sigma-Aldrich, St. Louis, MO). Control mice received the equivalent volume of saline buffer. Pharmacokinetic studies and analysis of hepatic PGP protein were performed 24 h after the treatment.
Analysis of PGP Protein Expression. Four mice from each treatment group were sacrificed. Livers and kidneys were excised, snap-frozen in liquid nitrogen, and stored at -80°C. Western blot analysis with the C-219 antibody was performed on protein samples prepared by homogenization of livers (1.0-1.5 g) or kidneys (0.45-0.8 g) based on previously published methods (Hartmann et al., 2001). The levels of PGP protein expression are reported as percentages of average control values (n = 4).
Reverse Transcription-Polymerase Chain Reaction (RT-PCR) Analysis of Mdr mRNA Expression. Total RNA was extracted from livers and from kidneys using the Amersham QuickPrep RNA extraction kit (Amersham Biosciences Inc., Piscataway, NJ) following the manufacturer's instructions. Semiquantitative RT-PCR analysis was performed as previously described (Hartmann et al., 2001). The optical densities (ODs) of PCR products were normalized to 18 S ribosomal RNA (rRNA) band intensities. Levels of mRNA expression are reported as percentages of normalized values, as compared with control values. Normalized values were calculated as ratios of (OD Mdr mRNA)/(OD 18 S rRNA). Results obtained from RT-PCR were later confirmed by real-time quantitative PCR.
In Vivo Pharmacokinetic Study of Doxorubicin. DOX-HCl (MP Biomedicals, Irvine, CA) was dissolved in saline to give a 1 mg/ml solution and administered to mice i.v. into a lateral tail vein at a dose of 5 mg/kg. At various times after injection (15 min, 30 min, 1 h, 2 h, 4 h, 8 h, 12 h, 24 h), three to five mice from each group were sacrificed. Blood samples were drawn from the inferior vena cava and collected in heparinized syringes. Tissue samples from liver, kidneys, intestines (including intestinal contents), brain, and heart were collected. Blood samples were centrifuged for 10 min at 3000g and 4°C to obtain plasma. For excretion experiments, mice were housed in Nalgene metabolic cages (Nalge Nunc International, Naperville, IL) immediately after DOX administration. Urine and feces were collected in 6-h time intervals up to 24 h, starting at 6:00 PM. All plasma and tissue samples were frozen at -70°C until analysis. Feces, urine, and bile samples were stored at -20°C.
For measurement of DOX biliary excretion, mice were anesthetized with 60 mg/kg i.p. sodium pentobarbital. After opening the abdominal cavity, the lower part of the common bile duct (adjacent to the pancreas) was ligated, and a micro-cannula (BioTime Inc., Berkeley, CA) was inserted into the upper part of the bile duct approximately 3 mm below the branching site and fixed with 5-0 silk suture. DOX-HCl at a dose of 5 mg/kg was injected into a tail vein. Bile was collected in preweighed 1.5-ml Eppendorf tubes in 20-min time intervals for up to 80 min. During bile collection, the animals were maintained at 37°C using a heat lamp, and the exposed abdominal tissues were moistened with saline to prevent dehydration. If required, additional anesthetic (up to 30 μl) was instilled directly into the abdominal cavity. Bile volumes were determined by weighing the tubes after bile collection and assuming a specific gravity of 1 g/ml bile.
Doxorubicin HPLC Assay. The extraction of DOX and metabolites from plasma, urine, feces, bile, and tissue samples was performed according to the method of Van Asperen et al. (1998). Similarly, DOX concentrations in the samples were measured based on the HPLC method of Van Asperen et al. (1998), with minor modifications. Briefly, the HPLC system consisted of a Waters 600E system controller and pump (Waters, Milford, MA), a Waters 715 Ultra-WISP autosampler, and a PerkinElmer 500 fluorescence detector (PerkinElmer Life and Analytical Sciences, Boston, MA). Doxorubicin and the metabolites M1 (doxorubicinol), M2 (7-deoxy-doxorubicinone), and M3 (7-deoxy-doxorubicinolone) were separated on a Beckman Coulter Ultrasphere ODS 5-μm (C18) column, 150 × 4.6 mm (Beckman Coulter, Fullerton, CA), preceded by a Waters μ-Bondapak C18 guard column. A gradient elution was performed by mixing acetonitrile and water (pH 2.05) at a constant flow rate of 1.1 ml/min and establishing a stepwise gradient of 25 to 40% acetonitrile from 0 to 25 min, followed by re-equilibration with 25% acetonitrile. Fluorescence detection was achieved at an excitation wavelength of 460 nm and an emission wavelength of 550 nm. Peaks were recorded and integrated using a Waters SAT/IN2 data module and Waters Empower software. Calibration curves were obtained by least-squares linear regression analysis of the concentration versus the ratio of peak area of doxorubicin, M1, M2, or M3 and the internal standard (daunorubicin, concentration 500 ng/ml). The intraday and interday coefficients of variation were determined to be 7.2% and 10.5% (range 0.01-5 μg/ml). The lower limit of quantitation was 2 ng/ml, using 200 μl of mouse plasma. The typical retention times recorded for DOX, M1, M2, M3, and internal standard were 6.3, 3.7, 18.4, 14.4, and 15.1 min, respectively.
The identity of the metabolites M1, M2, and M3 was determined by mass spectrometry (performed by ANALEST Laboratories, University of Toronto, Toronto, ON, Canada) and confirmed based on previously published mass spectra (Takanashi and Bachur, 1976). Because internal standards for the doxorubicin metabolites were not available, the levels of metabolites were calculated as DOX equivalents of ng/ml (plasma, urine), or μg/g (tissue, bile). M1 was detected in urine but was not detectable in plasma. With the exception of heart, reliable data could not be obtained for M1 from homogenized tissues, due to interference with several endogenous peaks at early retention times.
Plasma Binding Determination. The plasma unbound fraction (fu,plasma) of DOX in normal and endotoxemic mice was measured based on the ultrafiltration method reported by Mayer and St-Onge (1995) with modifications. Briefly, mouse plasma samples were spiked with DOX (10 μg/ml) and incubated at 37°C for 30 min. Samples (200 μl) were then loaded onto Microcon-30 devices and centrifuged at 8000g, 37°C for 10 min. Approximately 50% of the volume was recovered in the ultrafiltrate containing the DOX unbound fraction. The Microcon-30 membranes were also rinsed and spun with 100 μl of HCl (pH 2) to further elute membrane-bound DOX. Protein denaturation and precipitation were achieved by the addition of 70% perchloric acid (10 μl). Protein pellets were further extracted with 100 μl of HCl (pH 2) to detect any DOX precipitation. More than 75% of DOX was recoverable using this method. The concentrations of DOX in the ultrafiltrate, retentate, protein pellet, and Microcon-30 membrane wash were determined by HPLC.
Pharmacokinetic Analysis. Concentration-time curves, C(t) were obtained by plotting the average data points from three to five animals. An inverse squared weighting scheme (MicroMath Scientist software; MicroMath Inc., Salt Lake City, UT) was utilized to fit the plasma concentration mean data based on the two-compartment model equation:  Initial estimates for A, B, α, and β were obtained by residual analysis. Initial and terminal half-lives were calculated as t1/2(α) = 0.693/α and t1/2(β) = 0.693/β.
The area under the plasma concentration-time curve (AUC; equivalent to AUC0-∞) and the total body clearance (CLt) were calculated as follows: 
 The steady-state volume of distribution, Vss, was determined based on the standard methods for two-compartment analysis (Gibaldi and Perrier, 1982).
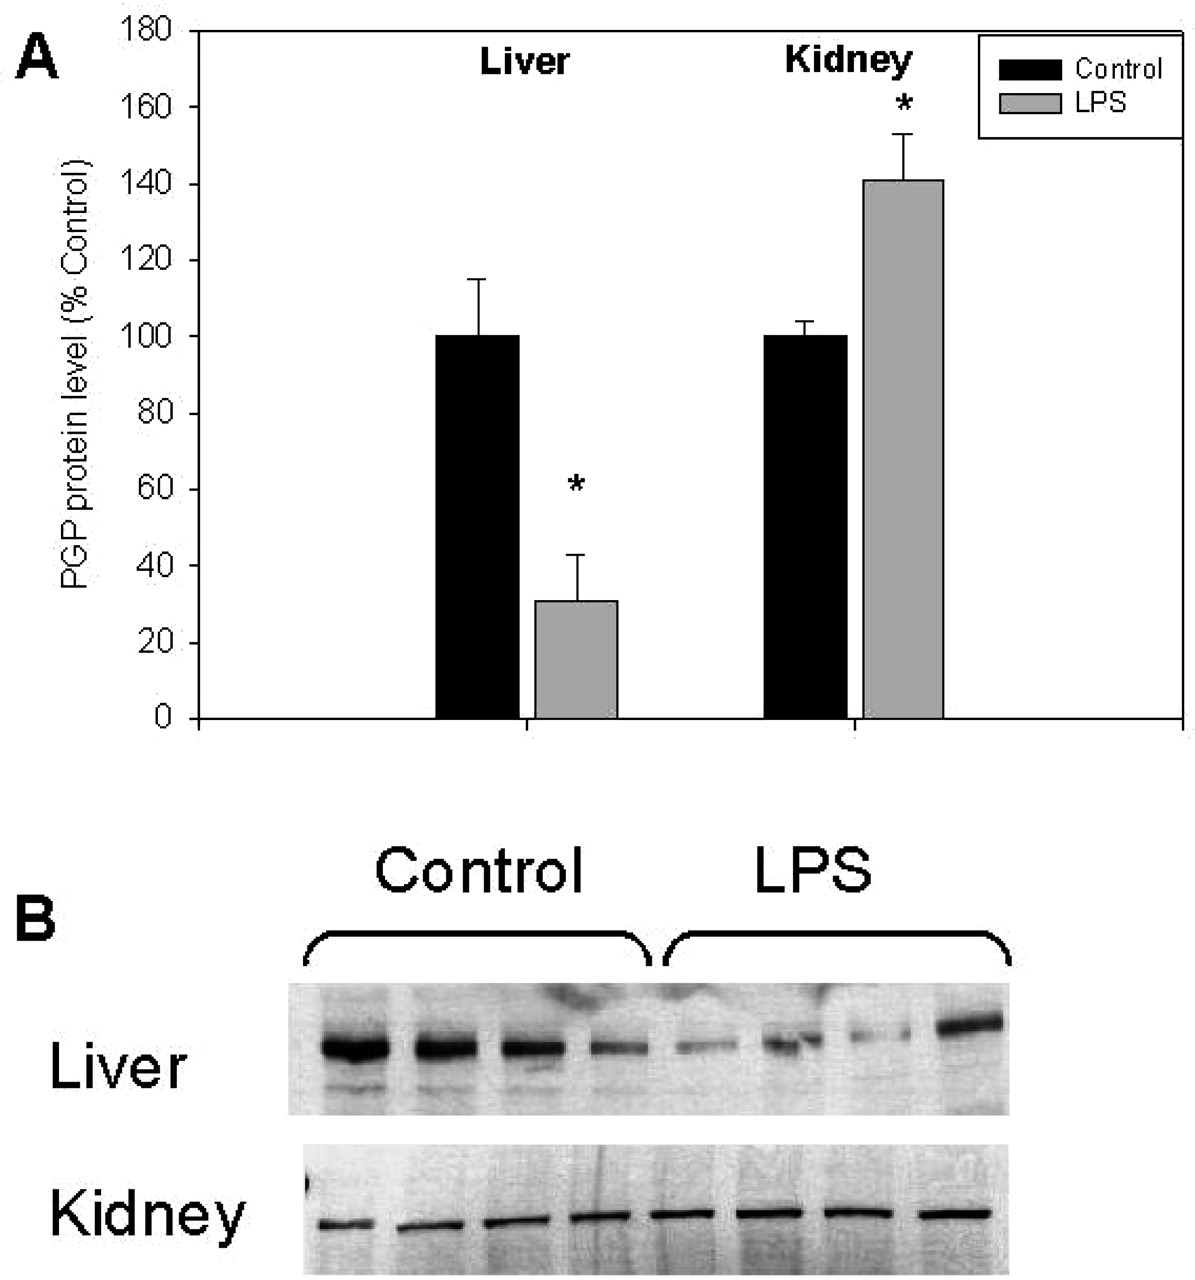
Effect of LPS-induced inflammation on the expression of hepatic and renal P-glycoprotein. Mice (n = 4) were injected with saline buffer (Control) or 5 mg/kg i.p. LPS. Livers and kidneys were collected after 24 h. Immunodetectable levels of PGP were measured using C-219 antibody as described under Materials and Methods. Bars represent percentage mean values ± S.E.M. of optical densities as compared with controls (⋆, p < 0.05).
In addition, the method by Bailer (1988) was applied to statistically compare areas under the concentration-time curves from time 0 to the last (24-h) sampling time point (AUC0-24). First, the mean AUC0-24 was calculated using the linear trapezoidal method:  The variance and standard error of the AUC (s2AUC, S.E.AUC) were then calculated based on:
 The index variable i denotes the time point, i = 1, 2,.. .m (tm = 24 h). The term s2Ci denotes the variance of the plasma concentrations of ni animals at time ti.
The mean biliary and renal clearances (CLb, CLr) were calculated as:  Xbile(0-1 h) and Xu(0-24 h) denote the amounts of DOX excreted in bile and urine, respectively, for the indicated time intervals following administration of the drug. Since the metabolite levels in plasma were below the detection limit at time points beyond 12 h, the AUC0-12 was determined from the respective metabolite plasma profiles, and the renal clearances of the metabolites were calculated as:
Statistical Analysis. Statistical analysis was performed using Student's t test (Microsoft Excel). Values of p < 0.05 were considered significant.
For the statistical analysis of AUC values, the Z test (Bailer, 1988) at a significance level of α = 0.05 was applied to compare mean AUC values between treatment groups, according to the test statistic:  An observed absolute Z value greater than the critical value of +1.96 was considered significant.
Results
Hepatic and Renal P-glycoprotein Expression in Endotoxemia. Induction of inflammation via administration of LPS resulted in a significant decrease of C-219 immunodetectable levels of PGP in the mouse livers 24 h after treatment. Measured PGP protein levels in the liver of LPS-treated mice were 31 ± 13% of that seen in control mice. In contrast, PGP protein levels in the kidneys of LPS-treated mice were found to be increased to 141 ± 12% of control levels (p < 0.05; Fig. 1).
In the liver, LPS treatment resulted in significant (p < 0.05) down-regulation of Mdr1a, Mdr1b, Mdr2, and Bsep mRNA levels (Fig. 2A). In the kidneys of LPS-treated mice, levels of Mdr1a mRNA were unaltered, whereas levels of Mdr1b mRNA were increased by 2-fold as compared with controls (p = 0.06; Fig. 2B).

Effect of LPS-induced inflammation on the expression of hepatic (A) and renal (B) Mdr1 mRNA. Mice (n = 4) were injected with saline buffer (Control) or 5 mg/kg i.p. LPS. Livers and kidneys were collected after 6 h, and levels of Mdr1a, Mdr1b, Mdr2, and Bsep mRNA were measured by RT-PCR as described under Materials and Methods. Bars represent percentage mean values ± S.E.M. of 18 S-normalized optical densities as compared with controls (⋆, p < 0.05).
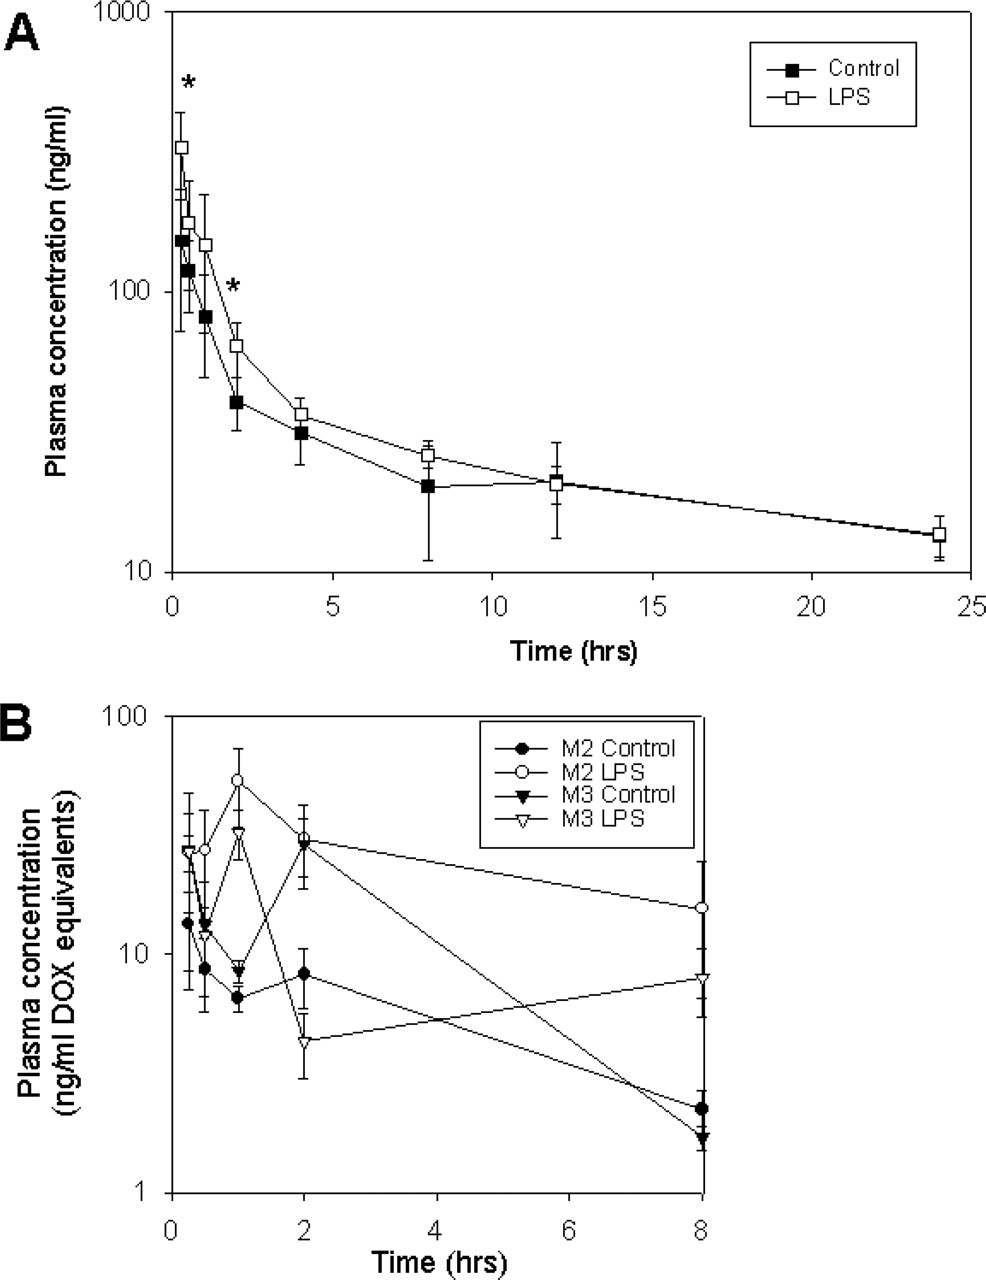
Plasma Pharmacokinetics. At time points up to 12 h, slightly higher plasma concentrations of DOX were found in LPS-treated mice, as compared with controls. The difference was most obvious during the early time period of 15 min to 2 h. At later time points (12 and 24 h), the plasma curves of control and LPS groups coincided (Fig. 3). Table 1 lists the pharmacokinetic parameters calculated in both groups of mice. The AUC from time 0 to 24 h was found to be significantly (p < 0.05) higher in LPS-treated mice, although the relative increase in AUC was moderate (1.25-fold). The total clearance of DOX in LPS-treated animals was only slightly reduced, by 8%, and the steady-state volume of distribution was ∼78% of control values. The terminal half-life of DOX was similar in both groups (∼18 h). In control animals, 35% of the drug was unbound in plasma, which is consistent with previous studies (Terasaki et al., 1984). A significant 60% decrease in DOX plasma protein binding was seen in plasma from LPS-treated mice (p < 0.001).
Pharmacokinetic parameters of doxorubicin in plasma of control versus LPS-treated mice following a 5 mg/kg i.v. dose (mean ± S.E.)
Low plasma concentrations of the metabolites M2 (7-deoxy-doxorubicinone) and M3 (7-deoxy-doxorubicinolone) were detected up to 12 h after the administration of DOX (Fig. 3B). Whereas the AUC0-12 for the metabolite M2 was 5-fold higher in LPS-treated mice (p < 0.05), the AUC0-12 for M3 was somewhat lower (Table 2). M1 (doxorubicinol) could not be detected in plasma at the time points examined.
Pharmacokinetic parameters of doxorubicin metabolites in plasma of control versus LPS-treated mice following administration of doxorubicin at a 5 mg/kg i.v. dose (mean ± S.E.)
Tissue Disposition. Overall, the tissue disposition of DOX was similar in control and LPS-treated mice. The highest accumulation of drug was seen in liver and kidney (tissue/plasma ratios reached values up to ∼500 for liver and kidney). In both groups, accumulation of DOX in the brain was only minor (with brain/plasma ratios of 2.3-2.6 at 8 h). For all tissues, maximal accumulation of DOX occurred at 8 h (Table 3).
Time course of doxorubicin tissue levels in control versus LPS-treated mice following a 5 mg/kg i.v. dose, expressed as tissue-to-plasma ratios in ml/g (mean ± S.E.M., n = 5)
The time course of tissue levels of DOX metabolites is summarized in Table 4. DOX metabolites were measurable in all tissues except for brain, where metabolite levels were below the limit of detection. In both control and LPS groups, the highest metabolite levels in the liver were detected 1 h after administration of DOX, whereas in kidney and intestine, the metabolites reached their maximum levels at 8 h. Normal and LPS-treated mice exhibited comparable hepatic levels of the metabolites M2 and M3 at 1 h and 8 h. By comparison, kidney levels of both M2 and M3 at most time points tended to be higher in LPS-treated mice. Intestinal levels of M2 and M3 in LPS-treated mice were also found to be 2- to 3-fold increased (p < 0.05) as compared with controls. Although levels of M1 (doxorubicinol) were only detectable in the heart, we did not observe differences in M1 accumulation between LPS and control mice (Table 4).
Time course of doxorubicin metabolite tissue levels in control versus LPS-treated mice following administration of doxorubicin at a 5 mg/kg i.v. dose Values represent mean ± S.E.M. (n = 5) of absolute amounts in ng DOX equivalents per g of tissue.
Biliary and Urinary Excretion. LPS treatment did not significantly alter the bile flow (inset of Fig. 4A). Bile flow in both groups occurred at an initial average rate of ∼1.2 mg/min, decreased to 0.6 mg/min, and then was stable up to 80 min, at which time we concluded the experiment. Chromatographic analysis of bile samples revealed the presence of DOX and metabolite M3, wherein DOX accounted for about 99% of recovered drug. In LPS-treated mice, we found that the cumulative amount of DOX excreted in bile over an 80-min time period was significantly reduced by ∼40% as compared with controls (Fig. 4A). The biliary clearance of DOX was significantly reduced in LPS-treated mice. Based on plasma values, we calculated a biliary clearance of 8.4 ± 0.98 ml/h in control mice and 2.9 ± 0.48 ml/h in LPS-treated mice (p < 0.05). Similarly, for the metabolite M3, we observed a reduction in biliary output by 50% following LPS treatment (Fig. 5B), and the biliary clearances for M3 were 2.3 ± 0.55 ml/h in control mice and 0.76 ± 0.14 ml/h in LPS-treated mice (p < 0.05).

Time course of the plasma concentrations of doxorubicin (A) and metabolites (B) in LPS and control mice. Mice (n = 3-5 per time point) were pretreated with saline (Control, closed symbols) or 5 mg/kg i.p. endotoxin (LPS, open symbols), and received 5 mg/kg i.v. DOX 24 h after treatment. Data points represent mean ± S.E. (⋆, p < 0.05).
Over a 24-h time period, 1.7% of the administered dose was recovered in the urine of control animals as DOX and metabolites, with the parent drug accounting for more than 90% of the recovered drug. The metabolites M1, M2, and M3 were also detected in urine, wherein M1 was predominant. As compared with controls, the amounts of unchanged DOX excreted in urine over the same time period was significantly increased, by 3-fold (Fig. 4B), and calculated renal clearances were 2.5-fold higher (p < 0.05) in LPS-treated animals (Table 1). Moreover, whereas the urinary excretion of M1 was unaltered upon LPS treatment, the amounts of M2 and M3 recovered in urine were increased by 5-fold and 2-fold, respectively (p < 0.05 and p = 0.07; Fig. 5A). Whereas the renal clearance for M3 showed a slight trend of increase in LPS-treated versus control mice, no significant difference in the renal clearance for M2 was found between the two groups (Table 2). Total urine volume excreted over 24 h was the same for LPS-treated and control mice.
Discussion
Our results demonstrate that endotoxin-induced inflammation can cause changes in the pharmacokinetics of the PGP substrate doxorubicin. These changes might partly be linked to altered PGP expression in liver and kidney. Differential regulatory mechanisms likely exist in these organs, resulting in suppression of hepatic PGP and up-regulation of renal PGP. In other disease models, such as obstructive cholestasis in the rat, a similar adaptive regulation has been reported for the multidrug resistance-associated protein, Mrp2 (Lee et al., 2001). This tissue-specific response is thought to facilitate the removal of potentially toxic substances in disease states where the excretory capacity of the liver is diminished, but currently, little is known regarding the molecular mechanisms. In the case of Mrp2, transcription factors such as the retinoid receptors retinoid X receptor and retinoic acid receptor have been shown to play a role (Denson et al., 2002). More recent evidence also points toward the pregnane X receptor and the constitutive androstane receptor, which are coregulators of the Mdr1a and Mdr1b genes. Pregnane X receptor and constitutive androstane receptor exhibit differential expression profiles in tissues (Maglich et al., 2002) and undergo down-regulation during acute inflammation (Pascussi et al., 2000; Teng and Piquette Miller, 2005).
In our pharmacokinetic studies, we found that LPS-induced inflammation caused an increase in the plasma AUC but only slight changes in the systemic clearance of DOX. Suppression of hepatic PGP would expectedly affect the systemic clearance of PGP substrates that undergo biliary elimination. However, our data show that the impact of LPS on the systemic clearance of DOX is relatively moderate. This finding is not entirely surprising since multiple elimination pathways for DOX exist in vivo, and impairment of one pathway can be compensated by increased clearance through alternate routes. Reportedly, direct intestinal secretion, which is not mediated by PGP, plays an important role in DOX clearance (Van Asperen et al., 2000). Our data demonstrate significantly greater amounts of DOX metabolites in the intestine of LPS-treated mice, suggesting an increased intestinal clearance. DOX has a low hepatic extraction ratio of 0.2 (Ballet et al., 1987); thus, changes in protein binding and intrinsic metabolic clearance could alter hepatic metabolism. Indeed, as plasma protein binding of DOX was decreased in LPS-treated mice, more free drug was accessible for hepatic metabolism. Thus, increased hepatic metabolic clearance could compensate for decreased biliary clearance, resulting in little change to total body clearance of DOX.
In our biliary excretion studies, we observed significant 50 to 65% decreases in both the biliary clearance of DOX and the total amount excreted in bile. This is consistent with reports on the kinetics of DOX in rats with Shiga-like toxin-induced inflammation (Hidemura et al., 2003) and chronic inflammation, such as adjuvant arthritis (Achira et al., 2002). The corresponding down-regulation in hepatic PGP expression clearly indicates that the decrease in functional PGP contributes to reduced biliary excretion of DOX. Since the C-219 antibody detects all Mdr isoforms (Mdr1a, Mdr1b, Mdr2) as well as Bsep, this raises the question whether the inflammation-mediated suppression affects specifically the drug-transporting PGP isoforms Mdr1a and Mdr1b. However, we demonstrated through mRNA analysis that Mdr1a and Mdr1b expression is markedly suppressed, whereas Mdr2 expression is reduced to a lesser extent.
In Mdr1a-deficient mice, an 80% decrease in DOX biliary output has been reported (Van Asperen et al., 2000), implying that Mdr1a is primarily responsible for the biliary excretion of DOX. Interestingly, the cumulative amount of DOX excreted in bile during a 90-min interval, as reported by Van Asperen et al. (2000) (13% of dose), greatly exceeds our value (1.2% of dose). This discrepancy is likely due to differences in the technique of bile collection (gall bladder cannulation versus bile duct cannulation). The average bile flow rate in our mice was 0.6 mg/min, 5 times lower than the literature value of 3 mg/min (Bischoff et al., 1971), which suggests incomplete bile collection. This likely resulted in underestimation of DOX biliary excretion. When extrapolated to the expected bile flow rate, our biliary clearances were 52.3 ml/h (control) and 14.9 ml/h (LPS). Reportedly, M1 (doxorubicinol) is effluxed into bile by PGP/Mdr1a, and a knockout of Mdr1a severely affects the biliary excretion of this metabolite (Van Asperen et al., 2000). Surprisingly, in our bile samples, we detected M3 instead of M1, and the biliary excretion of M3 in endotoxin-induced inflammation was decreased to the same extent as that of DOX. This might imply either that M3 (but not M1) was extruded into the canalicular lumen by PGP or that M1 underwent conversion to M3 immediately following entry into bile.

Effect of LPS-induced inflammation on the cumulative excretion of doxorubicin into bile (A) and urine (B). Mice (n = 5) were pretreated with saline (Control) or 5 mg/kg i.p. LPS, and received 5 mg/kg i.v. DOX 24 h after treatment. Bile flow (inset), biliary excretion, and urinary excretion of DOX were measured as described under Materials and Methods. Data points represent mean ± S.E.M. Absence of error bars indicates that the S.E.M. is smaller than the size of the symbols (⋆, p < 0.05).
In our animal model of acute inflammation, we observed a 2.5-fold increase in renal clearance of DOX. The observed induction of PGP protein and mdr1b mRNA in the kidneys of LPS-treated mice likely exerts a prominent contribution to this finding. Our results are consistent with reports from Mdr1a/1b knockout mice indicating that functional impairment of hepatic PGP causes the excretion of PGP substrates to be shifted from the biliary to the renal route (Schinkel et al., 1997; Smit et al., 1998). Moreover, the decreased plasma protein binding of DOX in LPS-treated animals is likely to also contribute to increased urinary excretion. In addition, we cannot preclude the possibility that alternative mechanisms or carriers exist in the kidney, which may also be affected by LPS treatment.
Interestingly, the increased unbound fraction of DOX in the plasma of LPS-treated mice was associated with decreased rather than increased steady-state distribution volume of DOX. Generally, although the initial distribution of DOX is rapid, extensive tissue accumulation occurs due to cell nuclei binding (Booth et al., 1998). Moreover, DOX distributes into erythrocytes with a typical blood/plasma concentration ratio of 2.4 (Terasaki et al., 1984). It is thus likely that the extent of tissue binding or partitioning into erythrocytes is altered in LPS-treated mice. Indeed, DOX tissue levels were higher at 8 h than at 1 h after dosing, suggesting substantial tissue binding. Decreased PGP functional activity would be expected to result in drug accumulation in tissues that normally express PGP. For instance, Van Asperen et al. (1999) reported that Mdr1a-deficient mice exhibit 2- to 8-fold higher levels of DOX in liver, brain, and small intestine. However, we did not detect significant differences in DOX accumulation in the LPS-treated animals. Since numerous factors contribute to the distribution of DOX, including blood flow, tissue binding, and extrahepatic metabolism, changes in any one or all of these factors by LPS treatment could obscure the impact on PGP-mediated transport.

Effect of LPS-induced inflammation on the cumulative excretion of DOX metabolites into urine (A) and bile (B). Mice (n = 5) were pretreated with saline (Control) or 5 mg/kg i.p. LPS, and received 5 mg/kg i.v. DOX 24 h after treatment. Biliary and urinary excretion of metabolites was measured as described under Materials and Methods. Bars represent mean ± S.E.M. (⋆, p < 0.05).
Decreased transporter functionality can alter the extent of metabolism for cosubstrates of PGP and cytochrome P450 (Lau et al., 2004). Whether the same applies to non-P450 substrates such as DOX remains to be investigated. We collected greater amounts of M2 and M3 in the urine of LPS-treated mice. Given that renal clearance was not altered, this may imply an enhanced conversion of DOX to M2 and M3. Indeed, 5-fold higher amounts of M2 were observed in plasma and urine of LPS-treated mice. By comparison, the renal clearance of M3 appeared to be higher in LPS-treated mice. Hence, formation of M2 was likely increased in inflammation, whereas for M3, an enhanced renal secretion (for instance, through induction of renal PGP) seems also plausible. Moreover, we found increased levels of M2 and M3 in intestine and kidney of LPS-treated mice. Thus, LPS treatment likely caused an increased formation of M2 and M3. Indeed, several enzymes involved in the reductive deglycosylation of DOX and doxorubicinol have been found to exhibit enhanced activity during inflammatory and hyperthermic conditions (Dodion et al., 1986; Pfeffer et al., 1994; Kan et al., 2004). We were able to detect M1 in urine but not in plasma, similar to previous reports (Van Asperen et al., 1999). M1 plasma levels are generally below detection limit due to its rapid clearance or sequential metabolism to M3. Hence it may not be possible to quantify M1 formation. It has been postulated that formation and intestinal clearance of M1 may be substantially underestimated due to enzymatic degradation in the gut (Van Asperen et al., 2000). One could also speculate that the metabolic clearance of DOX to M1 might be rate-limiting compared with the renal clearance of M1. Nevertheless, the possibility of increased formation of M1 in LPS-treated mice should not be excluded.
Overall, our findings suggest that acute inflammation causes differential regulation of PGP in liver and kidney, which enables the organism to sustain the elimination of PGP substrate drugs. Enhanced metabolism through selective pathways also occurs. Transporters in nonhepatic tissues can compensate for the loss of transporter function in the liver, the primary site of the acute inflammatory response. Thus, when predicting pharmacokinetics in disease states, it is crucial to consider alternate metabolic pathways. Furthermore, our findings highlight the importance of understanding the tissue-specific mechanisms of transporter and enzyme regulation.
Acknowledgments
We thank Lichuan Liu for technical advice on the bile duct cannulation, and Stephen Mac and Martha Sobolev for assistance with HPLC.
Footnotes
-
This study was funded by grants obtained from the Canadian Institute of Health Research.
-
Article, publication date, and citation information can be found at http://dmd.aspetjournals.org.
-
doi:10.1124/dmd.104.002568.
-
ABBREVIATIONS: PGP, P-glycoprotein; DOX, doxorubicin; P450, cytochrome P450; RT-PCR, reverse transcription-polymerase chain reaction; OD, optical density; AUC, area under the plasma concentration-time curve; Bsep, bile salt export pump; HPLC, high performance liquid chromatography; LPS, lipopolysaccharide (bacterial endotoxin); CLt, total body clearance; M1, metabolite 1 (doxorubicinol); M2, metabolite 2 (7-deoxy-doxorubicinone); M3, metabolite 3 (7-deoxy-doxorubicinolone); Mdr1, multidrug resistance gene.
- Received October 1, 2004.
- Accepted March 16, 2005.
- The American Society for Pharmacology and Experimental Therapeutics


